Abstract
Spinal muscular atrophy (SMA) is a degenerative disorder that selectively deteriorates motor neurons due to a deficiency of survival motor neuron protein (SMN). The illness is the leading genetic cause of death in infants and is difficult to study in complex biological systems such as humans. A simpler model system, such as the nematode C. elegans, can be used to study potential mechanisms underlying this disease; C. elegans expresses the smn-1 gene, a homologue of SMN; powerful genetic tools in C. elegans research can be used to discover novel genes whose effect on SMN remains unknown or uncharacterized. Currently, conventional screening methods are time-consuming and laborious, as well as being subjective and mostly qualitative. To address these issues, we engineer an automated system capable of performing genetic suppressor screens on C. elegans using microfluidics in combination with custom image analysis software. We demonstrate the utility of this system by isolating 21 alleles that significantly suppress motor neuron degeneration at a screening rate of approximately 300 worms per hour. Many of these mutants also have improved motor function. These isolated alleles can potentially be further studied to understand mechanisms of protection against neurodegeneration. Our system is easily adaptable, providing a means to saturate screens not only implicated in the smn-1 pathway, but also for genes involved in other neurodegenerative phenotypes.
Graphical Abstract
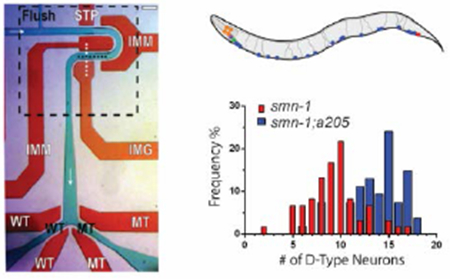
A fully automated high-throughput screen using C. elegans to investigate genetic mechanisms affecting spinal muscular atrophy (SMA).
Introduction
Neuronal degeneration is a fundamental biological phenomenon and a characteristic attribute of neuromuscular diseases, which affect as many as 1 in every 3,000 people[1]. One such disease is spinal muscular atrophy (SMA), an autosomal recessive neurodegenerative disorder that is one of the leading genetic causes of infant mortality[2]. SMA results from a loss of function of survival motor neuron protein (SMN) due to mutations in the SMN1 gene[3, 4]. The decreased SMN function causes specific motor neuron degeneration leading to muscular wasting, paralysis, and even death[2, 5]. Although the genetic bases of SMA have been shown to reside in the Smn1 gene, the molecular mechanisms and pathogenesis leading to SMA remain poorly understood[6].
Caenorhabditis elegans is a nematode and an important model used to elucidate the intricacies of complex cellular processes that underlie neurodegeneration. Previous research has used C. elegans to study molecular mechanisms behind devastating neurodegenerative disorders such as amyotrophic lateral sclerosis, Huntington’s, and Parkinson’s disease[7–10]. The nematode, despite its low level of evolutionary complexity, is particularly well suited for neurobiology research because of the considerable number of conserved molecular pathways between worms and mammals, including major neurotransmitter systems[8, 11]. Furthermore, C. elegans have a mapped and comparatively simple nervous system of 302 neurons, unlike other model organisms that contain thousands to millions of neurons, greatly simplifying analysis of neuronal circuits[12]. The nematode is also uniquely fit for neurodegeneration research because it is transparent, allowing for the inspection of fluorescently labelled neurons within a living multicellular organism at all stages of development[8, 11, 13]. C. elegans is also appealing for genetics research due to its ease of genetic manipulation, mapped genome, and large number of genetic homologs to vertebrates[11, 14, 15]. For instance, 60-80% of the C. elegans genes are homologous to human genetic disease genes, such as smn-1, a homolog of the human SMN protein[11, 16]. Additionally, the 19 D-type motor neurons along the nematode’s ventral nerve cord provide multiple opportunities to study degenerative conditions in a localized area of the animal body.
Currently there are only few well-characterized genetic modulators of human SMN, such as SMN2 and PLS3[5, 17–19]. Studies using C. elegans to discover additional modulators of SMN have utilized visual inspection to measure pharyngeal pumping rates, custom image analysis methods to measure motility, or the COPAS Biosorter to measure animal body length[17, 20–24]. These methods, however, either require manual analysis, are comparatively low-throughput, or provide indirect correlations of motor neuron degeneration. The limitations in these systems, therefore, bottleneck the discovery of SMN modulators and ultimately potential therapies for SMA.
To overcome these limitations, we developed an automated system using microfluidics and computer vision. By manipulating C. elegans in microfluidic chips and automatically analysing high-magnitude images, throughput gains up to two orders of magnitude are achieved when compared to manual methods of handling[25]. Additionally, screening of nematodes on-chip can be performed to take advantage of C. elegans low cost, rapid life cycle, and large number of progeny[11, 14, 25-29].
Here, for the first time, we present a fully automated system to identify modulators of motor neuron phenotypes using genetic screening techniques. Our system reduces human bias and subjective analysis from visual screening practices. Phenotype analysis is rapid, performed within 12 seconds per animal on average, as we directly inspect the animal nervous system, removing the need for behavioral analysis or indirect correlations to motor neuron degeneration. We demonstrate the utility of our system by performing an automated screen and isolating 21 mutants that rescue the neurodegenerative phenotype seen in C. elegans D-type motor neurons due to the silencing of smn-1. Many of the isolated double mutants also show significant improvement of locomotion.
Materials and methods
Microfluidic device fabrication and operation
Microfluidic devices were fabricated using standard soft lithography methods to create single-layer chips made from the elastomer polydimethylsiloxane (PDMS, Dow Corning Sylgard 184)[30]. Master molds were fabricated as in previous work using silicon wafers, SU-8 photoresist (Microchem), and treated with tridecafluoro-1,1,2,2-tetrahydrooctyl-1-trichlorosilane vapor (United Chemical Technologies) to reduce elastomer adhesion to the substrate[25, 27, 28]. Likewise, thermal bonding between a thin (~0.5mm) 20:1 and a thicker (~3mm) 10:1 layer of PDMS was used during chip fabrication to facilitate valve flexibility, while maintaining overall rigidity[28]. After cutting and preparing PDMS devices to interface with tubing and pins, chips were bonded to cover-glass using oxygen plasma.
Similar to our previous work, we used partially closed valves and pressure driven flow to route, image, and sort animals within the device[26, 27]. Channel and chip feature height for our presented design is approximately 60μm for all areas excluding the curved portion of the flow channel in the imaging area, which is approximately 40μm.
C. elegans culture, mutagenesis, and phenotype scoring
The C. elegans strains used in this study are: NA1355 gbIs4[Punc-25::smn-1 RNAi sas; Pchs-2::GFP]; oxIs12[Punc-47::GFP; lin-15(+)] and NA1330 gbIs4[Punc-25::smn-1 RNAi sas; Pchs-2::GFP] [31]. These strains carry gbIs4, a transgene for cell-specific, transgene-driven, RNA-interference to selectively silence smn-1 gene in 19 D-type motoneurons, to which we will refer as smn-1(RNAi sas) or smn-1. To obtain neuron-specific silencing we used a short form of unc-25 promoter, which is specifically expressed from embryonic to adult stages only in 19 D-type motor neurons in the ventral cord and not in other GABAergic neurons[32]. Using a PCR fusion approach[33] the promoter was fused to each orientation of an exon-rich region of smn-1 gene, to obtain sense and antisense fragments[34] The two constructs were then injected at high concentration (200ng/μL) and after demonstrating that this was the condition showing the highest effect, the transgene was integrated (as gbIs4) to increase the penetrance, overcome the variability in the phenotypes, and the incomplete transmission observed when non-integrated transgenes are used[31]. The strain was cultured between 15°C and 25°C using established protocols[14].
For both the manual pilot screen and the automated screen, a standard concentration of the chemical mutagen ethyl methanesulfonate (Sigma Aldrich) was used to mutagenize animals in order to perform a pooled F2 suppressor screen of gbIs4, the smn-1(RNAi sas) mutant[35]. Animals were screened when most animals reached gravid adulthood in terms of age.
Phenotype scoring of alleles isolated from the automated screen was performed on animals cultured at 20°C anesthetized with 5mM concentrations of sodium azide (Sigma Aldrich) on prepared agar slides[36]. All animals were manually inspected under fluorescence for the presence of D-type motor neurons using 20×/0.4NA and 20×/0.5NA objectives on wide field inverted compound microscopes (Leica DM IRB/E and Leica DMI 6000B); fluorescently labeled DVB, RIS, AVL, and RME neurons, where smn-1 is not silenced, were not counted in this analysis. Automated experiments and visual analysis of C. elegans were both performed when animals became gravid adults using the same objectives and microscope equipment as mentioned above. Unless mentioned otherwise, all images are of gbIs4, the smn-1(RNAi sas) neuron specific knockdown strain.
To test whether the suppressing alleles that we identified were impairing the RNA-interference pathway, animals were fed using HT115(DE3) bacterial strain harboring the mom-2 construct from J. Ahringer library (HGMP, Cambridge) [37] [36][37–38]. Five young adults for each strain were placed on NGM plates without bacteria for 1h to remove residual OP50 and then deposited onto NGM plates containing 100 mg/ml ampicillin, 1 mM IPTG, and IPTG-induced HT115(DE3) transformed bacteria and allowed to lay eggs. 9 F1 were removed and allowed to lay F2 progeny, that was quantified in triplicate as larvae or unhatched eggs and their ratio used to determine the percentage of embryonic lethality (unhatched eggs/ unhatched eggs+larvae). Control worms were grown on bacteria transformed with L4440, an empty plasmid from A. Fire (Stanford, California) carrying no insert for RNAi. WM27 rde-1(ne219) mutant animals, which are impaired in RNAi, were used as positive control [38] We were not able to RNA-interfere by feeding two alleles (a201 and a203) for unknown reasons.
To test D-type motor neurons function, backward movement assay was performed blindly on well-fed, young adult animals not carrying the transgene oxIs12, which may contribute to locomotion defective behaviour. To obtain this condition and to eliminate undesired additional mutations, animals from the suppressor screen were outcrossed multiple times against NA1330 gbIs4[Punc-25::smn-1 RNAi sas; Pchs-2::GFP] transgenic strain and the F2 progeny was selected for maintaining suppression of smn-1(RNAi sas) phenotype and carrying the transgene oxIs12 in heterozygous condition, so that we could separate in the next generation oxIs12/oxIs12 homozygotes from non-oxIs12 transgenic animals. To score backward movement, animals were placed in NGM plates (6cm in diameter, seeded with bacteria) and were touched on the tail to induce a forward movement and then on the head to induce a backward movement. A defect in movement was scored when the animals were not able to fully move backward[39].
To test the mode of inheritance of the most interesting alleles, animals from the suppressor screen were outcrossed against a NA1330 strain carrying gbIs4[Punc-25::smn-1 RNAi sas; Pchs-2::GFP] transgene and the F1 non-self progeny, heterozygote for the suppressor allele, was scored for suppression of smn-1(RNAi sas) phenotype.
Automated system operation
System automation describes the process of autonomously controlling all system components to execute animal loading, imaging, phenotype analysis, and sorting. System setup is similar to our previous work utilizing off-chip components such as pneumatic solenoids, a compound microscope, and a digital CCD camera to control on-chip valves; however, no cooling system was used for immobilization in this study[25, 26, 28, 40]. All system automation software was programmed in MATLAB® in conjunction with Micro-Manager[41].
Results and discussion
Microfluidic device performance and pilot screen
In order to perform genetic screens in an automated manner, we used a single-layer microfluidic device, shown in Figure 1. Previous work has shown the potential of microfluidics for vastly improving the throughput of imaging, sorting, and genetic screening studies involving C. elegans [25–28, 42]. A key limitation in many of these devices is the lack of orientation control. The design used in this screen was adapted from existing designs, using curved geometries to passively position animals into lateral orientations for improved inspection and imaging[27]. This orientation method is particularly advantageous when inspecting objects along the ventral nerve cord, such as the D-type motor neurons.
Fig. 1.
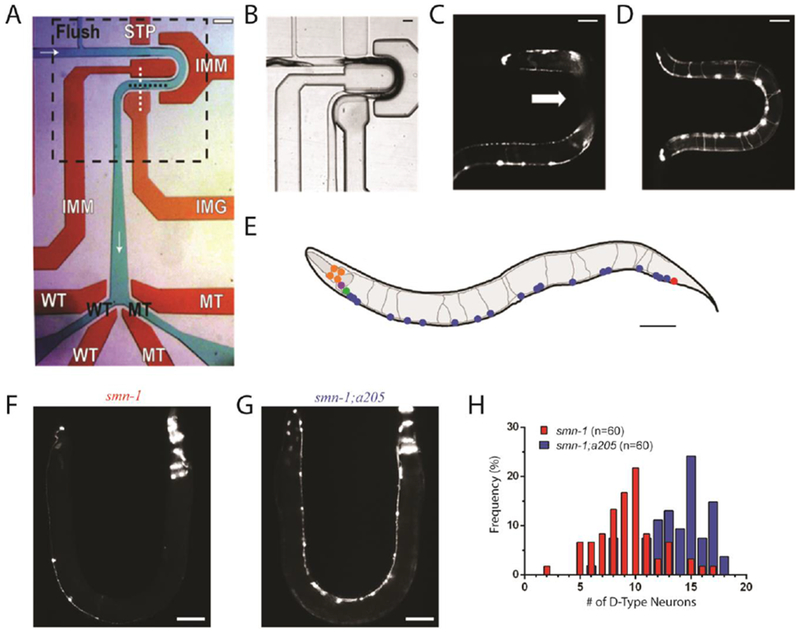
Single layer microfluidic device. (A) Device used for on-chip characterization and automated sorting of C. elegans. Flow layer is shown in green with black text, valve control layer shown in red with white text. Fluid flows from left to right, top to bottom, and is marked by white arrows. Flush channel, wild-type (WT), and mutant (MT) channels are all labelled. STP is the stop valve, IMM are the immobilization valves, IMG is the imaging valve, and WT and MT are the wild-type and mutant valves. Imaging area shown with dashed black box. Scale bar is 200μm. (B) Imaging area shown in panel A demonstrating valve expansion into flow layer and use of two immobilization valves to limit animal movement. Actuating the valve control layer simultaneously routes fluid flow and obstructs animal passage during device operations such as loading (shown) and imaging. (C) Example image of an animal body obstructed by immobilization valves. Device used for this image does not have a height difference in the imaging area. White arrow indicates area obscured from camera. (D) Example image of an animal body not obstructed by immobilization valves. Device used for this image does include a height difference of 20 μm in the imaging area. Scale bar for panels B-D is 70μm. (E) A rendering of a representative image of an adult worm carrying gbIs4[Punc-25::smn-1(RNAi sas); Pchs-2::GFP] [31] and oxIs12[Punc-47::GFP] transgenes, whose expression is visible in panels C, D, F and G. D-type motor neurons are shown in blue, cells expressing Pchs-2::GFP co-injection marker in orange, other GABA neurons where smn-1 is not silenced in red, green and purple. Image not to scale. Scale bar is 70μm (F) Image of one of the most severe example of smn-1(RNAi sas) transgenic animals with 2 out of 19 visible D-type motor neurons. (G) Image of allele smn-1;a205 with 16 out of 19 visible D-type motor neurons. Scale bar for panels F and G is 70μm. (H) Histogram demonstrating differences between motor neuron distributions within the two populations.
Our current design has three improvements. First is the introduction of a partial immobilization method using compressive force from actuated valves (IMM in Fig. 1A and 1B) to limit animal movement during image acquisition. This method allows for improved image quality while maintaining overall ease of device fabrication. Second is the use of a single-layer design which as shown in previous work, maintains compatibility with on-chip valves while greatly simplifying standard multi-layer fabrication techniques[28, 43]. Lastly, to ensure that animals were not obstructed by the use of partial immobilization valves (Fig. 1C), we introduced a height decrease of 20μm in the flow channel of the imaging area. With this height difference, valve obstruction of animal body regions dropped significantly in frequency as animals were more likely to stay close to the cover glass (Fig. 1D).
To verify our ability to find suppressors of the smn-1 mutation using our microfluidic system, we first performed a manual pilot screen of ~1,000 mutagenized animals. We used a strain in which the function of smn-1 is selectively reduced in D-type GABA motor neurons using a neuron-specific RNAi method[31] (Fig. 1E). The silencing of smn-1 in these neurons induces degeneration, detectable as the disappearance of motor neurons expressing GFP (from the oxIs12[Punc-47::GFP] transgene) (Fig. 1F). We performed mutagenesis on a population of smn-1(RNAi sas) mutants (Materials and Methods), and loaded and manually inspected mutagenized animals on-chip to search for animals with a high number of neurons. All animals were inspected as gravid adults as age-associated neurodegenerative diseases in humans demonstrate similar age dependence in many C. elegans transgenic models, including ours[31]. From this screen, we isolated allele a205 (Fig. 1G), which displayed a statistically significant difference in visible neuron number when compared to smn-1(RNAi sas) knockdown mutant, 13.8±2.7 for smn-1;a205 (n=54) versus 9.3±2.8 for smn-1 (n=60) respectively (population average ± standard deviation, p<0.0001, t-test).
While the average number of neurons provides some information about the differences between these populations, further insight is obtained through analysis of the numerical distribution of neurons present for each allele. For example, inspecting the histogram data for smn-1 and smn-1;a205 (Fig. 1H) reveals the amount of phenotypic overlap between strains, due to natural variations within the population, which is potentially concealed when only considering mean and standard deviation values between populations.
Software design and validation for automated screen
Upon the discovery of a suppressor mutant, allele a205 was used for the development and testing of custom neuron detection software. Figure 2A demonstrates the background (β), worm (ω), and correct position (ρ) areas used for detecting an animal within the imaging area of the device. This method uses average intensity thresholds of each region to scan for the presence of nematodes (Materials and methods). Figure 2B-F displays the step by step process of discovering neurons while minimizing the detection of false positives such as miscellaneous image artefacts, fluorescent co-injection marker present in the head of the animal, or neurons where smn-1 is not silenced in the tail. We verified the effectiveness of this method by hand-selecting neurons from a set of high quality images and compared them with our software results. Strain smn-1;a205 was used in place of smn-1 due to interest in isolating similar phenotypes with a comparatively high number of neurons from suppressor screens (14 neurons on average for smn-1;a205 versus 9 for smn-1). Using these images, we found that our software algorithm was capable of correctly identifying 87% of fluorescently labelled motor neurons in our image library (448 correctly identified out of 513 determined visually, 56 total images). The amount of false positives, or objects detected by our program that were not actually neurons was 8% (39 of all 487 objects detected); while the amount of false negatives, or actual neurons that were not detected by our software, was 13% (65 of 513 visually determined neurons). The average number of false positives per image was 0.7±0.8, while false negatives per image was 1.2±1.3 (mean ± standard deviation, n=56).
Fig. 2.
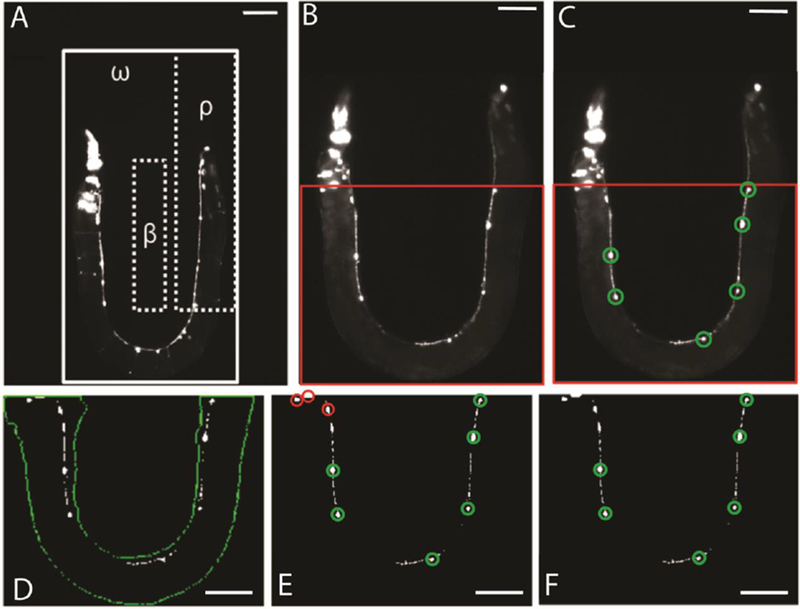
On-chip image analysis for system automation. (A) Image of animal taken on-chip with example background (β), worm imaging (ω), and correct position (ρ) regions marked. Solid line borders ω, while dashed boxes show β and ρ. The mean intensity for all pixel values within each region are calculated and used to determine status of system through equations (1-2). Scale bar is 70μm. (B) Representative zoomed in image of ω in panel A. Different animal shown. (C) Results of image analysis. Detected D-type motor neurons circled in green. Red box in B-C marks analysis area. Only the analysis area is processed during system operation in order to reduce the number of false positive D-type motor neurons detected due to head and tail co-injection markers. Scale bar for B-C is 70μm. (D) Segmentation of key features using empirically determined global thresholds. Worm body outline is shown in green while detected objects are shown in white. Objects detected outside of worm body are discarded. (E) Size and morphology filtering to isolate detected neurons. True positive segmentation results from D circled in green. False positive neurons detected during intensity segmentation, but removed due to size and morphological filtering, circled in red. (F) Remaining objects after all image analysis processes shown circled in green. Scale bar for panels D-F is 70μm. Animals carry the transgenes oxIs12[Punc-47::GFP] and gbIs4[Punc-25::smn-1(RNAi sas)].
Reviewing segmented neurons from our image library reveals that most false positives are due to mistaking puncta, RME or DVB neurons, and cells expressing the co-injection marker, for D-type motor neurons. Size filters in our custom software reduce the number of puncta and RME neurons detected by removing objects too small or too large to be considered D-type neurons. However, a careful balance must be maintained when setting size thresholds as altering ranges to decrease false positives can simultaneously increase the number of false negatives, resulting in actual neurons not meeting requirements for detection. In this work, size thresholds were determined from empirical results and set to values to minimize the amount of both false positives and negatives.
To further decrease the number of false positives, we also limited the area of image analysis (area labelled in red in Fig. 2B), and applied a mean filter to binary images. Image analysis was reduced to the mentioned area due to the observation that curved device geometry places head and tail regions in the same image section. Therefore, removing these areas from analysis decreases the risk of detecting false positives in head and tail regions which contain RME and DVB neurons, as well as cells expressing the co-injection marker. To compensate for occurrences when the head area of the animal is within our analysis region, we use a mean filter to combine and remove any objects within close proximity of each other that are falsely detected as neurons. While the head region of animals are the most prone to detection of a high number of false positives (Fig. 3A-B), this can also occur due to animals with egg laying deficiencies (Fig. 3C-D), or due to multiple animals within the analysis region (Fig. 3E-F).
Fig. 3.
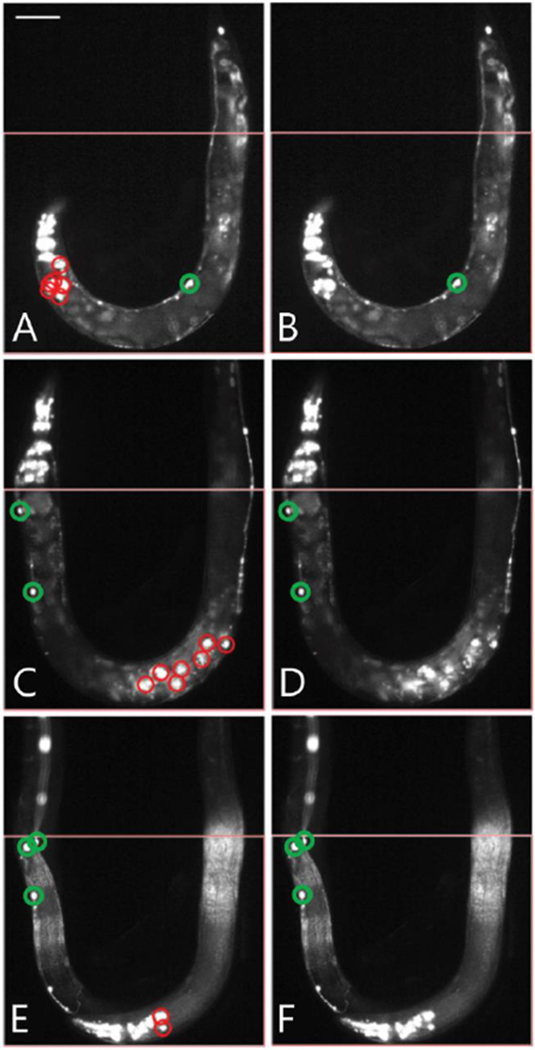
Application of mean-filter to remove false positives. (A) Image of randomly mutated smn-1(RNAi sas) animal loaded on-chip with the head region present in the analysis area. Co-injection marker expressing cells, not removed by previous analysis steps, are falsely detected as neurons, labelled in red. (B) Results of mean and size filter to remove false-positives from panel A. Objects that were previously detected in the head region have been removed. Final results shown in green. (C) Image of randomly mutated smn-1(RNAi sas) animal loaded on-chip demonstrating egg laying deficiency. Fluorescent markers of progeny within parent falsely detected as neurons labelled in red. (D) Results of mean and size filter, objects previously detected within the animal body removed. Final results shown in green. (E) Example of multiple animals within the imaging area. Falsely detected neurons from the head of one animal are detected along with neurons from the other animal’s body. Falsely detected D-type neurons shown in red. (F) Results after applying mean and size filter to remove co-injection markers seen in head of worm. Final results shown in green. Scale bar for all panels is 70μm. All animals carry the transgenes oxIs12[Punc-47::GFP] and gbIs4[Punc-25::smn-1(RNAi sas)].
False negatives detected in our sample image library can be attributed to neurons not meeting minimum or maximum size threshold requirements. These instances occur when neurons are too small due to natural variation between animal expression and size, or too large due to diffused light from out of focus neurons. Images captured for analysis within our device are captured at a single focal plane, which expedites the time required for image acquisition and removes the need for further immobilization schemes typically required for Z-stacks. Additionally, we do not observe a focus drift during our experimental sessions.
While any error in our detection results is undesirable, we are especially concerned with high numbers of false positives because they mimic a partial rescue phenotype. In this case, we err on the side of having a higher number of false negatives than false positives as putative suppressors require further phenotyping to assess penetrance and degree of rescue. Software results from testing on our sample image library show that both the average false positive and false negative rates for neuron detection are approximately one neuron, and are considerably low when compared to the average difference in neuron number between smn-1(RNAi sas) phenotype and suppressors of that mutation (approximately five). Therefore, neuron detection software is adequate for an automated screen.
Automated screen for suppressors of smn-1 silencing
To test the ability of our system to successfully identify and sort suppressors of the smn-1(RNAi sas) phenotype (referred to as double mutants from this point forward), we performed an automated pilot screen of over 7,500 F2 mutagenized animals (>750 haploid genomes). Our average screening rate was approximately 300 animals per hour, calculated over 8 trials on different days, and utilizing multiple microfluidic devices of identical design. All animals were imaged and analyzed using a single focal plane on-chip, determined manually at the beginning of each screen. Similarly, analysis regions for automated worm detection were manually selected at the beginning of each automated screening experiment.
In this automated screen, we isolated 74 potential double mutants. Of these double mutants detected and sorted by our automated system, approximately 62% were visually verified as having phenotypes different from smn-1(RNAi sas) mutants, containing 10 or more neurons within the analysis area (n=46 over 74 total mutants). This analysis, however, takes into account double mutants sorted before the implementation of a mean filter to reduce the number of false positives in neuron detection. Analysing only mutants sorted after the implementation of the mean filter increases the sorting accuracy of our system to 85% (n=23 of 27 total).
Many factors can lead to classification errors during automated phenotype analysis due to the random nature of forward genetic screens. Differences in body size (affecting head position), loading of multiple worms into the imaging area, or animals with progeny that have hatched inside of them complicate analysis, normally requiring individual software solutions specific for each circumstance. However, using a mean filter as the final step in neuron detection provided a single solution for these issues while increasing the sorting accuracy of our system 23%.
Characterization of isolated alleles
From our potential pool of 74 double mutants, we decided to confirm the data from the automated screening by manual inspection and scoring of each population. This secondary screening resulted in 21 suppressors of the smn-1(RNAi sas) phenotype (Fig. 4), isolated from eight different pooled populations. A table of the number of neurons for each isolated allele is listed in Supplemental Table S1. All double mutants were found to be statistically different when compared to the smn-1(RNAi sas) single mutant (p<0.0001 for all alleles except a185, which is p<0.001, one-way ANOVA Dunnett’s post-test).
Fig. 4.
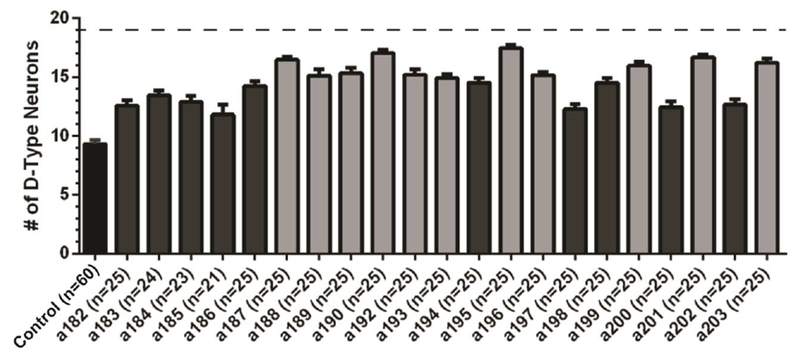
Average number of D-type motor neurons per allele. Error bars represent standard error of mean. Control is shown in black (non mutagenized) and corresponds to smn-1(RNAi sas) single mutant; isolated alleles are shown in grey. All animals carry the transgenes oxIs12[Punc-47::GFP] and gbIs4[Punc-25::smn-1(RNAi sas)]. Dashed line corresponds to wild-type condition, where all 19 motor neurons are always visible. Lighter grey designates alleles considered to be strong suppressors of the smn-1(RNAi sas) phenotype. Data were obtained by manual scoring the double mutants.
For the purpose of this study, we considered strong suppressors of the smn-1(RNAi sas) phenotype to have an average of approximately 15 neurons for their respective population. This number was chosen because it corresponds with the 95% confidence interval of smn-1 (mean + 1.96 × standard deviation). Using this measure, we find that 11 of the 21 isolated alleles are strong suppressors of the smn-1(RNAi sas) phenotype (a187-a190, a192, a193, a195, a196, a199, a201, a203). Allele a195 is the strongest suppressor demonstrating a near perfect rescue of the neurodegenerative phenotype with 17.5±1.2 neurons on average of the possible 19 (mean ± standard deviation).
Fig. 5A demonstrates the cumulative distribution functions (CDF) for all isolated double mutants which can be used to visualize the differences in numerical distributions between alleles. Analyzing the CDF illustrates the effect of the allele for suppressing the neurodegenerative phenotype of smn-1(RNAi sas) in a whole population. The farther right shifted the distribution function is, the more consistent the suppression. Furthermore, this characterization demonstrates the variability in the phenotypes of smn-1 and the discovered suppressor mutants. The CDF for alleles a194-a198 and a202-a203 are shown in Fig. 5B and display varying levels of smn-1(RNAi sas) rescue for strains isolated from the same pooled population. A histogram of three representative alleles from this group is shown in Fig. 5C and reveals the small amount of overlap between each double mutant, demonstrating unique phenotypes among potential siblings. These comparisons illustrate that our system is capable of capturing animals with varying levels of smn-1(RNAi sas) rescue, even when screening for single animals. Additionally, our system is not limited to only strong suppressors of the neurodegenerative mutation.
Fig. 5.
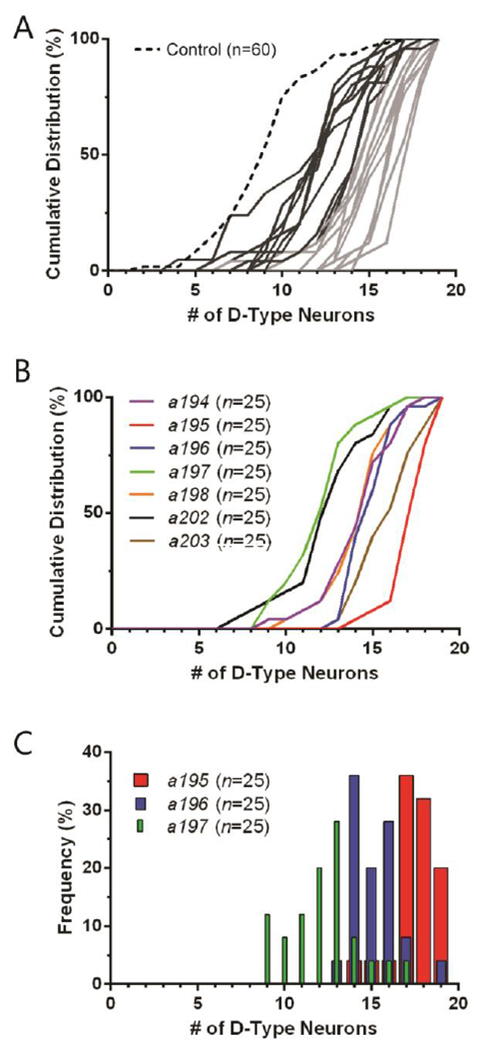
Characterization of isolated alleles. (A) Cumulative distribution functions (CDF) for isolated alleles from automated suppressor screen. Control is smn-1(RNAi sas) single mutant (non mutagenized) and is shown in dashed black line;s putative double mutant alleles in grey. Lighter grey designates alleles considered to be strong suppressors of the smn-1(RNAi sas) phenotype. (B) CDFs for seven alleles isolated from same F1 parent population (possible siblings). (C) Histogram for alleles a195, a196, and a197 shown in panel B. Only data from manual scoring, not image analysis, was used for this figure.
To verify whether any of the mutant alleles affects the RNAi machinery, thus causing a non-informative “technical” suppression of smn-1(RNAi sas) induced degeneration, we silenced mom-2 essential gene using RNAi by feeding[44] (Fig. 6). RNA interference of mom-2 causes a fully penetrant embryonic lethality in wild-type animals and smn-1(RNAi sas) non-mutagenized parental strain and this phenotype is completely suppressed in rde-1 knock out animals, which are strongly resistant to RNAi. Among the 21 suppressors obtained from the secondary screening, only 10 alleles showed 100% lethality, while four (a186, a190, a200, a202) showed an almost complete suppression of the phenotype, similar to rde-1 positive control mutant strain, and therefore discarded from further analysis.
Fig. 6.
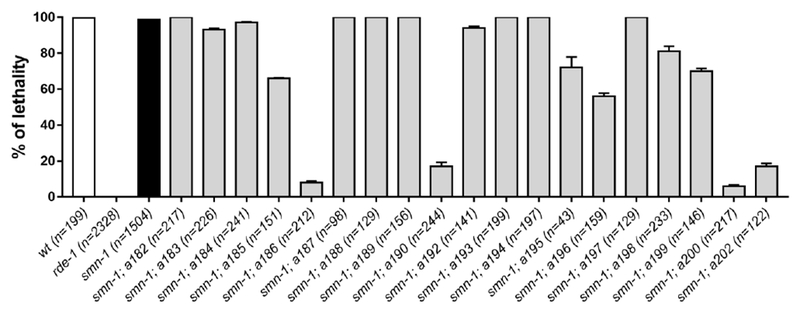
Characterization of the RNAi efficiency in isolated alleles by silencing mom-2 essential gene. Each bar represents the percentage of unhatched eggs over the entire progeny laid. Error bars represent standard error of mean. The total progeny scored is indicated (n). Only a186, a190, a200, a202 alleles present a severe impairment in the RNAi machinery, below 50% of lethality. All animals, except the wild-type (wt) and rde-1(ne219), carry the transgenes gbIs4[Punc-25::smn-1(RNAi sas)]; oxIs12[Punc-47::GFP].
The isolated alleles rescue the defect in locomotion
To demonstrate that the suppression of smn-1(RNAi sas) neurodegenerative phenotype corresponds to a functional rescue of the effects caused by smn-1 silencing, we tested the locomotion behaviour of suppressor alleles (not impaired in RNAi) choosing the strongest and healthy ones. The regulation of C. elegans backward movement involves D-type motor neurons[39] and the silencing of smn-1 in these neurons causes severe defects in locomotion[31]. Most of the alleles tested show a strong and significant increase in the number of animals with a normal backward movement compared to smn-1 alone (Fig. 7), confirming a functional rescue and the role of 9 isolated alleles in suppressing various smn-1(RNAi sas) induced defects. Unexpectedly all these alleles showed a dominant or semidominant mode of inheritance, except a196 allele.
Fig. 7.
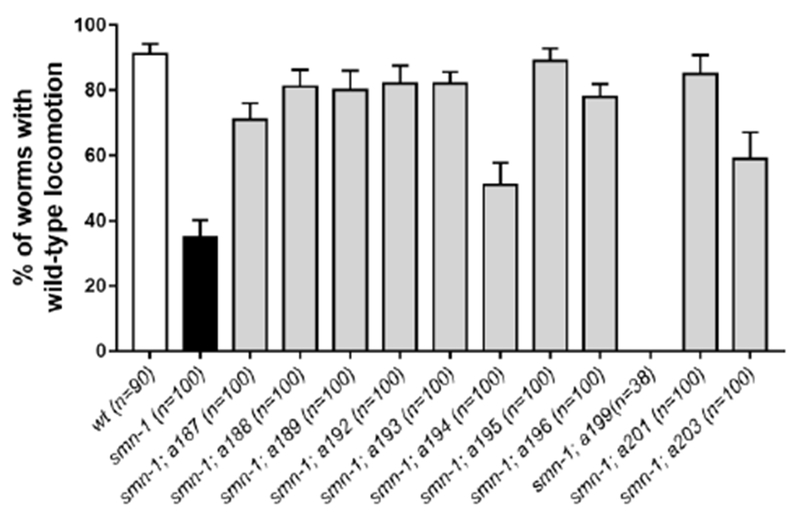
Most of the interesting alleles rescue the defect in locomotion of smn-1(RNAi sas). Each bar represents the mean percentage of animals with a normal backward locomotion. Error bars represent standard error of mean. The number of animal tested is indicated (n). All the alleles present a significant rescue compared to smn-1 alone (P<0.005, non-parametric Kruskal-Wallis test), except a194 (P=0.2434) and a199 which are completely immobile. All animals, except the wild-type (wt), carry the transgene gbIs4[Punc-25::smn-1(RNAi sas)].
Conclusions
We present an automated system to perform suppressor screens aimed at identifying novel modulators of smn-1 mediated neuronal degeneration. Using comparatively simple microfluidic designs and image analysis methods, we are capable of performing these screens at a consistent rate of 300 worms per hour, approximately 100 times faster than standard methods. Additionally, we provide a system capable of directly examining motor neurons within C. elegans to characterize degeneration. We demonstrate that our software analysis is selective by sorting approximately one percent of the 7,500 animals screened, and validate our classification algorithm accuracy of 85% through visual analysis of sorted double mutants. Using our microfluidic system and software in concert, we successfully isolated 21 alleles suppressing the smn-1(RNAi sas) neurodegenerative phenotype. We identified 15 of these alleles as not impaired in RNAi machinery and, among these, 9 were confirmed for their capability to strongly increase the number of visible D-type MNs and rescued the defect in locomotion elicited by smn-1(RNAi sas). Two alleles (a194 and a199) did not rescue the locomotion defect thus demonstrating an additional benefit of our approach over high throughput behavorial screening. To our knowledge, this is the first implementation of an automated forward genetic screen for mutants affecting the SMN-1 neurodegenerative phenotype.
Our system is versatile, using simple and widely available image analysis techniques, and can easily be adapted to search for other neurodegenerative mutants instead of suppressors with minimal changes. This work, therefore, lays the ground for saturate screens searching for genes that modulate neurodegeneration. By elucidating the molecular mechanisms and pathways that cause neurodegenerative diseases, we can potentially discover new treatments for various neurological and neuromuscular pathologies, not limited to genes that only influence smn-1 or SMA.
Supplementary Material
Spinal muscular atrophy (SMA) is a neuronal degenerative disorder that arises from deterioration of motor neurons due to a deficiency of survival motor neuron protein (SMN), but mechanisms affecting this disorder are poorly understood. The nematode C. elegans can be used to investigate potential mechanisms underlying this disease as it expresses smn-1 gene, a homologue of SMN. In this work, we present a system capable of performing a high-throughput screen using C. elegans to investigate mechanisms behind SMA. We performed a fully automated forward genetic screen using microfluidics, machine vision, and automation, improving the screening rate by two orders of magnitude over standard methods. The screen resulted in 21 isolated alleles that suppress the smn-1 mutation.
Acknowledgements
The authors acknowledge the Goizueta Foundation (fellowship to IC), the U.S. National Science Foundation (IGERT DGE-0333411 for IC, CAREER CBET 0954578 to HL), EMBO (fellowship to IG), the Italian Telethon Foundation (GGP16203 to EDS), the Italian Ministry of Economy and Finance (Project FaReBio to EDS), the Italian Ministry of Health (RF2009-1473235 to EDS), the U.S. National Institutes of Health (F31GM093351 to IC; R21EB012803, R01GM088333, and R01AG035317 to HL). We thank G. Zampi, C. Alberico and C. Fox for assistance with worm culture; L. Chingozha, A. San-Miguel, and other members of the Lu lab for helpful discussions and comments; A. Fire (Stanford University, USA) for reagents; and N. Hotaling for assistance with statistical methods. Nematode strains used in this work were provided by the Caenorhabditis Genetics Center (funded by National Institute of Health – Office of Research Infrastructure Programs (P40 OD010440)).
Footnotes
Electronic Supplementary Information (ESI) available: Supplementary figures and tables. See DOI: 10.1039/b000000x/
Notes and references
- 1.Sleigh JN and Sattelle DB, C. ELEGANS MODELS OF NEUROMUSCULAR DISEASES EXPEDITE TRANSLATIONAL RESEARCH. Translational Neuroscience, 2010. 1(3): p. 214–227. [Google Scholar]
- 2.Verhaart IEC, et al. , Prevalence, incidence and carrier frequency of 5q–linked spinal muscular atrophy – a literature review. Orphanet Journal of Rare Diseases, 2017. 12(1): p. 124. [DOI] [PMC free article] [PubMed] [Google Scholar]
- 3.Gennarelli M, et al. , Survival Motor-Neuron Gene Transcript Analysis in Muscles from Spinal Muscular-Atrophy Patients. Biochemical and Biophysical Research Communications, 1995. 213(1): p. 342–348. [DOI] [PubMed] [Google Scholar]
- 4.Lefebvre S, et al. , Identification and characterization of a spinal muscular atrophy-determining gene. Cell, 1995. 80(1): p. 155–165. [DOI] [PubMed] [Google Scholar]
- 5.Lefebvre S, et al. , Correlation between severity and SMN protein level in spinal muscular atrophy. Nature Genetics, 1997. 16: p. 265. [DOI] [PubMed] [Google Scholar]
- 6.Groen EJN, Talbot K, and Gillingwater TH, Advances in therapy for spinal muscular atrophy: promises and challenges. Nature Reviews Neurology, 2018. 14: p. 214. [DOI] [PubMed] [Google Scholar]
- 7.Wolozin B, et al. , Watching Worms Whither: Modeling Neurodegeneration in C. elegans, in Animal Models of Human Disease. 2011. p. 499–514. [DOI] [PMC free article] [PubMed] [Google Scholar]
- 8.Dimitriadi M and Hart AC, Neurodegenerative disorders: Insights from the nematode Caenorhabditis elegans. Neurobiology of Disease, 2010. 40(1): p. 4–11. [DOI] [PMC free article] [PubMed] [Google Scholar]
- 9.Harrington AJ, et al. , C. elegans as a Model Organism to Investigate Molecular Pathways Involved with Parkinson’s Disease. Developmental Dynamics, 2010. 239(5): p. 1282–1295. [DOI] [PubMed] [Google Scholar]
- 10.Bates GP, History of genetic disease - The molecular genetics of Huntington disease - a history. Nature Reviews Genetics, 2005. 6(10): p. 766–773. [DOI] [PubMed] [Google Scholar]
- 11.Kaletta T and Hengartner MO, Finding function in novel targets: C-elegans as a model organism. Nature Reviews Drug Discovery, 2006. 5(5): p. 387–398. [DOI] [PubMed] [Google Scholar]
- 12.White JG, et al. , The Structure of the Nervous-System of the Nematode Caenorhabditis-Elegans. Philosophical Transactions of the Royal Society of London Series B-Biological Sciences, 1986. 314(1165): p. 1–340. [DOI] [PubMed] [Google Scholar]
- 13.Chalfie M, et al. , Green Fluorescent Protein as a Marker for Gene-Expression. Science, 1994. 263(5148): p. 802–805. [DOI] [PubMed] [Google Scholar]
- 14.Brenner S, GENETICS OF CAENORHABDITIS-ELEGANS. Genetics, 1974. 77(1): p. 71–94. [DOI] [PMC free article] [PubMed] [Google Scholar]
- 15.Consortium, T.C.e.S., Genome Sequence of the Nematode C. elegans: A Platform for Investigating Biology. Science, 1998. 282(5396): p. 2012–2018. [DOI] [PubMed] [Google Scholar]
- 16.Miguel-Aliaga I, et al. , The Caenorhabditis elegans orthologue of the human gene responsible for spinal muscular atrophy is a maternal product critical for germline maturation and embryonic viability. Human Molecular Genetics, 1999. 8(12): p. 2133–2143. [DOI] [PubMed] [Google Scholar]
- 17.Dimitriadi M, et al. , Conserved Genes Act as Modifiers of Invertebrate SMN Loss of Function Defects. Plos Genetics, 2010. 6(10). [DOI] [PMC free article] [PubMed] [Google Scholar]
- 18.Oprea GE, et al. , Plastin 3 is a protective modifier of autosomal recessive spinal muscular atrophy. Science, 2008. 320(5875): p. 524–527. [DOI] [PMC free article] [PubMed] [Google Scholar]
- 19.Monani UR, et al. , A single nucleotide difference that alters splicing patterns distinguishes the SMA gene SMN1 from the copy gene SMN2. Human Molecular Genetics, 1999. 8(7): p. 1177–1183. [DOI] [PubMed] [Google Scholar]
- 20.Buckingham SD and Sattelle DB, Fast, automated measurement of nematode swimming (thrashing) without morphometry. Bmc Neuroscience, 2009. 10. [DOI] [PMC free article] [PubMed] [Google Scholar]
- 21.Sleigh JN, et al. , A novel Caenorhabditis elegans allele, smn-1(cb131), mimicking a mild form of spinal muscular atrophy, provides a convenient drug screening platform highlighting new and pre-approved compounds. Human Molecular Genetics, 2011. 20(2): p. 245–260. [DOI] [PubMed] [Google Scholar]
- 22.Pulak R, Techniques for analysis, sorting, and dispensing of C-elegans on the COPAS (TM) flow-sorting system, in Methods in Molecular Biology. 2006. p. 275–286. [DOI] [PubMed] [Google Scholar]
- 23.Briese M, et al. , Deletion of smn-1, the Caenorhabditis elegans ortholog of the spinal muscular atrophy gene, results in locomotor dysfunction and reduced lifespan. Human Molecular Genetics, 2009. 18(1): p. 97–104. [DOI] [PMC free article] [PubMed] [Google Scholar]
- 24.Di Giorgio ML, et al. , WDR79/TCAB1 plays a conserved role in the control of locomotion and ameliorates phenotypic defects in SMA models. Neurobiology of Disease, 2017. 105: p. 42–50. [DOI] [PubMed] [Google Scholar]
- 25.Chung KH, Crane MM, and Lu H, Automated on-chip rapid microscopy, phenotyping and sorting of C. elegans. Nature Methods, 2008. 5(7): p. 637–643. [DOI] [PubMed] [Google Scholar]
- 26.Crane MM, Chung K, and Lu H, Computer-enhanced high-throughput genetic screens of C. elegans in a microfluidic system. Lab on a Chip, 2009. 9(1): p. 38–40. [DOI] [PubMed] [Google Scholar]
- 27.Caceres ID, et al. , Laterally Orienting C. elegans Using Geometry at Microscale for High-Throughput Visual Screens in Neurodegeneration and Neuronal Development Studies. Plos One, 2012. 7(4). [DOI] [PMC free article] [PubMed] [Google Scholar]
- 28.Lee H, et al. , Quantitative screening of genes regulating tryptophan hydroxylase transcription in Caenorhabditis elegans using microfluidics and an adaptive algorithm. Integrative Biology, 2013. 5(2): p. 372–380. [DOI] [PMC free article] [PubMed] [Google Scholar]
- 29.Samara C, et al. , Large-scale in vivo femtosecond laser neurosurgery screen reveals small-molecule enhancer of regeneration. Proceedings of the National Academy of Sciences of the United States of America, 2010. 107(43): p. 18342–18347. [DOI] [PMC free article] [PubMed] [Google Scholar]
- 30.Xia YN and Whitesides GM, Soft lithography. Annual Review of Materials Science, 1998. 28: p. 153–184. [Google Scholar]
- 31.Gallotta I, et al. , Neuron-specific knock-down of SMN1 causes neuron degeneration and death through an apoptotic mechanism. Human Molecular Genetics, 2016. 25(12): p. 2564–2577. [DOI] [PMC free article] [PubMed] [Google Scholar]
- 32.Eastman C, Horvitz HR, and Jin Y, Coordinated Transcriptional Regulation of the <em>unc-25</em>Glutamic Acid Decarboxylase and the <em>unc-47</em> GABA Vesicular Transporter by the <em>Caenorhabditis elegans</em> UNC-30 Homeodomain Protein. The Journal of Neuroscience, 1999. 19(15): p. 6225. [DOI] [PMC free article] [PubMed] [Google Scholar]
- 33.Hobert O, PCR fusion-based approach to create reporter gene constructs for expression analysis in transgenic C. elegans. BioTechniques, 2002. 32(4): p. 728–730. [DOI] [PubMed] [Google Scholar]
- 34.Esposito G, et al. , Efficient and cell specific knock-down of gene function in targeted C. elegans neurons. (0378–1119 (Print)). [DOI] [PubMed] [Google Scholar]
- 35.Jorgensen EM and Mango SE, The art and design of genetic screens: Caenorhabditis elegans. Nat Rev Genet, 2002. 3(5): p. 356–369. [DOI] [PubMed] [Google Scholar]
- 36.Shaham S., Methods in cell biology, in WormBook, T.C.e.R. Community, Editor., WormBook. [Google Scholar]
- 37.Timmons L and Fire A, Specific interference by ingested dsRNA. Nature, 1998. 395(6705): p. 854. [DOI] [PubMed] [Google Scholar]
- 38.Tabara H, et al. , The rde-1 gene, RNA interference, and transposon silencing in C. elegans. (0092–8674 (Print)). [DOI] [PubMed]
- 39.McIntire SL, et al. , THE GABAERGIC NERVOUS-SYSTEM OF CAENORHABDITIS-ELEGANS. Nature, 1993. 364(6435): p. 337–341. [DOI] [PubMed] [Google Scholar]
- 40.Crane MM, et al. , Autonomous screening of C-elegans identifies genes implicated in synaptogenesis. Nature Methods, 2012. 9(10): p. 977–980. [DOI] [PMC free article] [PubMed] [Google Scholar]
- 41.Edelstein A, et al. , - Computer Control of Microscopes Using μManager. 2010. [DOI] [PMC free article] [PubMed] [Google Scholar]
- 42.Migliozzi D, et al. A microfluidic array for high-content screening at whole-organism resolution. in SPIE BiOS 2018. SPIE. [Google Scholar]
- 43.Unger MA, et al. , Monolithic microfabricated valves and pumps by multilayer soft lithography. Science, 2000. 288(5463): p. 113–116. [DOI] [PubMed] [Google Scholar]
- 44.Dudley NR, Labbe B Goldstein Jc Fau, and Goldstein B, Using RNA interference to identify genes required for RNA interference. (0027–8424 (Print)). [DOI] [PMC free article] [PubMed]
Associated Data
This section collects any data citations, data availability statements, or supplementary materials included in this article.


