

Abstract
Background and Purpose
The concentrative nucleoside transporter 2 (CNT2) mediates the uptake of both natural nucleosides and nucleoside‐derived drugs. Therefore, it is important both physiologically and pharmacologically. However, CNT2 expression is significantly repressed in colorectal cancer (CRC). Here, we have elucidated the mechanism(s) underlying CNT2 repression in CRC.
Experimental Approach
Repression of CNT2 in tumour samples from patients with CRC was identified using Western blot and RT‐qPCR. The histone acetylation state at the CNT2 promoter region was then evaluated with chromatin immunoprecipitation and trichostatin A (TSA) treatment. To find the key enzyme responsible for hypoacetylation at the CNT2 promoter region, siRNA knockdown and RT‐qPCR were used. Effects of combining HDAC inhibitors and cladribine were studied in HCT15 and HT29 cells.
Key Results
Histone deacetylase 7 was significantly up‐regulated in CRC, leading to histone hypoacetylation at the CNT2 promoter region, especially at sites H3K9Ac, H3K18Ac and H4Ac. This hypoacetylation condensed the chromatin structure and reduced CNT2 expression. All these effects were reversed by treatment with TSA, a histone deacetylase inhibitor. In HCT15 and HT29 cells, inhibition of histone deacetylase increased cell uptake and decreased IC50 for cladribine.
Conclusions and Implications
Histone hypoacetylation due to increased levels of histone deacetylase 7 results in CNT2 repression in CRC tumour tissue and could lead to decreased uptake of and consequent resistance to nucleoside anti‐cancer agents. Such resistance could be overcome by combining inhibitors of histone deacetylase with the nucleoside anti‐cancer agent.
Abbreviations
- 2‐CdA
cladribine
- CRC
colorectal cancer
- TSA
trichostatin A
- HDAC
histone deacetylase
- HAT
histone acetyltransferase
Introduction
Colorectal cancer (CRC) is the third most common cancer and the fourth‐leading cause of cancer‐related deaths worldwide (Favoriti et al., 2016). The cornerstones of CRC therapy are surgery, neoadjuvant radiotherapy and adjuvant chemotherapy. For patients with irresectable distant metastases, chemotherapy is the primary choice of treatment (Brenner et al., 2014).
Epigenetic alterations are known to play a key role in CRC development (Okugawa et al., 2015). Epigenetics is the study of heritable alterations in gene expression that are not mediated by changes in DNA sequence, including DNA methylation, histone modification, nucleosome remodelling and non‐coding RNA expression (Bird, 2002; Liu et al., 2016). Histone modifications include acetylation, methylation, phosphorylation, ubiquitylation, ADP‐ribosylation and deamination (Minucci and Pelicci, 2006). http://www.guidetopharmacology.org/GRAC/FamilyDisplayForward?familyId=872 and http://www.guidetopharmacology.org/GRAC/FamilyDisplayForward?familyId=848 are key enzymes involved in maintaining the levels of histone acetylation. Histone acetylation is an indicator of active transcription. Therefore, HATs and HDACs are associated with active and inactive genes respectively (Wang et al., 2009). Hyperacetylation of histones relaxes the chromatin structure and increases transcriptional activity, whereas hypoacetylation of histones condenses the chromatin structure (Codd et al., 2009). http://www.guidetopharmacology.org/GRAC/LigandDisplayForward?ligandId=7005 is an HDAC inhibitor, which increases the level of histone acetylation and up‐regulates transcription (Codd et al., 2009).
The http://www.guidetopharmacology.org/GRAC/ObjectDisplayForward?objectId=1115 is a sodium‐dependent transporter, present in many tissues, including the kidney, liver, heart, brain, placenta, pancreas, skeletal muscle, colon, rectum, duodenum, jejunum and ileum (Wang et al., 1997; Pennycooke et al., 2001). CNT2 mediates the uptake of both natural nucleosides and nucleoside‐derived drugs, including http://www.guidetopharmacology.org/GRAC/LigandDisplayForward?ligandId=4799 (2‐CdA), http://www.guidetopharmacology.org/GRAC/LigandDisplayForward?ligandId=4802 and http://www.guidetopharmacology.org/GRAC/LigandDisplayForward?ligandId=6842, which are used widely for the treatment of cancer and viral infections (Mackey et al., 1998; Baldwin et al., 1999; Gray et al., 2004; Owen et al., 2006; Minuesa et al., 2008; Elwi et al., 2009). However, in tumour tissue samples from the kidney, stomach, rectum and small intestine, CNT2 expression is reduced, leading to resistance to nucleoside drugs (Pennycooke et al., 2001; Lotfi et al., 2003). It has recently been reported that CNT2 is also associated with cell differentiation and energy metabolism in cells (Pastor‐Anglada et al., 2007; Huber‐Ruano et al., 2010). Despite the clinical importance of CNT2, the regulation of its expression in cancer has not yet been elucidated. In this study, we found that CNT2 expression was significantly repressed in tumour tissue samples from patients with CRC and we have determined the epigenetic mechanisms underlying this finding. We also used cell lines derived from CRC, HCT15 and HT29, to assess the effects of HDAC inhibition on CNT2 expression and on cellular uptake of 2‐CdA. We also tested the effects of a combination of HDAC inhibitors and 2‐CdA in HCT15 and HT29 cells. This combination enhanced the anti‐cancer effects of 2‐CdA and led to the reversal of CNT2 repression.
Methods
Tumour tissue samples from 44 patients with CRC were drawn from the Specimen Bank of Zhejiang Cancer Hospital at Hangzhou, China, with the approval by the Institutional Review Board of Zhejiang Cancer Hospital. Patient information is provided in Supporting Information Table S1.
RNA extraction and RT‐qPCR analysis
Total RNA from tissues and cells was isolated using different commercial kits and then reverse transcribed to cDNA with PrimeScript RT Master Mix, following the manufacturer's instructions. Quantitative real‐time PCR was performed with SYBR Premix EX Taq using specific primers listed in Supporting Information Table S2. qPCR assays were performed in 96‐well optical reaction plates, using the Applied Biosystem Step‐One Plus (Applied Biosystems, Waltham, USA). qPCR assays were conducted in duplicate wells for each sample. For all experiments, the following qPCR conditions were use: denaturation at 95°C for 30 s, followed by 40 cycles at 95°C for 5 s and then at 60°C for 30 s. The relative expression of transcripts was quantified by normalization to GAPDH in cell lines and PPIB in patient tissues as GAPDH was more stable in cell lines and PPIB was more stable in tissues. 2−△Ct method was used to calculate gene expression in tissues, 2−△△Ct was used to calculate gene expression in cell lines (Schmittgen and Livak, 2008).
Western blot
Tissues were lysed with RIPA lysis buffer (50 mM Tris (pH 7.4), 150 mM NaCl, 1% Triton X‐100, 1% sodium deoxycholate, 0.1% SDS, sodium orthovanadate, sodium fluoride, EDTA, leupeptin; Beyotime, Shanghai, China). The supernatant was separated by centrifugation (14560 x g for 10 min. at 4°C). Protein concentration was determined by BCA protein assay kit (Beyotime). Protein lysates were heated at 100°C for 10 min with loading buffer. Proteins were isolated under following conditions: 90 V, 30 min in 5% stacking gel and then 120 V, 2 h in 10% separating gel. After that, proteins were transferred to PVDF membranes (Millipore, MA). The membranes were blocked using 5% BSA at room temperature for 3 h and then incubated with anti‐SLC28A2 and anti‐GAPDH respectively. The immune complexes were visualized with EZ‐ECL (BI, USA) according to the manufacturer's protocol.
Cell cultures and drug treatment
HCT15 and HT29 cells were gifts from Institute of Modern Chinese Medicine, College of Pharmaceutical Sciences, Zhejiang University. Cell lines were maintained according to instructions from the ATCC. For decitabine (DAC; Sigma‐Aldrich, St. Louis, MO) treatment, HCT15 cells were seeded at 2 × 10⁴ cells cm−2, HT29 cells were seeded at 1.5 × 10⁴ cells cm−2 in 6‐well plates, cells were pre‐cultured to 10–20% confluence and then supplemented with medium containing indicated doses of DAC for 72 h, the medium was replaced every day. For TSA (TCI) treatment, HCT15 cells were seeded at 8.6 × 10⁴ cells cm−2, HT29 cells were seeded at 5.9 × 10⁴ cells cm−2 in 6‐well plates, HCT15 cells were pre‐cultured to 30% confluence and HT29 cells were pre‐cultured to 60% confluence, then cells were supplemented with medium containing indicated doses of TSA for 24 h.
Bisulfite sequencing analysis
This part of experiment was outsourced to Sangon Biotech (Shanghai, China). Genomic DNA from tissues was isolated with QIAamp DNA Mini Kit (Qiagen, Leipzig, Germany) and quantified using NanoDrop 2000. Then, 2 μg DNA was treated with sodium bisulfite for 16 h at 50°C, paroline was added to avoid oxidation as well as evaporation of water. After that, DNA was collected with a UNIQ column. Bisulfite sequencing PCR primers were designed by Sangon Biotech (…China) and listed in Supporting Information Table S2. PCR products were extracted using SanPrep Column PCR Product Purification Kit (Sangon Biotech) according to the manufacturer's instructions. The purified PCR products were cloned into pUC18‐T vector and then transformed into competent cells. The plasmid was extracted with SanPrep Column Endotoxin‐Free Plasmid Mini‐Preps Kit (Sangon Biotech), followed by sequencing. For patients #42, #43 and #44, five clones were sequenced, for patients #15, #18 and #28, 10 clones were sequenced. SeqMan was used to analyse the data.
Uptake experiments
HCT15 cells were seeded at 1 × 10⁵ cells cm−2 in 24‐well plates, HT29 cells were seeded at 7 × 10⁴ cells cm−2 in 24‐well plates. They were separated into two groups, experimental group was treated with medium containing 1 μΜ TSA or 1 μΜ http://www.guidetopharmacology.org/GRAC/LigandDisplayForward?ligandId=7006 for 24 h, reference group was treated with 0.1% DMSO. After 24 h treatment, cells were washed with upB solution (composition in mM: NaCl, 125; KCl, 4.83; MgSO4, 1.27; KH2PO4, 1.18; CaCl2, 1.17; HEPES, 25.2; pH 7.2‐7.4). For the uptake of ribavirin, cells were incubated with upB solution containing 25 μΜ ribavirin for 2 min at 37°C; for the uptake of 2‐CdA, cells were incubated with upB solution containing 40 μΜ 2‐CdA for 30 min at 37°C. Incubation, in both cases, was followed by washing cells with cold PBS, three times immediately. Finally, the cell lysates were collected using 0.1% SDS, the concentration of proteins was detected by BCA protein assay kit, the concentration of ribavirin and 2‐CdA was measured by LC–MS/MS.
Chromatin immunoprecipitation (ChIP)
Tissues and cells were cross‐linked using formaldehyde (Thermo Forma, Waltham, USA) at a final concentration of 1.1%, tissues were incubated for 30 min at room temperature, the incubation time for cells were 15 min. Then, the cross‐linking was quenched with 0.125 M glycine. To shear the chromatin, tissues were treated with 10 U MNase mL−1 (Thermo Scientific (Waltham, USA ) for 10 min at 37°C, followed by sonication for 30 min at 4°C; for cells, the sonication time was 15 min. Sheared chromatin was incubated with 1.5 μg antibody at 4°C overnight, then the mixture was incubated with Protein G beads (Millipore) for 4–6 h at 4°C. Finally, the beads were washed and DNA was collected for subsequent RT‐qPCR (Lee et al., 2006). Primers used in ChIP‐qPCR were listed in Supporting Information Table S2. The enrichment was indicated as % of input.
siRNA‐mediated gene knockdown
siRNA for HDACs and the negative controls were synthesized by GenePharma (Shanghai, China) , and the sequences are shown in Supporting Information Table S4. HCT15 cells were seeded at 3.7 × 10⁴ cells cm−2 in 12‐well plates, HT29 cells were seeded at 5 × 10⁴ cells cm−2 in 12‐well plates, and they were pre‐cultured to 60–80% confluence for transient transfection, Lipofectamine 3000 (Life Technologies (Waltham, USA) was incubated with siRNA for 15 min at room temperature, then 100 μL mixture was added to cell culture medium. For HCT15 cells, the final concentration of siRNA was 40 nM; for HT29 cells, the final concentration of siRNA was 30 nM. After 6 h, the medium was replaced . After 48 h from transient transfection, RNA was extracted from cells for later analysis.
Cell viability assay and drug combination analysis
HCT15 cells were seeded at 5.5 × 10⁴ cells cm−2 and HT29 cells were seeded at 8 × 10⁴ cells cm−2 in 96‐well plates, and both were cultured for 24 h before drug treatment. According to the treatment, cells were divided into three groups: combination group, cells were treated with different concentrations of TSA for 24 h followed by various concentrations of 2‐CdA in the absence of TSA for 24 h; TSA group, 2‐CdA treatment in the later 24 h was replaced with DMSO; 2‐CdA group, TSA treatment in the first 24 h was replaced with DMSO. The dosing schedule was same for combinations of FK228 and 2‐CdA. Cell viability was evaluated by 1‐(4,5‐dimethylthiazol‐2‐yl)‐3,5‐diphenyl‐formazan (MTT) assay. The medium was discarded and cells were washed twice with PBS. Then, 180 μL serum‐free medium and 20 μL 5 mg·mL−1 MTT was added to cells and incubated at 37°C for 4 h in dark. And then, the supernatant was replaced by 200 μL of DMSO, cells were agitated at 37°C for 10 min, the absorbance were detected at 570 and 630 nm. The assay was performed in quadruplicate for each drug concentration.
Data and statistical analysis
The data and statistical analysis in this study comply with the recommendations on experimental design and analysis in pharmacology (Curtis et al., 2018). Results were expressed as mean ± SEM. The Student's t‐test was used for the statistical comparison when there were two experimental groups, ANOVA was used when more than two experimental groups were compared. P < 0.05 was accepted as showing statistical significance.
Materials
The kit used to extract total RNA from tissue was RNA mini‐prep kit (Tiangen, Beijing, China). The kit used to extract total RNA from cell bought from Axygen (Tewkesbury, USA), PrimeScript RT Master Mix (Takara, Japan); SYBR Premix EX Taq (Takara, Japan). Anti‐SLC28A2 (Abcam, Cambridge, UK), Cat# ab123675, RRID:AB_10971362), anti‐GAPDH (Kangchen Cat# KC‐5G4, RRID:AB_2493106), anti‐H3 (Abcam Cat# ab1791, RRID: AB_302613 and Abcam Cat# ab176842, RRID: AB_2493104), anti‐H3Ac (Millipore Cat# 06‐599, RRID:AB_2115283), anti‐H3K4me3 (Abcam Cat# ab8580, RRID:AB_306649), anti‐H3K4me2 (Millipore Cat# 07‐030, RRID:AB_11213050), normal rabbit IgG (Santa Cruz Biotechnology Cat# sc‐2027, RRID:AB_737197), anti‐H3K9Ac (Abcam Cat# ab4441, RRID:AB_2118292), anti‐H3K18Ac (Abcam Cat# ab1191, RRID:AB_298692), anti‐H3K27Ac (Abcam Cat# ab4729, RRID:AB_2118291), anti‐H3K27me3 (Millipore Cat# 07‐449, RRID:AB_310624), anti‐H4Ac (Millipore Cat# 06‐866, RRID:AB_310270). 2‐CdA was supplied by Aladdin (Shanghai, China); FK228 by Hisun (Zhejiang, China) and TSA by TCI (Tokyo, Japan)
Nomenclature of targets and ligands
Key protein targets and ligands in this article are hyperlinked to corresponding entries in http://www.guidetopharmacology.org, the common portal for data from the IUPHAR/BPS Guide to PHARMACOLOGY (Harding et al., 2018), and are permanently archived in the Concise Guide to PHARMACOLOGY 2017/18 (Alexander et al., 2017a,b).
Results
CNT2 is repressed in CRC
Data from Oncomine™ (Compendia Bioscience, Arm Arbor, MI) demonstrated that CNT2 mRNA expression was markedly repressed in CRC tumour tissues (Supporting Information Figure S1). To confirm this result, we analysed CNT2 expression in our CRC samples, using RT‐qPCR. We found that CNT2 mRNA expression was significantly repressed in CRC tumour tissues compared with that in adjacent normal tissues. Our data were consistent with the data from Oncomine (Figure 1A). Some other transporters of interest were also detected with the RT‐qPCR, but their expression levels were not significantly changed in CRC tumour tissues (Supporting Information Figure S2). Results of the Western blot experiments also confirmed this difference between tumour and normal tissues (Figure 1B). Taken together, these results demonstrated that CNT2 expression was repressed at both mRNA and protein levels in CRC, regardless of gender, age, location, TNM stage and cancer subtype (Supporting Information Figure S3).
Figure 1.
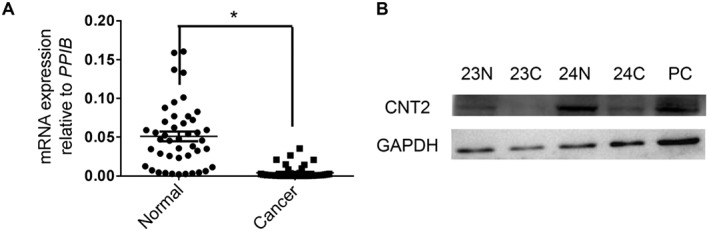
CNT2 is repressed in CRC. (A) RT‐qPCR analysis of CNT2 transcription in matched CRC tissues and adjacent normal tissues normalized to reference gene PPIB . Individual data points are shown, with means and SEM indicated by horizontal lines; n = 44, *P < 0.05, significantly different as indicated; two‐tailed paired t‐test. (B) Western blot of CNT2 and GAPDH in matched CRC tissues (24C, 23C) and adjacent normal tissues from the same individual (23N, 24N). Normal liver tissue was used as the positive control (PC), as recommended.
Histone hypoacetylation represses CNT2 in CRC
Next, we attempted to identify the mechanism underlying CNT2 repression in CRC. Because epigenetics plays key roles in gene expression regulation, we evaluated DNA methylation and histone acetylation levels in the promoter region of CNT2 in CRC samples. Interestingly, we found that H3K9Ac, H3K18Ac and H4Ac levels were decreased in CRC tissues compared with adjacent normal tissues (Figure 2A). H3K9Ac, H3K18Ac and H4Ac are associated with active transcriptional states (Kimura, 2013; Okugawa et al., 2015). However, we failed to detect aberrant DNA methylation in CRC tissues (Supporting Information Figure S4). We also treated cells with DAC, a demethylating reagent that blocks cellular DNA methyltransferases and found the CNT2 expression was not elevated. Moreover, methylation analysis of CNT2 promoter region did not show significant difference between CRC tumour tissues and adjacent normal controls. We therefore concluded that DNA methylation was not the main cause of CNT2 repression in CRC.
Figure 2.
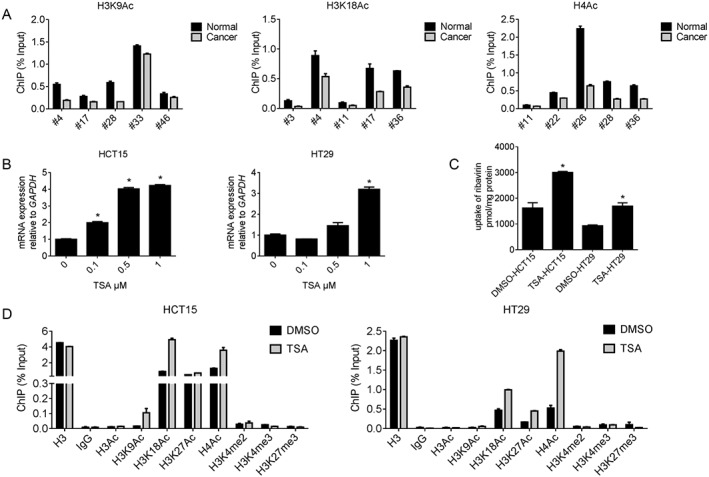
Histone hypoacetylation represses CNT2 in CRC. (A) ChIP‐qPCR analysis of CNT2 promotor region in human CRC tumours compared with paired adjacent normal tissues. Data shown are means ± SEM (n = 5). (B) The expression of CNT2 normalized to GAPDH in HCT15 and HT29 after treated with TSA for 24 h, Data shown are means ± SEM, *P < 0.05, significantly different from control (0 μM TSA); one‐way ANOVA. (C) 1 μΜ TSA facilitated ribavirin uptake by CNT2 in CRC cell lines HCT15 and HT29. Data shown are means ± SEM, *P < 0.05, significantly different from control (DMSO); two‐tailed unpaired t‐test. (D) Treatment with TSA (1 μΜ ) of CRC cell lines HCT15 and HT29 reorganized histone modification profile at CNT2 promotor region.
In CRC cell lines we also found that histone hypoacetylation contributed to CNT2 repression. We treated HCT15 and HT29 cells with TSA and found that CNT2 transcription was activated in both cell lines in a dose‐dependent manner (Figure 2B). Ribavirin, a known substrate of CNT2 (Mori et al., 2010), was used to determine whether the transport function of CNT2 was also up‐regulated. As shown in Figure 2C, up‐regulation of CNT2 by TSA did lead to functional changes. After treatment with TSA, we used ChIP‐qPCR to detect changes in histone acetylation state in the CRC cell lines. We found that the acetylation at H3K9Ac, H3K18Ac and H4Ac increased after TSA treatment (Figure 2D). For all the ChIP‐qPCR analyses mentioned above, we designed three pairs of primers to cover 2000 bp of the promoter region. These primer pairs showed similars patterns of histone modification, which indicated that all parts of the promoter region were likely to be acetylated. The RT‐qPCR results for the other two pairs of primers are shown in Supporting Information Figure S5. Taking these results together, we concluded that histone hypoacetylation repressed CNT2 in CRC.
Up‐regulation of HDAC7 in CRC results in CNT2 repression
TSA inhibits Zn (II)‐dependent class I and class II histone deacetylases, including HDAC1‐10 (Codd et al., 2009; Seto and Yoshida, 2014). Therefore, we investigated which HDAC was the main factor responsible for CNT2 repression in CRC. Among all the HDACs mentioned above, HDAC7 was the only one up‐regulated in CRC tissues compared with adjacent normal tissues (Figure 3A, Supporting Information Figure S6), which indicated that HDAC7 may be the enzyme responsible for CNT2 repression. This possibility was confirmed in the CRC cell lines. In HCT15 and HT29 cells, HDAC7 mRNA level was markedly decreased after treatment with TSA for 24 h (Figure 3B). We then designed two siRNAs for HDAC7. After transient transfection with the siRNA, we found that HDAC7 mRNA level was decreased in HCT15 and HT29 cell lines, whereas CNT2 expression was up‐regulated. We also designed siRNAs for other HDACs and, although the expression of the corresponding HDACs decreased after transfection with the relevant siRNAs, CNT2 expression was not elevated (Supporting Information Figures S7 and S8). These experiments showed that HDAC7 expression was up‐regulated in CRC, which resulted in hypoacetylation at the CNT2 promoter region and subsequent repression of CNT2 in CRC.
Figure 3.
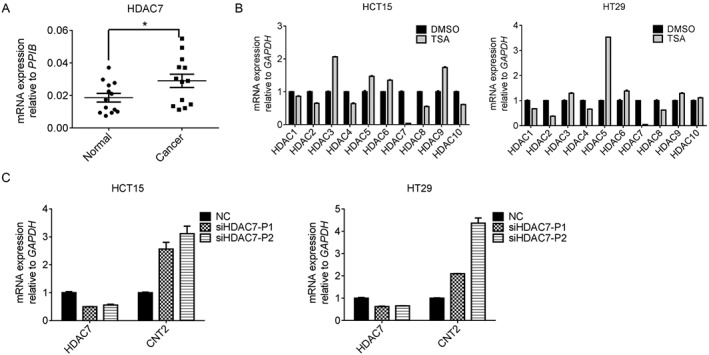
The up‐regulation of HDAC7 in CRC results in CNT2 repression. (A) RT‐qPCR analysis of HDAC7 transcription in matched CRC tissues and adjacent normal tissues normalized to reference gene PPIB. Individual data points are shown, with means and SEM indicated by horizontal lines; n = 13, *P < 0.05, significantly different as indicated; two‐tailed paired t‐test. (B) The expression of HDACs normalized to GAPDH in HCT15 and HT29 cells after treatment with 1 μΜ TSA for 24 h, Data shown are means ± SEM. (C) Knockdown of HDAC7 reactivated CNT2 mRNA expression in HCT15 and HT29 cell lines. Cells were transfected with siRNA of HDAC7 for 48 h before RNA was harvested. NC, cells transfected with negative control siRNA; siHDAC7‐P1, siHDAC7‐P2, two siRNAs for HDAC7. Data shown are means ± SEM; n = 3.
CNT2 activation by HDAC inhibitors sensitizes CRC cell lines to the anti‐cancer drug 2‐CdA
2‐CdA, a substrate of CNT2, is a drug used to treat hairy cell leukaemia, B‐cell chronic lymphocytic leukaemia; and its application in multiple sclerosis is recently being investigated (Juliusson and Samuelsson, 2011; Comi et al., 2013). FK228 is a selective inhibitor of class I and II HDAC enzymes and is approved for the treatment of T‐cell lymphoma (VanderMolen et al., 2011). On the basis of the central role of histone hypoacetylation in CNT2 repression in CRC, we examined whether epigenetic activation of CNT2 by HDAC inhibitors could sensitize CRC cells to 2‐CdA. As shown in Figure 4A and B, pretreatment with TSA and FK228 markedly decreased the IC50 of 2‐CdA in HCT15 and HT29 cells, indicating that the anti‐cancer effect of 2‐CdA was increased. The IC50 of TSA and 2‐CdA combined was 12.95 and 13.73 μΜ in HCT15 and HT29 CRC cell lines respectively. However, when 2‐CdA alone was used, the IC50 was 40.38 μΜ in HCT15 and 35.31 μΜ in HT29. The combination of FK228 and 2‐CdA also gave similar results. To further determine whether the decrease of IC50 was due to enhanced uptake of 2‐CdA, we evaluated cellular accumulation of 2‐CdA in HCT15 and HT29 cell lines. After TSA or FK228 treatment, the uptake of 2‐CdA was increased (Figure 4C, D). On the basis of these results, we concluded that CNT2 up‐regulation, resulting from TSA pretreatment, can enhance the anti‐cancer effect of 2‐CdA in CRC cell lines.
Figure 4.
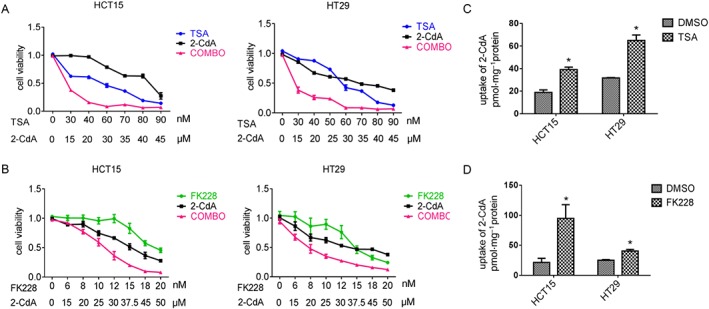
CNT2 activation by HDAC inhibitors sensitizes CRC cells to the effects of the anti‐cancer drug 2‐CdA. (A) Dose‐effect curve of TSA, 2‐CdA and combination (COMBO) therapy in HCT15 and HT29 cells. In the combination group, cells were treated with different concentrations of TSA for 24 h followed by various concentrations of 2‐CdA in the absence of TSA for 24 h. (B) Dose‐effect curve of FK228, 2‐CdA and COMBO therapy in HCT15 and HT29 cells. The treatment of the combination group was same as with TSA. (C) TSA (1 μΜ) facilitated uptake of 2‐CdA in HCT15 and HT29 cell lines. (D) FK228 (1 μΜ) facilitated uptake of 2‐CdA in HCT15 and HT29 cell lines. Data shown are means ± SEM; in A and B, n = 4; in C and D, n = 5. *P < 0.05, significantly different from control (DMSO); two‐tailed unpaired t test.
Discussion
The transporter CNT2 is physiologically important because it plays critical roles in nucleoside homeostasis at the cellular level by mediating influx of extracellular nucleosides into cells (Gray et al., 2004). Activity of CNT2 is also pharmacologically important because it mediates the transport of many clinically relevant drugs. In addition, association between CNT2 and energy metabolism has also been confirmed as CNT2 mediates high‐affinity uptake of http://www.guidetopharmacology.org/GRAC/LigandDisplayForward?ligandId=2844, an important molecule that stimulates glycogenolysis and gluconeogenesis through its interaction with http://www.guidetopharmacology.org/GRAC/ObjectDisplayForward?objectId=20 (Yasuda et al., 2003; Duflot et al., 2004; Huber‐Ruano et al., 2010). Despite all these important functions of CNT2, regulation of CNT2 expression has not been thoroughly elucidated.
To our knowledge, this is the first study of CNT2 repression in CRC using epigenetics. First, we analysed data from the Oncomine Cancer Transcriptome database and found that CNT2 was transcriptionally repressed in most CRC. This result was also confirmed at mRNA level using RT‐qPCR and at protein level using Western blots. Second, we tried to reveal the mechanism underlying this repression, following the example of Okugawa et al. (2015). Both DNA methylation and histone acetylation levels of the CNT2 promoter region were evaluated. The histone acetylation level was reduced, especially at sites H3K9Ac, H3K18Ac and H4Ac. In contrast, DNA methylation did not show any significant change. These results were shown with experiments involving both CRC tissues and CRC cell lines. Therefore, we concluded that histone hypoacetylation was the main cause of CNT2 repression in CRC, and that this repression could be reversed with TSA treatment. In addition, with siRNA knockdown and RT‐qPCR, we found that HDAC7 was the key enzyme responsible for hypoacetylation.
This mechanism may also be clinically important because combining TSA or FK228 with 2‐CdA enhanced the anti‐cancer actions of 2‐CdA. Resistance to 2‐CdA has become a major challenge for its effectiveness and decreased nucleoside transport is one of the main reasons (Lotfi et al., 2003). However, in our experiments, when 2‐CdA was combined with TSA, the cellular uptake of the nucleoside was increased. Moreover, as CNT2 is associated with energy metabolism, the mechanism identified in this study may also be helpful in explaining development of CRC, but this hypothesis needs further investigation.
In summary, our study showed that expression of HDAC7 was increased in CRC, and this leads to histone hypoacetylation at the CNT2 promoter region, especially at sites H3K9Ac, H3K18Ac and H4Ac. Such hypoacetylation condenses the chromatin structure and down‐regulates CNT2 expression. On treatment with TSA, an inhibitor of HDAC, all these effects were reversed. The findings of this study can be applied to investigations of multi‐drug resistance, because reduced CNT2 expression correlated with decreased nucleoside drug uptake, as shown in our drug combination experiment.
Author contributions
C.Y., K.H., J.L., K.Z., S.Z., H.J., L.Y. planned and performed the experiments. C.Y. and K.H. analysed the data. C.Y. and K.H. drafted the manuscript. L.Y. revised the manuscript.
Conflict of interest
The authors declare no conflicts of interest.
Declaration of transparency and scientific rigour
This http://onlinelibrary.wiley.com/doi/10.1111/bph.13405/abstract acknowledges that this paper adheres to the principles for transparent reporting and scientific rigour of preclinical research recommended by funding agencies, publishers and other organisations engaged with supporting research.
Supporting information
Table S1 Tissue specimen information.
Table S2 Primers used in this study.
Table S3 upB formulation (pH 7.2‐pH 7.4).
Table S4 siRNA used in this study.
Figure S1 Summary of CNT2 expressionin various human cancers compared with normal tissues in OncomineTM. Blue: downregulated in cancer; red:upregulated in cancer.
Figure S2 RT‐qPCR analysisof transporters in matched CRC tissues and adjacent normal tissues normalized to reference gene PPIB. Results are expressed as mean ± SEM. Two‐tailed paired t test was used for the analysis. (A) mRNA expression of OCTN1 in CRC (n = 5). (B) mRNA expression of CNT3 in CRC (n = 5). (C) mRNA expression of MRP1 in CRC (n = 5). (D) mRNA expression of MCT1 in CRC (n = 5). (E) mRNA expression of OATP1B1 in CRC (n = 5). (F) mRNA expression of OCT1 in CRC (n = 5). (G) mRNA expression of OATP2B1 in CRC (n = 5). (H) mRNA expression of ENT1in CRC (n = 5). (I) mRNA expression of MDR1 in CRC (n = 5). (J) mRNA expression of MRP2 in CRC (n = 5). (K) mRNA expression of BCRP in CRC (n = 5). (L) mRNA expression of ENT2 in CRC (n = 5). (M) mRNA expression of MATE2Kin CRC (n = 5). (N) mRNA expression of OATP1A2 in CRC (n = 5). (O) mRNA expression of OAT10 in CRC (n = 5). (P) mRNA expression of PEPT1 in CRC (n = 5).
Figure S3 Relationship between CNT2 gene expression changes and gender/age/location/TNM stage/ subtype in matched CRC tissues and adjacent normal tissues (n = 44). Two‐tailed paired t test was used for the analysis.
Figure S4 DNA methylation has no effect on CNT2 expression in CRC. (A) Methylation analysis of CNT2 promotor in human CRC tumors compared with paired adjacent normal tissues. Methylation frequency of each CpG site indicates the proportion of methylated CpG from 5 sequenced clones for patient #42, #43, #44 and 10 sequenced clones for patient #15, #18, #28. X axis represents individual CpG site 1–16. Sample number is shown at the top of each graph. (B) Overall methylation frequency in adjacent normal and cancerous CRC samples from (A), two‐tailed paired t test was used to evaluate the difference in methylation frequency between normal and cancerous samples. (C) The expression of CNT2normalized to GAPDH in HCT15 and HT29 after treated with DAC for 72 h.
Figure S5 Histone hypoacetylation represses CNT2 in CRC. (A) ChIP‐qPCR analysis of H3K9Ac in CNT2 promotor region in human CRC tumors compared with paired adjacent normal tissues, bar plots, mean ± SEM. CH2, CH3 represents different primers that cover different part of CNT2 promotor region. (B) ChIP‐qPCR analysis of H3K18Ac in CNT2 promotor region in human CRC tumors compared with paired adjacent normal tissues, bar plots, mean ± SEM. CH2, CH3 represents different primers that cover different part of CNT2 promotor region. (C) ChIP‐qPCR analysis of H4Ac in CNT2 promotor region in human CRC tumors compared with paired adjacent normal tissues, bar plots, mean ± SEM. CH2, CH3 represents different primers that cover different part of CNT2 promotor region. (D) 1 μΜ TSA treatment in CRC cell line HCT15 reorganized histone modification profile at CNT2 promotor region. (E) 1 μΜ TSA treatment in CRC cell line HT29 reorganized histone modification profile at CNT2 promotor region.
Figure S6 HDACs expressionin matched CRC tissues and adjacent normal tissues (n = 5). Results are expressed as mean ± SEM. Two‐tailed paired t test was used for the analysis.
Figure S7 The expression of CNT2 and HDACs after transfected with various siRNAs in HCT15. NC, cells transfected with negative control siRNA.
Figure S8 The expression of CNT2 and HDACs after transfected with various siRNAs in HT29. NC, cells transfected with negative control siRNA.
Acknowledgements
This research was supported by the National Natural Science Foundation of China (Grant 81703616) and the National Key Research and Development Program of China (Grant 2017YFC0908600).
Ye, C. , Han, K. , Lei, J. , Zeng, K. , Zeng, S. , Ju, H. , and Yu, L. (2018) Inhibition of histone deacetylase 7 reverses concentrative nucleoside transporter 2 repression in colorectal cancer by up‐regulating histone acetylation state. British Journal of Pharmacology, 175: 4209–4217. 10.1111/bph.14467.
Contributor Information
Haixing Ju, Email: juhx@zjcc.org.cn.
Lushan Yu, Email: yuls@zju.edu.cn.
References
- Alexander SPH, Kelly E, Marrion NV, Peters JA, Faccenda E, Harding SD et al (2017a). The Concise Guide to PHARMACOLOGY 2017/18: Transporters. Br J Pharmacol 174: S360–S446. [DOI] [PMC free article] [PubMed] [Google Scholar]
- Alexander SPH, Fabbro D, Kelly E, Marrion NV, Peters JA, Faccenda E et al (2017b). The Concise Guide to PHARMACOLOGY 2017/18: Enzymes. Br J Pharmacol 174: S272–S359. [DOI] [PMC free article] [PubMed] [Google Scholar]
- Baldwin SA, Mackey JR, Cass CE, Young JD (1999). Nucleoside transporters: molecular biology and implications for therapeutic development. Mol Med Today 5: 216–224. [DOI] [PubMed] [Google Scholar]
- Bird A (2002). DNA methylation patterns and epigenetic memory. Genes Dev 16: 6–21. [DOI] [PubMed] [Google Scholar]
- Brenner H, Kloor M, Pox CP (2014). Colorectal cancer. Lancet 383: 1490–1502. [DOI] [PubMed] [Google Scholar]
- Codd R, Braich N, Liu J, Soe CZ, Pakchung AA (2009). Zn (II)‐dependent histone deacetylase inhibitors: suberoylanilide hydroxamic acid and trichostatin A. Int J Biochem Cell Biol 41: 736–739. [DOI] [PubMed] [Google Scholar]
- Comi G, Hartung HP, Kurukulasuriya NC, Greenberg SJ, Scaramozza M (2013). Cladribine tablets for the treatment of relapsing‐remitting multiple sclerosis. Expert Opin Pharmacother 14: 123–136. [DOI] [PubMed] [Google Scholar]
- Curtis MJ, Alexander S, Cirino G, Docherty JR, George CH, Giembycz MA et al (2018). Experimental design and analysis and their reporting II: updated and simplified guidance for authors and peer reviewers. Brit J Pharmacol 175: 987–993. [DOI] [PMC free article] [PubMed] [Google Scholar]
- Duflot S, Riera B, Fernandez‐Veledo S, Casado V, Norman RI, Casado FJ et al (2004). ATP‐sensitive K(+) channels regulate the concentrative adenosine transporter CNT2 following activation by A(1) adenosine receptors. Mol Cell Biol 24: 2710–2719. [DOI] [PMC free article] [PubMed] [Google Scholar]
- Elwi AN, Damaraju VL, Kuzma ML, Baldwin SA, Young JD, Sawyer MB et al (2009). Human concentrative nucleoside transporter 3 is a determinant of fludarabine transportability and cytotoxicity in human renal proximal tubule cell cultures. Cancer Chemother Pharmacol 63: 289–301. [DOI] [PubMed] [Google Scholar]
- Favoriti P, Carbone G, Greco M, Pirozzi F, Pirozzi RE, Corcione F (2016). Worldwide burden of colorectal cancer: a review. Updates Surg 68: 7–11. [DOI] [PubMed] [Google Scholar]
- Gray JH, Owen RP, Giacomini KM (2004). The concentrative nucleoside transporter family, SLC28. Pflugers Arch 447: 728–734. [DOI] [PubMed] [Google Scholar]
- Harding SD, Sharman JL, Faccenda E, Southan C, Pawson AJ, Ireland S et al (2018). The IUPHAR/BPS guide to PHARMACOLOGY in 2018: updates and expansion to encompass the new guide to IMMUNOPHARMACOLOGY. Nucl Acids Res 46: D1091–D1106. [DOI] [PMC free article] [PubMed] [Google Scholar]
- Huber‐Ruano I, Pinilla‐Macua I, Torres G, Casado FJ, Pastor‐Anglada M (2010). Link between high‐affinity adenosine concentrative nucleoside transporter‐2 (CNT2) and energy metabolism in intestinal and liver parenchymal cells. J Cell Physiol 225: 620–630. [DOI] [PubMed] [Google Scholar]
- Juliusson G, Samuelsson H (2011). Hairy cell leukemia: epidemiology, pharmacokinetics of cladribine, and long‐term follow‐up of subcutaneous therapy. Leuk Lymphoma 52 (Suppl. 2): 46–49. [DOI] [PubMed] [Google Scholar]
- Kimura H (2013). Histone modifications for human epigenome analysis. J Hum Genet 58: 439–445. [DOI] [PubMed] [Google Scholar]
- Lee TI, Johnstone SE, Young RA (2006). Chromatin immunoprecipitation and microarray‐based analysis of protein location. Nat Protoc 1: 729–748. [DOI] [PMC free article] [PubMed] [Google Scholar]
- Liu Y, Zheng X, Yu Q, Wang H, Tan F, Zhu Q et al (2016). Epigenetic activation of the drug transporter OCT2 sensitizes renal cell carcinoma to oxaliplatin. Sci Transl Med 8: 348r–397r. [DOI] [PubMed] [Google Scholar]
- Lotfi K, Juliusson G, Albertioni F (2003). Pharmacological basis for cladribine resistance. Leuk Lymphoma 44: 1705–1712. [DOI] [PubMed] [Google Scholar]
- Mackey JR, Mani RS, Selner M, Mowles D, Young JD, Belt JA et al (1998). Functional nucleoside transporters are required for gemcitabine influx and manifestation of toxicity in cancer cell lines. Cancer Res 58: 4349–4357. [PubMed] [Google Scholar]
- Minucci S, Pelicci PG (2006). Histone deacetylase inhibitors and the promise of epigenetic (and more) treatments for cancer. Nat Rev Cancer 6: 38–51. [DOI] [PubMed] [Google Scholar]
- Minuesa G, Purcet S, Erkizia I, Molina‐Arcas M, Bofill M, Izquierdo‐Useros N et al (2008). Expression and functionality of anti‐human immunodeficiency virus and anticancer drug uptake transporters in immune cells. J Pharmacol Exp Ther 324: 558–567. [DOI] [PubMed] [Google Scholar]
- Mori N, Yokooji T, Kamio Y, Murakami T (2010). Study on intestinal absorption sites of mizoribine and ribavirin, substrates for concentrative nucleoside transporter (s), in rats. Eur J Pharmacol 628: 214–219. [DOI] [PubMed] [Google Scholar]
- Okugawa Y, Grady WM, Goel A (2015). Epigenetic alterations in colorectal cancer: emerging biomarkers. Gastroenterology 149: 1204–1225. [DOI] [PMC free article] [PubMed] [Google Scholar]
- Owen RP, Badagnani I, Giacomini KM (2006). Molecular determinants of specificity for synthetic nucleoside analogs in the concentrative nucleoside transporter, CNT2. J Biol Chem 281: 26675–26682. [DOI] [PubMed] [Google Scholar]
- Pastor‐Anglada M, Errasti‐Murugarren E, Aymerich I, Casado FJ (2007). Concentrative nucleoside transporters (CNTs) in epithelia: from absorption to cell signaling. J Physiol Biochem 63: 97–110. [DOI] [PubMed] [Google Scholar]
- Pennycooke M, Chaudary N, Shuralyova I, Zhang Y, Coe IR (2001). Differential expression of human nucleoside transporters in normal and tumor tissue. Biochem Biophys Res Commun 280: 951–959. [DOI] [PubMed] [Google Scholar]
- Schmittgen TD, Livak KJ (2008). Analyzing real‐time PCR data by the comparative C (T) method. Nat Protoc 3: 1101–1108. [DOI] [PubMed] [Google Scholar]
- Seto E, Yoshida M (2014). Erasers of histone acetylation: the histone deacetylase enzymes. Cold Spring Harb Perspect Bio l6: a18713. [DOI] [PMC free article] [PubMed] [Google Scholar]
- VanderMolen KM, McCulloch W, Pearce CJ, Oberlies NH (2011). Romidepsin (Istodax, NSC 630176, FR901228, FK228, depsipeptide): a natural product recently approved for cutaneous T‐cell lymphoma. J Antibiot (Tokyo) 64: 525–531. [DOI] [PMC free article] [PubMed] [Google Scholar]
- Wang J, Su SF, Dresser MJ, Schaner ME, Washington CB, Giacomini KM (1997). Na(+)‐dependent purine nucleoside transporter from human kidney: cloning and functional characterization. Am J Physiol 273: F1058–F1065. [DOI] [PubMed] [Google Scholar]
- Wang Z, Zang C, Cui K, Schones DE, Barski A, Peng W et al (2009). Genome‐wide mapping of HATs and HDACs reveals distinct functions in active and inactive genes. Cell 138: 1019–1031. [DOI] [PMC free article] [PubMed] [Google Scholar]
- Yasuda N, Inoue T, Horizoe T, Nagata K, Minami H, Kawata T et al (2003). Functional characterization of the adenosine receptor contributing to glycogenolysis and gluconeogenesis in rat hepatocytes. Eur J Pharmacol 459: 159–166. [DOI] [PubMed] [Google Scholar]
Associated Data
This section collects any data citations, data availability statements, or supplementary materials included in this article.
Supplementary Materials
Table S1 Tissue specimen information.
Table S2 Primers used in this study.
Table S3 upB formulation (pH 7.2‐pH 7.4).
Table S4 siRNA used in this study.
Figure S1 Summary of CNT2 expressionin various human cancers compared with normal tissues in OncomineTM. Blue: downregulated in cancer; red:upregulated in cancer.
Figure S2 RT‐qPCR analysisof transporters in matched CRC tissues and adjacent normal tissues normalized to reference gene PPIB. Results are expressed as mean ± SEM. Two‐tailed paired t test was used for the analysis. (A) mRNA expression of OCTN1 in CRC (n = 5). (B) mRNA expression of CNT3 in CRC (n = 5). (C) mRNA expression of MRP1 in CRC (n = 5). (D) mRNA expression of MCT1 in CRC (n = 5). (E) mRNA expression of OATP1B1 in CRC (n = 5). (F) mRNA expression of OCT1 in CRC (n = 5). (G) mRNA expression of OATP2B1 in CRC (n = 5). (H) mRNA expression of ENT1in CRC (n = 5). (I) mRNA expression of MDR1 in CRC (n = 5). (J) mRNA expression of MRP2 in CRC (n = 5). (K) mRNA expression of BCRP in CRC (n = 5). (L) mRNA expression of ENT2 in CRC (n = 5). (M) mRNA expression of MATE2Kin CRC (n = 5). (N) mRNA expression of OATP1A2 in CRC (n = 5). (O) mRNA expression of OAT10 in CRC (n = 5). (P) mRNA expression of PEPT1 in CRC (n = 5).
Figure S3 Relationship between CNT2 gene expression changes and gender/age/location/TNM stage/ subtype in matched CRC tissues and adjacent normal tissues (n = 44). Two‐tailed paired t test was used for the analysis.
Figure S4 DNA methylation has no effect on CNT2 expression in CRC. (A) Methylation analysis of CNT2 promotor in human CRC tumors compared with paired adjacent normal tissues. Methylation frequency of each CpG site indicates the proportion of methylated CpG from 5 sequenced clones for patient #42, #43, #44 and 10 sequenced clones for patient #15, #18, #28. X axis represents individual CpG site 1–16. Sample number is shown at the top of each graph. (B) Overall methylation frequency in adjacent normal and cancerous CRC samples from (A), two‐tailed paired t test was used to evaluate the difference in methylation frequency between normal and cancerous samples. (C) The expression of CNT2normalized to GAPDH in HCT15 and HT29 after treated with DAC for 72 h.
Figure S5 Histone hypoacetylation represses CNT2 in CRC. (A) ChIP‐qPCR analysis of H3K9Ac in CNT2 promotor region in human CRC tumors compared with paired adjacent normal tissues, bar plots, mean ± SEM. CH2, CH3 represents different primers that cover different part of CNT2 promotor region. (B) ChIP‐qPCR analysis of H3K18Ac in CNT2 promotor region in human CRC tumors compared with paired adjacent normal tissues, bar plots, mean ± SEM. CH2, CH3 represents different primers that cover different part of CNT2 promotor region. (C) ChIP‐qPCR analysis of H4Ac in CNT2 promotor region in human CRC tumors compared with paired adjacent normal tissues, bar plots, mean ± SEM. CH2, CH3 represents different primers that cover different part of CNT2 promotor region. (D) 1 μΜ TSA treatment in CRC cell line HCT15 reorganized histone modification profile at CNT2 promotor region. (E) 1 μΜ TSA treatment in CRC cell line HT29 reorganized histone modification profile at CNT2 promotor region.
Figure S6 HDACs expressionin matched CRC tissues and adjacent normal tissues (n = 5). Results are expressed as mean ± SEM. Two‐tailed paired t test was used for the analysis.
Figure S7 The expression of CNT2 and HDACs after transfected with various siRNAs in HCT15. NC, cells transfected with negative control siRNA.
Figure S8 The expression of CNT2 and HDACs after transfected with various siRNAs in HT29. NC, cells transfected with negative control siRNA.