Abstract
The ankyrin repeat (AR) structure is a common protein–protein interaction motif and ankyrin repeat proteins comprise a vast family across a large array of different taxa. Natural AR proteins adopt a conserved fold comprised of several repeats with the N‐ and C‐terminal repeats generally being of more divergent sequences. Obtaining experimental crystal structures for natural ankyrin repeat domains (ARD) can be difficult and often requires complexation with a binding partner. Homology modeling is an attractive method for creating a model of AR proteins due to the highly conserved fold; however, modeling the divergent N‐ and C‐terminal “capping” repeats remains a challenge. We show here that amide hydrogen/deuterium exchange mass spectrometry (HDX‐MS), which reports on the presence of secondary structural elements and “foldedness,” can aid in the refinement and selection of AR protein homology models when multiple templates are identified with variations between them localizing to these terminal repeats. We report a homology model for the AR protein IκBε from three different templates and use HDX‐MS to establish the presence of a seventh AR at the C‐terminus identified by only one of the three templates used for modeling.
Keywords: amide exchange, homology model, repeat protein, structure prediction
Introduction
The inhibitor of NFκB (IκB) proteins composes a family of ankyrin‐repeat containing proteins which function to inhibit NFκB signaling via interaction with the NFκB transcription factor leading to cytoplasmic sequestration in unstimulated, resting cells.1 Upon cellular stress, IKK phosphorylates the NFκB‐bound IκB protein leading to ubiquitylation and proteasomal degradation of the IκB protein, releasing NFκB and unmasking its nuclear localization sequence and allowing its translocation into the nucleus where it binds κB sites and upregulates gene expression.2 The IκB protein family is composed of four main members, IκBα, IκBβ, IκBε, and Bcl‐3 which all contain a disordered N‐terminus, a central ankyrin repeat domain (ARD) followed by a disordered C‐terminus.3 Crystal structures for IκBα in complex with NFκB (p50/RelA, PDB: 1IKN and 1NFI), IκBβ in complex with NFκB (RelA homodimer, PDB: 1K3Z), and free Bcl‐3 (PDB: 1K1B) are known.4, 5, 6, 7 However, the most recently discovered member of the IκB protein family, IκBε, has no crystal structure and further there has been virtually no biochemical or biophysical characterization since its discovery in 1997.8, 9, 10 As two of the three members of the IκB protein family (IκBα and IκBβ) were exceedingly difficult to crystalize, and indeed only did so in complex with their NFκB binding partners, obtaining a crystal structure of these proteins is not an easy undertaking. We, therefore, performed homology modeling,11 which is a powerful method for determining likely structures for proteins which may be difficult (or impossible) to crystalize or obtain in high enough quantities for NMR structure determination. However, as multiple templates can be identified for a single protein of interest and these different templates may provide structures with only small local differences, selecting the most appropriate model remains a fundamental problem for this technique. In the case of ankyrin repeat proteins, challenges arise in defining the “ends” of the ankyrin repeat domain because the end repeats often have lower sequence similarity than the middle repeats.12, 13 To ascertain the true “ends” of the ARD, we turned to hydrogen–deuterium exchange mass spectrometry (HDX‐MS) to aid in model selection. HDX‐MS is highly sensitive to the presence or absence of stable structural elements. The level of deuterium uptake for a particular peptide in a protein is dependent on solvent accessibility and/or participation in intramolecular hydrogen bonding, both of which report on the level of disorder or the presence of secondary structural elements.14 Using HDX‐MS in conjunction with homology modeling where multiple templates have been identified is a broadly applicable technique in that HDX‐MS experiments provide definitive results on the structural characteristics of a particular protein. Therefore, comparing the HDX‐MS data from analogous regions of the template and protein of interest in homology modeling will aid in determining the accuracy of a local structural element which is distinct in different templates and, therefore, aid in selecting a homology model which most faithfully captures the solution structure of a protein of interest. Taking advantage of the well‐conserved fold and the well‐established relationship between the consensus sequence and structure, we used an AR protein as a proof of principle for this approach. We report here that the combination of homology modeling and HDX‐MS reveals that IκBε, unlike its functional neighbors, IκBβ and IκBα, appears to contain a seventh ankyrin repeat.
Results
Analysis of IκBε sequence compared to other IκB proteins with known structures
The IκB protein family is characterized by a central ankyrin repeat domain (ARD) flanked by disordered N‐ and C‐termini. It has been demonstrated in the ARD of the Notch receptor that ankyrin repeats within the same protein have low sequence identity; however, analogous repeats from different taxa display much higher identity.15 Indeed, when analyzing the sequence conservation between ARs within IκBε, the level of identity is low, on average about 19% [Fig. 1(A)]; however, when comparing analogous repeats among the IκB protein family, the sequence conservation is strikingly high, averaging 50% [Fig. 1(B)].
Figure 1.
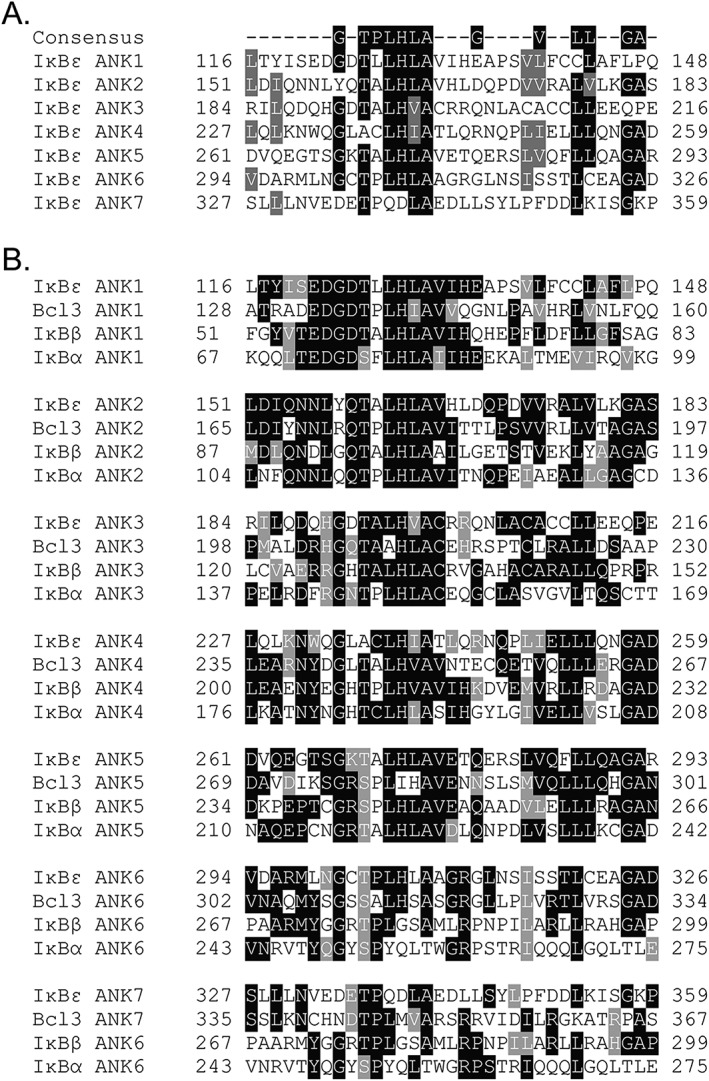
Intra‐IκBε ANK sequence conservation is low when compared with other IκB protein family members and suggests the presence of a seventh ankyrin repeat. ARs have a well‐defined consensus sequence noted at the top of each alignment. (A) Aligning each of the ARs within IκBε displays a low level of sequence identity (~19%). (B) Alignment of each IκBε AR with analogous repeats in each IκB family member (IκBα, IκBβ, and Bcl‐3) demonstrates a high level of sequence homology (~50%). The putative seventh AR of IκBε was aligned with the known seventh AR of Bcl‐3 and the terminal sixth ARs of IκBα and IκBβ, all of which deviate most significantly from the consensus sequence as is common for terminal repeats in AR‐containing proteins.43
The full M. musculus IκBε protein sequence was analyzed using the NIH Blast algorithm. Beyond the high sequence homology in the ARD of IκBε to those of the other IκB family members, the full IκBε protein sequence displayed high levels of conservation to the other family members. The Blast algorithm identified IκBβ and IκBα as proteins containing significant sequence homology to IκBε at 37% each; however, the IκB family member with the highest level of sequence conservation at 41% is proto‐oncogene Bcl‐3. Previous reports which provided only a cursory analysis of the IκBε protein sequence stated IκBε contains six ankyrin repeats as in IκBα and IκBβ.8, 9, 10 However, alignment of a putative seventh ankyrin repeat with the analogous seventh ankyrin repeat in Bcl‐3 strongly suggested that IκBε contains not six but seven ankyrin repeats [Fig. 1(B), see ANK7].
To ascertain whether IκBε has intrinsically disordered regions, we analyzed the M. musculus IκBε sequence with the PONDR‐FIT algorithm, a meta‐predictor of intrinsically disordered amino acids.16 The IκBε protein sequence is predicted to have a 120 amino acid disordered N‐terminus, a well‐folded central region, and a 20 amino acid disordered C‐terminus (Fig. 2, green). When compared with the PONDR‐FIT analyses of the other IκB family members whose structures are known, IκBε appears to follow the same pattern of disordered termini and a central region of ordered structure (Fig. 2). In addition, the central region of IκBε has higher similarity with the ankyrin repeat consensus as do the sequences of other IκB family members, supporting the prediction that IκBε has an ordered central ARD flanked by disordered N‐ and C‐termini like the other IκB family members. Like IκBβ, IκBε also apparently has a less ordered segment between AR3 and AR4 (seen as a spike in the middle of the IκBε PONDR plot in Fig. 2), but the IκBβ segment is 36 amino acids in length whereas the IκBε segment is only 11 amino acids in length.
Figure 2.
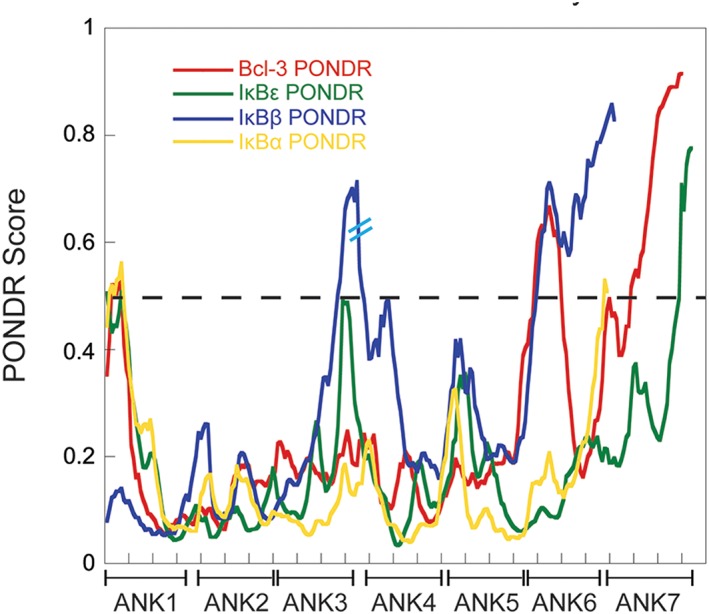
PONDR analysis of IκB family members indicates a shared structural architecture. The Predictor Of Naturally Disordered Regions (PONDR) algorithm predicts regions of disorder by analyzing fractional composition of particular amino acids, hydropathy, or sequence complexity.44, 45 A PONDR score above 0.5 is indicative of predicted disorder whereas a score below 0.5 suggests a more ordered region. The PONDR scores for the AR domain of each IκB family member is plotted above and each AR is noted on the x‐axis; the dashed line identifies the 0.5 score cutoff for predicted disorder. Red: Bcl‐3, Green: IκBε, Yellow: IκBα, and Blue: IκBβ. The IκBβ sequence contains a 36 amino acid long linker between ARs 3 and 4 and that break in sequence is noted by two cyan hashes on the IκBβ PONDR trace. In the AR domain of each family member, the central repeats are more ordered than those at the N‐ and C‐termini.
Homology modeling of IκBε
The SWISS‐MODEL template library (SMTL version 2017‐12‐13, PDB release 2017‐12‐08) was searched with BLAST and HHBlits for evolutionarily related structures matching the target sequence.17, 18 While the BLAST and HHBlits algorithms identified numerous other ankyrin repeat containing proteins with high homology to IκBε, those with similar length and highest sequence similarity were IκBα, IκBβ, and Bcl‐3 and these were, therefore, used as templates in this study. ProMod3 Version 1.1.0 was used in the automated SWISS‐MODEL portal to build homology models of IκBε from the IκBα, IκBβ, and Bcl‐3 crystal structures.19 The IκBα structure (PDB 1IKN) was solved to 2.3 Å in complex with NFκB p50/RelA heterodimer4 [Fig. 3(C)]; IκBβ (PDB 1K3Z) was solved to 2.5 Å in complex with NFκB RelA homodimer 7 [Fig. 3(B)]; Bcl‐3 was the only IκB family member which was able to be solved in its free state (PDB 1K1B) and was solved to 1.9 Å 6 [Fig. 3(A)]. Bcl‐3 was identified as having the highest level of sequence homology to IκBε at 41.6% within the putative ankyrin repeat domain of IκBε (Residues 121–352). Based on the Bcl‐3 crystal structure, IκBε was modeled to have seven ankyrin repeats within Residues 121–352 and a slightly longer disordered loop (Residues 213–237) connecting ARs 3 and 4 [Fig. 3(A)]. IκBβ had the second highest sequence homology with IκBε at 39.5%; however, due to the fact that IκBβ only contains six ankyrin repeats, it did not recognize and model the final, seventh putative ankyrin repeat in IκBε (Residues 327–359). It modeled an ankyrin repeat domain with six ARs for IκBε Residues 117–336 [Fig. 3(B)]. Finally, the model generated from IκBα (sequence homology 37.8%) also identified only six ankyrin repeats (IκBε Residues 122–341); however, analysis of the quality of this model suggests that it is not of high value to the accurate predicted structure of IκBε [Fig. 3(C)]. Qualitative analysis of the appearance of these models shows certain similarities: (1) the N‐terminus of IκBε (Residues 1–120) is predicted to be disordered in agreement with the PONDR analysis in Figure 2, (2) each model predicts a longer than normal linker loop between ankyrin Repeats 3 and 4 similar to IκBβ’s 36 amino acid long linker in the same region, (3) and each structure suggests a disordered C‐terminus with the length being similar for the IκBα and IκBβ template models and shorter for the Bcl‐3 template structure which contained a seventh ankyrin repeat.
Figure 3.
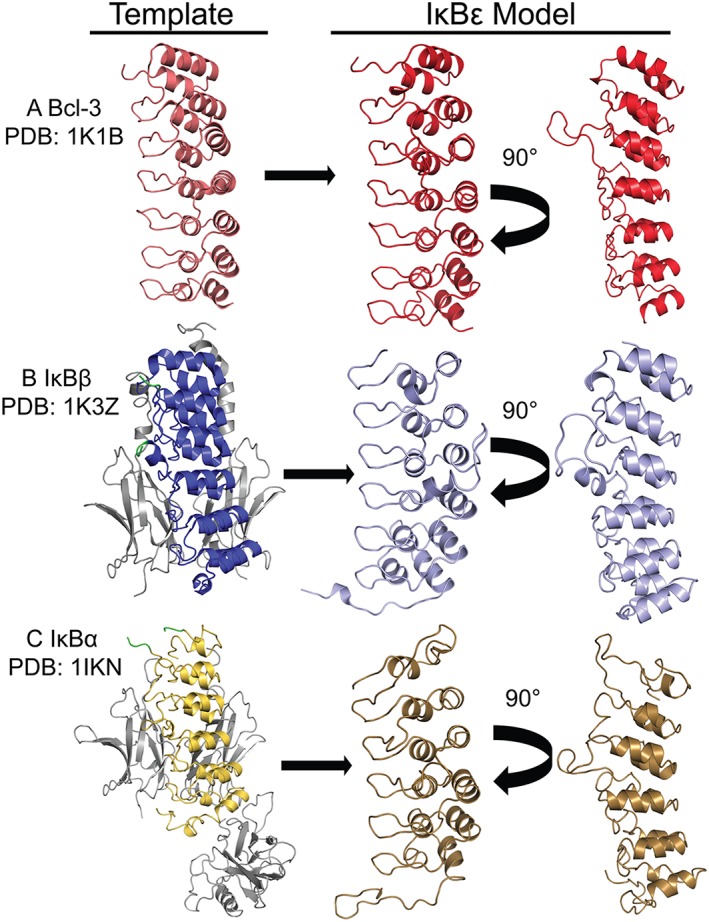
SWISS model identified IκB family members as templates for homology modeling of IκBε. Using sequence alignment, the other three IκB family members were identified as having the highest homology and most similar sequence length to IκBε and were used as templates for generating homology models of IκBε. (A) The Bcl‐3 crystal structure (PDB: 1K1B, left, light red)6 was used to model Residues 121–352 of IκBε in SWISS MODEL as containing seven ARs and a longer than normal linker between ARs 3 and 4 (right, bright red). (B) The structure of IκBβ (PDB: 1K3Z) is shown on the left in dark blue in complex with the NFκB RelA homodimer (in grey); this structure contains a long, disordered linker between ARs 3 and 4 (Residues 156–192) which did not provide sufficient electron density to assign its structure, this break in the structure is shown in green.7 This template modeled Residues 117–336 of IκBε as six ARs with a longer linker between ARs 3 and 4, and an unstructured C‐terminus (right, light blue). (C) The crystal structure of IκBα (PDB: 1IKN, left, yellow) bound to the NFκB heterodimer RelA/p50 (in grey); this structure also contains a region of insufficient electron density to be solved and creates a break in the structure of IκBα between Residues 96 and 100 just C‐terminal of the first AR.4 This template modeled Residues 122–341 of IκBε as containing six ARs the first of which is weakly folded (right, sand).
The SWISS‐MODEL service provides a Global Model Quality Estimate (GMQE) which combines properties from target‐template alignment and the template search method to provide a global quality score for the model.20 GMQE score ranges from 0 to 1 with a higher score indicating the model aligns globally in a more similar manner to the template used in the modeling. The GMQE score of IκBα was 0.39, slightly lower than the scores for the models generated from Bcl‐3 and IκBβ, which were 0.44 and 0.46, respectively (Fig. 4). The models were also evaluated using the QMEAN4 Z‐score, which represents a linear combination of the four structural descriptive Z‐scores “All Atom,” “CBeta,” “Solvation,” and “Torsion.”21, 22 The QMEAN4 score of the IκBε model based on the IκBα template was −5.71, less than the generally‐accepted lower limit of −4.0 for a quality model, indicating again that this model most likely does not reflect the true structure of IκBε. The models using Bcl‐3 and IκBβ as templates showed good QMEAN4 scores of −0.83 and −1.91, respectively, suggesting that these models are of high quality, but again showing that the IκBε model based on the Bcl‐3 template is likely the best model (Fig. 4). Finally, we calculated the local QMEAN score for each amino acid in the sequence as an estimate of the expected structural inaccuracy at each position.22, 23 Again, the IκBε model based on the IκBα template showed very poor scores across the entire modeled region while the models based on the IκBβ and Bcl‐3 templates had similar traces of local quality scores. Here, only the IκBε model based on the Bcl‐3 template had scores above 0.6, an indicator of high structural quality, for the C‐terminus of the model, whereas the IκBε model based on the IκBβ template appeared to model the longer linker between ARs 3 and 4 marginally more faithfully (Fig. 5). Based on these analyses of the quality of the IκBε models, the model based on the IκBα template was eliminated. Thus, the IκBε model based on the IκBβ structure was of slightly higher quality in the disordered segment between AR3 and AR4, but the model based on the Bcl‐3 structure had a seventh AR. To resolve these discrepancies, we turned to amide HDX‐MS.
Figure 4.
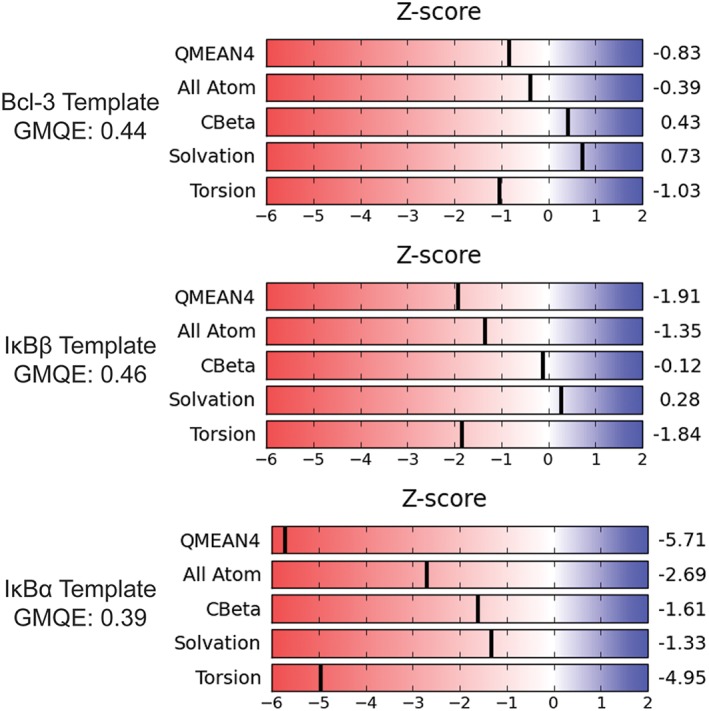
Global Quality Analysis of IκBε homology models suggests Bcl‐3 and IκBβ templates generate the most accurate structures. The SWISS model platform generates a Global Model Quality Estimate (GMQE) score which combines properties from the target‐template alignment and the template search method and is expressed as a number between 0 and 1 with higher scores indicating higher quality. The GMQE score for each model is shown above. The platform also generates specific Z‐scores for four structural descriptors: All Atom, CBeta, Solvation, and Torsion. The QMEAN4 scoring function is a linear combination using statistical potentials of these four components. The Z‐scores shown to the right relate the quality of the structural descriptors to those of high‐resolution X‐ray structures of similar size. The QMEAN4 Z‐score provides a “degree of nativeness” of each model. (A) Scores for the Bcl‐3 template model. (B) Scores for the IκBβ template model. (C) Scores for the IκBα template model. Although the IκBβ template model has a GMQE score marginally higher than that of the Bcl‐3 template model, the Bcl‐3 template model outperforms it in individual Z‐scores shown to the right. This global quality analysis eliminates the IκBα template model as the QMEAN4 lower limit for a quality model is −4.0 and the IκBα template model was scored as −5.71.
Figure 5.
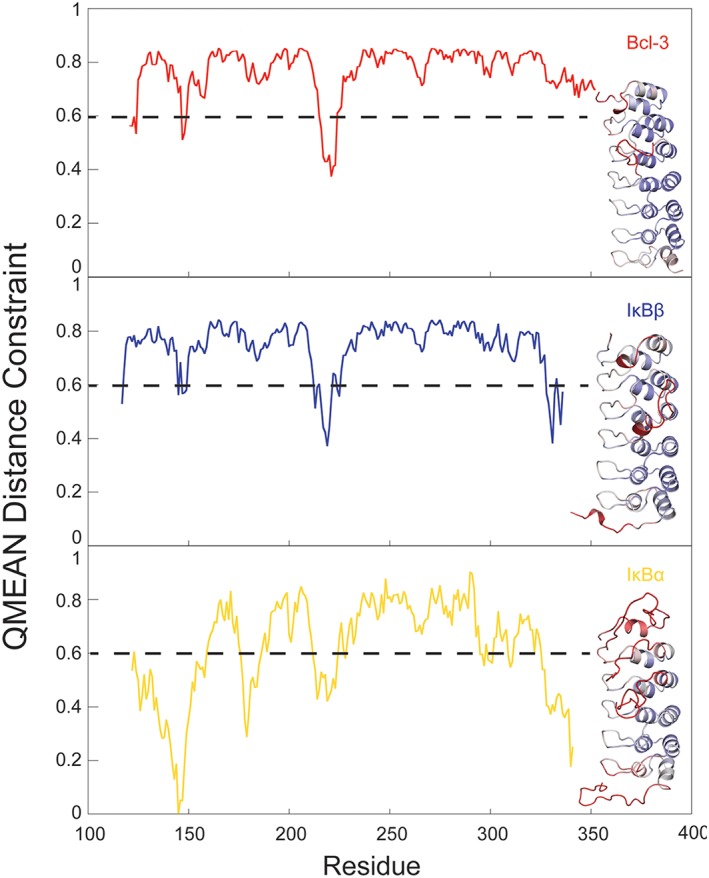
Local quality scores generated for each model indicate that the Bcl‐3 template most faithfully modeled the C‐terminus of IκBε. Local quality analysis provided by the SWISS Model platform provides a method of assessing the quality of a model at each residue within it. The QMEAN Distance Constraint score combines the QMEAN with the distance constraint score which predicts the correctness of pairwise residue distances in the model by comparing it to distance constraints obtained from distances between residue pairs in homologous templates. This combined score is expressed as a range from 0 to 1; a QMEAN Distance Constraint score of 0.6 or above is generally accepted as indicating a residue is modeled acceptably. Each panel depicts the QMEAN Distance Constraint score across the residues of IκBε modeled by each template. Inset in each panel is the structure of each model colored as a heat map of these QMEAN Distance Constraint scores from 0.5 (red, low quality) to 1 (blue, high quality). Upper panel: Bcl‐3 template model. Middle panel: IκBβ template model. Bottom panel: IκBα template model. This local analysis recapitulates the poor performance of the IκBα template model as indicated by global quality analysis and suggests that the Bcl‐3 template models the C‐terminus most accurately as it is the only model whose C‐terminus remains above the 0.6 cutoff score.
Measurement of deuterium uptake by HDX‐MS
In an attempt to correlate computationally predicted structural elements with concrete experimental observations, HDX‐MS experiments were performed on Bcl‐3, IκBα, and IκBβ whose structures are known. To ascertain whether HDX‐MS was a reliable correlate to predicted disorder, the trend in deuterium uptake was compared with the PONDR analysis scores for the same region of each protein. Deuterium uptake in HDX‐MS is reported for peptides generated from a pepsin digest following deuterium exchange reactions and plotted as a function of time. The level of deuterium uptake for each peptide is directly dependent on its solvent accessibility and/or participation in intramolecular hydrogen bonds, both of which can be related to the level of either disorder or well‐defined secondary structural elements in those regions.14 Since fractional deuterium uptake is reported for an entire peptide, the PONDR scores for IκBα, IκBβ, Bcl‐3, and IκBε were averaged over the residues for each peptide analyzed in the HDX‐MS experiments. The trends of deuterium uptake for all proteins investigated track qualitatively with the predictions of order and disorder using PONDR (Fig. 6). The main areas of deviation occur at the C‐termini of IκBα and IκBε.
Figure 6.
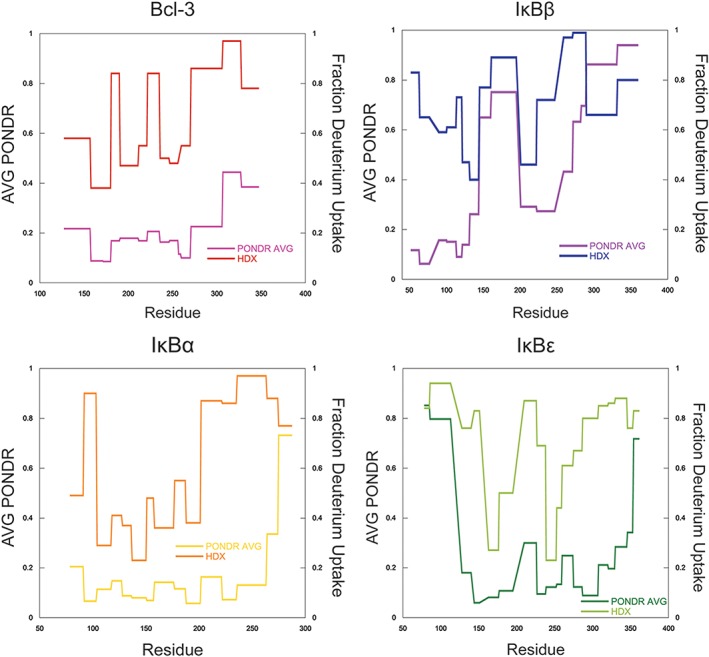
PONDR scores track qualitatively with deuterium uptake as monitored by HDX‐MS. To determine whether HDX‐MS deuterium uptake data correlates with results from computationally generated predictors of order/disorder, the PONDR score was averaged over each peptide generated from HDX‐MS experiments and both the fractional deuterium uptake and average PONDR score were plotted as a function of amino acid. Although no quantitative correlation was obtained, PONDR predictions qualitatively track with HDX‐MS.
Previous studies have correlated the solvent accessible surface area (SASA) of a peptide generated from HDX‐MS to the number of deuterons incorporated by that peptide.24 We hypothesized that determining the correlation coefficient between the SASA of each predicted models with the HDX‐MS data on IκBε may reveal which model best represented the solution structure of IκBε. First, we determined the correlation coefficients between the SASA calculated from actual crystal structures of Bcl‐3 (PDB: 1K1B), and IκBα bound to NFκB (PDB: 1NFI and 1IKN) and the corresponding HDX‐MS data. The correlation coefficients were 0.79, 0.86, and 0.73, respectively (Fig. S1). For each homology model of IκBε, the backbone SASA for each residue was calculated and the values were summed over each peptide. The correlation coefficients between the SASA of each model and the HDX‐MS data from IκBε were then determined (Fig. 7). The Bcl‐3 template model gave a correlation coefficient of 0.71 while the IκBβ template gave a correlation coefficient of 0.81. Both of these correlation coefficients were within the range of those determined for Bcl‐3 and IκBα; however, the Bcl‐3 template model extends an additional 16 amino acids (ends at Residue 352) further than that of the IκBβ template (ends at Residue 336) allowing the inclusion of five more peptides from the HDX‐MS analysis.
Figure 7.
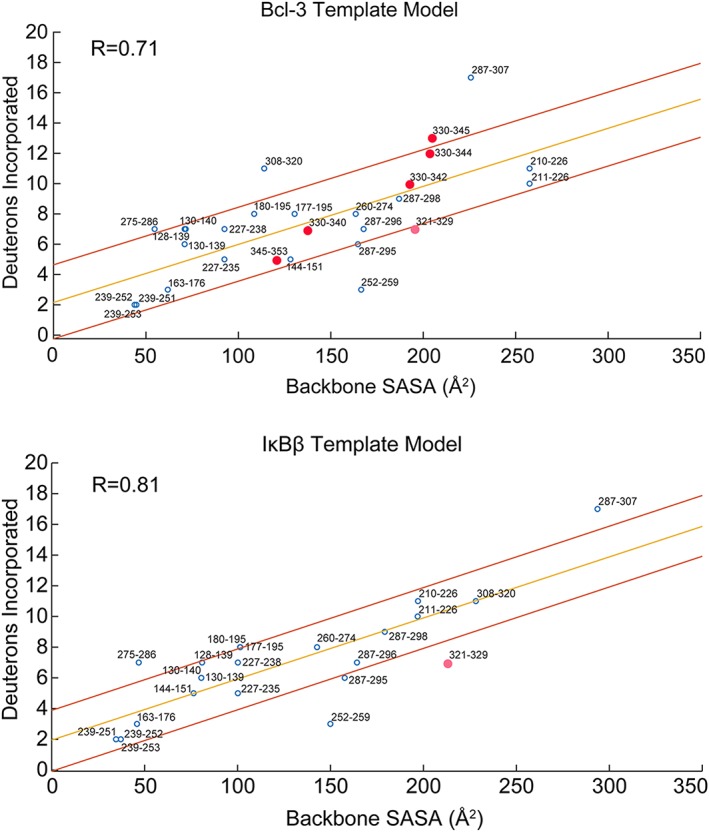
Backbone solvent accessible surface area (SASA) correlates strongly with deuterium uptake from HDX‐MS. The GetArea server was used to calculate the backbone SASA for each residue in the homology models from the Bcl‐3 and IκBβ templates. These backbone SASA values were summed over each IκBε peptide generated from HDX‐MS and the deuterium uptake for each peptide is plotted as a function of backbone SASA. The upper panel shows the correlation for the Bcl‐3 template model whose correlation coefficient (R) is 0.71 and the lower panel is for the IκBβ template model whose R‐value is 0.81. Both plots show the correlation line from regression analysis in yellow with lines above and below in red indicating the region within one standard deviation of the regression line. For both models, the majority of HDX‐MS peptides fall within one standard deviation of the correlation line. The pink circle on both plots indicates the only peptide for the IκBβ template model containing part of the putative AR 7 of IκBε (Peptide 321–329, putative AR 7 begins at Residue 327), the backbone SASA for this peptide is overestimated from the IκBβ model based on the deuterium uptake. This peptide is better modeled by the Bcl‐3 template. Peptides spanning the putative AR 7 of IκBε (red data points) in the Bcl‐3 template plot all correlate very well for the Bcl‐3 template model, strongly suggesting the presence of a weakly folded AR 7 in the structure of IκBε.
For both the Bcl‐3 and IκBβ template models, the majority of the HDX‐MS peptides fall within one standard deviation of the regression line. Most importantly, however, is that the peptides for the putative seventh AR modeled by the Bcl‐3 template fall well within this region with the exception of 330–345 which lies just outside the upper limit. The only peptide from the IκBβ template model which contains part of the putative IκBε AR7 is Residues 321–329, which has significantly lower deuterium uptake than the SASA predicted for the model. The IκBβ template model ends at Residue 336 and the putative AR7 begins at Residue 327. Thus, the IκBβ template models this region with less structure than indicated by the level of deuterium uptake observed in the HDX‐MS experiments. The good correlation of backbone SASA generated from the Bcl‐3 template for AR7 peptides (shown as red circles in Fig. 7) provides compelling evidence of the presence of AR7 in the structure of IκBε.
Combining PONDR analysis and HDX‐MS of analogous regions in Bcl‐3, IκBβ, and IκBε suggests the presence of a weakly folded seventh ankyrin repeat in IκBε
The sequence alignments presented in Figure 1(B) strongly suggest the presence of a seventh ankyrin repeat in IκBε. However, only the Bcl‐3 template generated a model which placed a seventh ankyrin repeat at the C‐terminus of IκBε. As noted, the global assessments of both the Bcl‐3 template and IκBβ template models were of similar quality (Fig. 4), although the local analysis suggested the Bcl‐3 template model is of higher quality than that of the IκBβ template model in this contested seventh ankyrin repeat. Comparing the PONDR plots of the Bcl‐3 ANK7, the region C‐terminal of IκBβ’s ANK6, the putative ANK7 of IκBε, and the known IκBβ ANK6, it is apparent that only the putative ANK7 of IκBε is predicted to be ordered by PONDR (Fig. 8).
Figure 8.
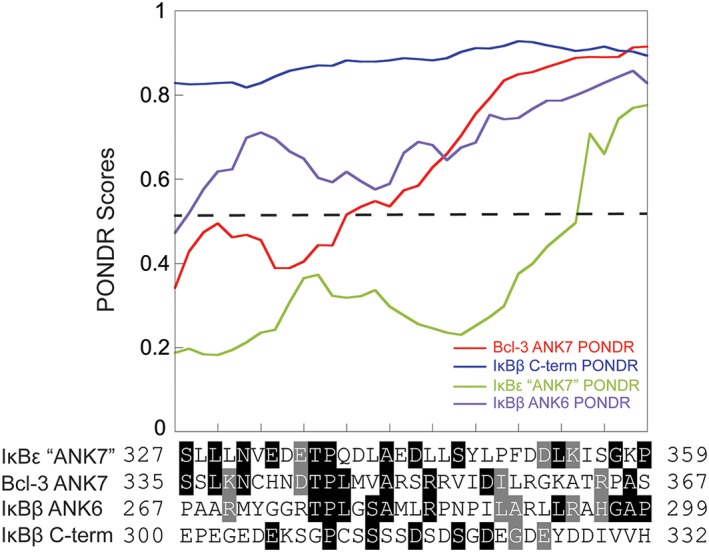
PONDR analysis of the putative AR 7 of IκBε. The PONDR scores for the putative AR 7 of IκBε (green) were plotted along with the PONDR scores for the Bcl‐3 AR 7 (red), IκBβ AR 6 (purple), and IκBβ C‐terminus (blue). The dashed line indicates the 0.5 cutoff for an ordered region. This analysis shows that PONDR predicts only IκBε to be fully ordered in this putative AR 7, even more so than the known Bcl‐3 AR 7 and the IκBβ AR 6.
The HDX‐MS data from the C‐terminus of IκBε can provide insight into the level of order/disorder present in this region. Figure 9 shows the deuterium uptake plots for the seventh ankyrin repeat of IκBε and are enclosed in boxes colored to correspond to the region of the homology model they represent. The Bcl‐3 template modeled more of the C‐terminus of IκBε than the IκBβ template, therefore the plots circled in gold (a), the inter‐ankyrin repeat loop and cyan (b), the ankyrin repeat helix are peptides only represented in the Bcl‐3 template model. The lower level of deuterium uptake in (b) compared with (a) is indicative of a higher level of the order being present in the C‐terminal peptide 346–353 (b). Taken together, the data strongly suggest that IκBε contains a seventh ankyrin repeat as in Bcl‐3.
Figure 9.
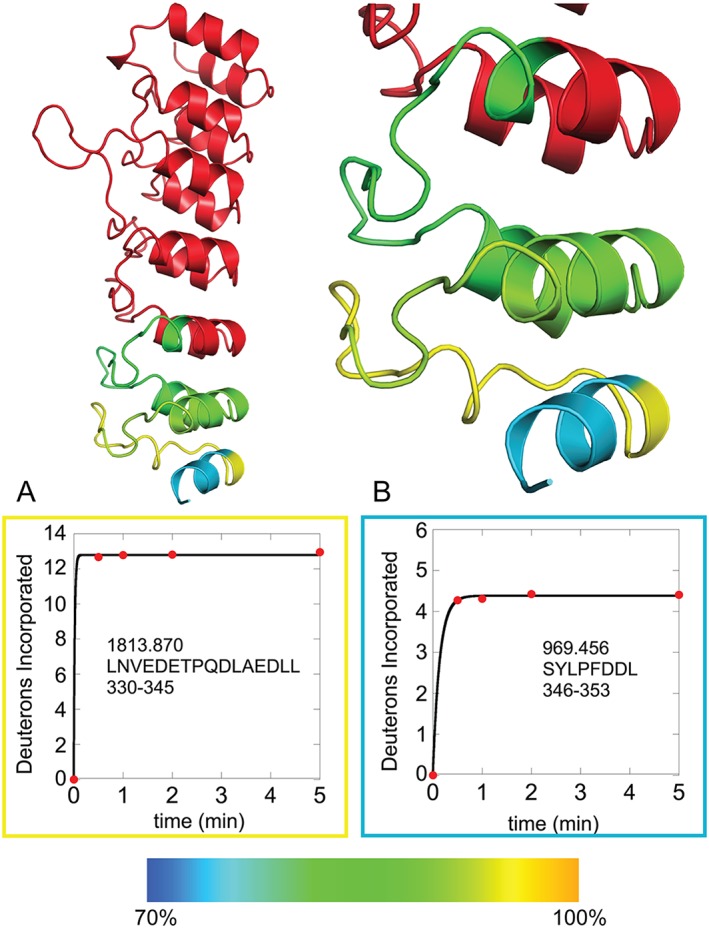
HDXMS of regions in the putative AR 7 of IκBε supports the presence of this AR. The Bcl‐3 template model is shown (left) and zoomed in to the putative AR 7 (right) with AR 6 and the putative AR 7 colored according to a rainbow scale of blue to yellow for 70–100% maximum possible deuterium uptake. The two HDXMS plots (A, B) are enclosed in boxes of the same color as the region on the model to which they correspond. The decrease in deuterium uptake in plot B as compared with plot A indicates that the region represented by Residues 346–353 is more structured than Residues 330–345, consistent with the presence of the putative AR 7.
Discussion
The ability to utilize experimental techniques to distinguish between the accuracy of different computationally derived homology models is an important step in developing a model which faithfully captures the known structural and functional observations of a protein of interest. Here, we present a case study on using HDX‐MS to fill this gap in distinguishing between homology models of IκBε generated from the templates of other IκB protein family members and provide a general framework for applying this analysis to any protein of interest.
The sequence homology of each of IκBε’s ARs with the analogous repeats of each template was high, making it difficult to decide which template would be the best to use for homology modeling. One template, which had seven ARs predicted a seventh AR in IκBε, but that would be unusual because the other IκB family members only have six. In modeling AR proteins, the end repeats (capping repeats) have been identified as the most difficult to resolve. This is due to the necessity of these capping repeats to contain hydrophobic amino acids facing the core of the protein and hydrophilic amino acids facing the solvent to terminate the AR fold.25, 26 The putative AR7 of IκBε does, indeed, have characteristics of a capping AR: The conserved Thr‐Pro at Positions 336–337 in AR7 are conserved, and the Thr has been shown to form a hydrogen‐bond with the backbone of the preceding repeat. Leu and Ala at Positions 340–341 are also conserved and form the first helix of the AR. The Gly at Position 357 has been shown to be a key residue to break the second helix of the AR fold and initiate the AR‐connecting loops. In fact, the Bcl‐3 template model predicted the first helix would terminate at Asp 352, which aligns with the position of this second helix terminating Gly in Bcl‐3 [Fig. 1(B), see ANK7]. The presence of this Gly highly suggests that it is terminating a capping AR and beginning the disordered C‐terminal tail of IκBε. This conclusion is supported by the PONDR analysis (Fig. 2) where IκBε appears ordered through Residue 360 and rises steeply after. Finally, the large amount of charged or hydrophilic amino acids in the putative AR7 (17 of 33) is also a signature of a capping AR. Thus, the primary sequence of the putative AR7 of IκBε is most consistent with a capping AR, for which sequence similarity is weaker and much more challenging to align.26
The global scoring analysis from SWISS‐MODEL indicated that both IκBβ and Bcl‐3 templates gave similar quality models but the Bcl‐3 template modeled a seventh ankyrin repeat with an acceptable local quality score. Based on results from IκBα,27 we expected the capping repeat to be weakly folded. Experimental validation of weak folding is best obtained by HDX‐MS, which is highly sensitive to subtle differences in the level of “foldedness” for a particular region.28
The sequence between AR3 and AR4 of IκBε is longer than expected, resembling the linker between AR3 and AR4 in IκBβ. This segment of IκBβ is known to be disordered and no significant electron density for this region was observed in the crystal structure.7 The two different homology models (based on IκBβ and Bcl‐3) predicted slightly different degrees of structure in the disordered segment between AR3 and AR4. To determine whether one or the other was correct, we attempted to quantitatively compare the experimentally measured deuterium uptake with the solvent accessibility calculated from each homology model as previously described.24 The SASA of the disordered segment in the IκBβ template model slightly underestimated the deuterium uptake whereas the SASA of the Bcl‐3 template model slightly over‐estimated it. Therefore, all that can be concluded is that this region is longer than a prototypical AR linker and is disordered.
Although the SASA comparison provided inconclusive results for the disordered segment, quantitative comparison of the SASA calculated from the Bcl‐3 template model to the experimentally measured deuterium incorporation provided the most compelling evidence of the existence of the putative seventh AR. In conclusion, the combination of homology modeling from several templates with HDX‐MS validation based on quantitative comparison of predicted versus measured SASA provides a general framework for determining the most accurate homology model.
Now that a seventh AR has been identified in IκBε, it is possible to speculate about its function. IκBα has been shown to accelerate the dissociation of NFκB from DNA in a negative feedback loop to terminate signaling, a process termed “molecular stripping” mediated by the negatively charged PEST sequence at its C‐terminus. 9, 29, 30, 31 When the acidic residues in the PEST sequence of IκBα are mutated to their amide counterparts, a stable ternary complex is able to be observed.32 Despite the fact that IκBβ has a PEST sequence, it instead forms a stable ternary complex with NFκB bound to DNA in the nucleus, a function shared with Bcl‐3 which can directly transactivate p50 or p52 homodimers when it forms its own stable ternary complex.33, 34, 35, 36 Early reports showed that IκBε can inhibit NFκB DNA binding,9 but all reported that IκBε was not located in the nucleus. More recent studies have shown that IκBε does indeed shuttle between the cytoplasm and the nucleus, though not as efficiently as IκBα37 thus, its ability to dissociate NFκB from DNA may be relevant after all. Interestingly, a C‐terminal deletion construct (terminating at Residue 332) which effectively removed the putative seventh AR of IκBε was shown to be 20‐fold less efficient at inhibiting NFκB DNA binding while still retaining the ability to bind NFκB.9 Thus, the seventh AR of IκBε that we identified could be essential for IκBε’s ability to perform “molecular stripping” as IκBα does. It is compelling to speculate that the different C‐terminal sequences of IκB family members perform very different functions. The IκBα PEST is implicated in stripping NFκB from the DNA whereas the IκBβ PEST is implicated in the formation of a stable ternary complex. Neither Bcl‐3 nor IκBε has PEST sequences, instead, they have seventh ankyrin repeats. Again, however, the Bcl‐3 AR7 is involved in forming a stable ternary complex whereas the IκBε AR7 is likely involved in molecular stripping. Future work on the biophysical and functional characterization of IκBε will test this hypothesis.
Materials and methods
Protein expression and purification
Human IκBα67–287 was expressed and purified as previously described using anion exchange chromatography (HiLoad Q HR 16/10; GE Healthcare, Chicago, IL) followed by size exclusion chromatography (Superdex S75; GE Healthcare).38 Murine IκBβ (Residues 50–359) in pET 11a was expressed in BL21(DE3) cells and purified as described for IκBα (38) except that size exclusion chromatography was performed on a Superdex S200 column (GE healthcare) because IκBβ elutes as a dimer and higher oligomer. Only the dimer peak was used in the studies performed here, and the dimer appears to be weakly associated as the IκBβ behaves as a monomer in binding assays (unpublished data).
Murine, N‐terminal hexahistidine‐IκBε40–364 was cloned into a pET11a expression vector and transformed into BL21(DE3) cells and grown at 37°C with shaking in M9 minimal media supplemented with ampicillin to an OD600 of 0.6 and protein expression was induced with 0.2 mM isopropyl‐β‐thiogalactopyranoside (IPTG) and incubated with shaking at 12°C for 18 h. Cells were pelleted at 5000 rpm and resuspended in 25 mM Tris pH 7.5, 50 mM NaCl, 0.5 mM phenylmethylsulfonyl fluoride (PMSF), 10 mM β‐mercaptoethanol (βME), and protease inhibitor cocktail (Sigma‐Aldrich, St. Louis, MO). Cell membranes were disrupted using sonication and lysates were cleared via centrifugation at 12,000 rpm for 45 min. Clarified lysates were then batch bound to Ni‐NTA beads (Thermo Scientific, Waltham, MA) equilibrated in Buffer A (25 mM Tris pH 7.5, 150 mM NaCl, 10 mM imidazole, 10 mM βME, and 0.5 mM PMSF) with rocking at 4°C for 2 h. The beads were poured into a column and washed with Buffer A and a 20 mM imidazole wash buffer prior to elution with Buffer B (25 mM Tris pH 7.5, 150 mM NaCl, 250 mM imizadole, 10 mM βME, and 0.5 mM PMSF). Fractions containing IκBε were then dialyzed overnight at 4°C to remove imidazole in a Dialysis Buffer containing 25 mM Tris pH 7.5, 150 mM NaCl, 0.5 mM ethylenediaminetetraacetic acid (EDTA), and 10 mM βME. The dialyzed protein was then either frozen in 2 mL aliquots at −80°C until needed or immediately further purified from aggregates by size exclusion chromatography (Superdex S200; GE Healthcare) in Dialysis Buffer.
Human Bcl‐3127‐367 was expressed in a pET11a vector as described for IκBε40–364. Cell pellets were resuspended in 20 mM 2‐(N‐morpholino)ethanesulfonic acid (MES) pH 6.5, 150 mM NaCl, 0.5 mM EDTA, 0.5 mM PMSF, 3 mM DTT, and protease inhibitor cocktail (Sigma‐Aldrich). Clarified lysates were purified using cation exchange chromatography (SP‐Sepharose Fast Flow; GE Healthcare) and elution with a linear salt gradient from Buffer A (20 mM MES pH 6.5, 150 mM NaCl, 3 mM DTT) to Buffer B (20 mM MES pH 6.5, 1 M NaCl, 3 mM DTT). Fractions containing Bcl‐3 were further purified using size exclusion chromatography (Superdex S200; GE Healthcare) equilibrated in 20 mM MES pH 6.5, 150 mM NaCl, and 3 mM DTT prior to HDX‐MS experiments.
Protein concentration of RelA‐p50 (ε = 43, 760 M−1 cm−1), IκBα67–287 (ε = 12,090 M−1 cm−1), IκBε40–364 (ε = 16,960 M−1 cm−1), Bcl‐3127‐367 (ε = 7500 M−1 cm−1), and IκBβ50–359 (ε = 15,930 M−1 cm−1) were determined using their molar extinction coefficients.
HDX‐MS
HDX‐MS was performed using a Waters Synapt G2Si equipped with nanoACQUITY UPLC system with H/DX technology and a LEAP autosampler. Individual proteins were purified by size exclusion chromatography in 25 mM Tris pH 7.5, 150 mM NaCl, 1 mM DTT, 0.5 mM EDTA for IκBα, IκBβ, and IκBε and 20 mM MES pH 6.5, 150 mM NaCl, 3 mM DTT for Bcl‐3 immediately prior to analysis. The final concentrations of proteins in each sample were 5 μM. For each deuteration time, 4 μL complex was equilibrated to 25°C for 5 min and then mixed with 56 μL D2O buffer (25 mM Tris pH 7.5, 150 mM NaCl, 1 mM DTT, 0.5 mM EDTA in D2O for IκBα, IκBβ, and IκBε and 20 mM MES pH 6.5, 150 mM NaCl, 3 mM DTT for Bcl‐3) for 0, 0.5, 1, 2, or 5 min. The exchange was quenched with an equal volume of quench solution (3 M guanidine, 0.1% formic acid, pH 2.66).
The quenched sample (50 μL) was injected into the sample loop, followed by digestion on an in‐line pepsin column (immobilized pepsin, Pierce, Inc.) at 15°C. The resulting peptides were captured on a BEH C18 Vanguard pre‐column, separated by analytical chromatography (Acquity UPLC BEH C18, 1.7 μM, 1.0 × 50 mm, Waters Corporation, Milford, MA) using a 7–85% acetonitrile in 0.1% formic acid over 7.5 min, and electrosprayed into the Waters SYNAPT G2Si quadrupole time‐of‐flight mass spectrometer. The mass spectrometer was set to collect data in the Mobility, ESI+ mode; mass acquisition range of 200–2000 (m/z); scan time 0.4 s. Continuous lock mass correction was accomplished with infusion of leu‐enkephalin (m/z = 556.277) every 30 s (mass accuracy of 1 ppm for calibration standard). For peptide identification, the mass spectrometer was set to collect data in MSE, ESI+ mode instead.
The peptides were identified from triplicate MSE analyses of 10 μM IκBα, 10 μM IκBε, 10 μM IκBβ, and 10 μM Bcl‐3, and data were analyzed using PLGS 2.5 (Waters Corporation). Peptide masses were identified using a minimum number of 250 ion counts for low energy peptides and 50 ion counts for their fragment ions. The peptides identified in PLGS were then analyzed in DynamX 3.0 (Waters Corporation) and the deuterium uptake was corrected for back‐exchange as previously described.39 The relative deuterium uptake for each peptide was calculated by comparing the centroids of the mass envelopes of the deuterated samples versus the undeuterated controls following previously published methods.40 The experiments were performed in triplicate, and independent replicates of the triplicate experiment were performed to verify the results.
PONDR analysis
The protein sequences for human IκBα, human IκBβ, human Bcl‐3, and murine IκBε were analyzed using the VL‐XT algorithm on the open‐access platform provided by Molecular Kinetics Inc. PONDR scores were then plotted using Kaleidagraph 4.5 as a function of amino acid.
Energy minimization of homology model structures
Each model generated from the SWISS‐Model platform was opened in the Chimera (UCSF) software and the built‐in energy minimization function was utilized to allow the bonds and angles to relax and eliminate possible bad contacts. This was performed using 100 steepest descent steps of 0.02 Å followed by 40 conjugate gradient steps of 0.02 Å using AMBER ff14SB. Each resulting structure was then energy minimized by the same parameters three additional times.41
SASA calculations
The GetArea server (available at http://curie.utmb.edu/getarea.html) was used to calculate the backbone SASA of each energy minimized model.42 This calculation was performed with a water probe of 1.4 Å and default atomic radii and atomic solvent parameters. The backbone SASA for control crystal structures was performed in the same way for IκBα:RelA/p50 (PDB: 1NFI and 1IKN) and Bcl‐3 (PDB: 1K1B). Plots correlating backbone SASA and deuterium uptake were created using MATLAB R2017b (9.3.0.713579) and R‐values were determined using the built‐in correlation function. Regression analysis provided the line of correlation for each plot and the standard deviation was calculated as the standard error of the estimate using the following equation:
where Y is the measured deuterium uptake, Y′ is the deuterium uptake predicted from the regression line, and N is the number of data points. The lines representing one standard deviation from the correlation line were plotted above and below the regression line.
Supporting information
Supplementary Figure 1. Backbone solvent accessible surface area (SASA) correlates strongly with deuterium uptake from HDXMS. The GetArea server was used to calculate the backbone SASA for each residue in the crystal structures of Bcl‐3 (PDB 1K1B) and IκBα (PDB codes 1NFI, 1IKN). HDXMS was performed on each of these proteins and the deuterium uptake for each peptide was plotted (y‐axis) as a function of backbone SASA (x‐axis). The upper panel shows the correlation for Bcl‐3, for which the correlation coefficient (R) was 0.79. The middle panel shows the correlation for IκBα (PDB 1IKN), for which the correlation coefficient (R) was 0.73. The lower plot shows the correlation for IκBα (PDB 1NFI), for which the correlation coefficient (R) was 0.86. The plots show the correlation line from regression analysis in yellow with lines above and below in red indicating the region within one standard deviation of the regression line. The majority of HDXMS peptides fall within one standard deviation of the correlation line. These data were used to ascertain the goodness of fit for the correlation plots of the homology models.
Acknowledgments
This work was supported by P01 GM071862. K. M. R. acknowledges support from the Molecular Biophysics Training Program T32 GM008326.
References
- 1. Baeuerle PA (1998) IkB‐NF‐kB structures: at the interface of inflammation control. Cell 95:729–731. [DOI] [PubMed] [Google Scholar]
- 2. Ghosh S, May MJ, Kopp EB (1998) NF‐kappa B and Rel proteins: evolutionarily conserved mediators of immune responses. Ann Rev Immunol 16:225–260. [DOI] [PubMed] [Google Scholar]
- 3. Tam WF, Sen R (2001) IκB family members function by different mechanisms. J Biol Chem 276:7701–7704. [DOI] [PubMed] [Google Scholar]
- 4. Huxford T, Huang DB, Malek S, Ghosh G (1998) The crystal structure of the IkappaBalpha/NF‐kappaB complex reveals mechanisms of NF‐kappaB inactivation. Cell 95:759–770. [DOI] [PubMed] [Google Scholar]
- 5. Jacobs MD, Harrison SC (1998) Structure of an IkappaBalpha/NF‐kappaB complex. Cell 95:749–758. [DOI] [PubMed] [Google Scholar]
- 6. Michel F, Soler‐Lopez M, Petosa C, Cramer P, Siebenlist U, Muller CW (2001) Crystal structure of the ankyrin repeat domain of Bcl‐3: a unique member of the IkappaB protein family. EMBO 20:6180–6190. [DOI] [PMC free article] [PubMed] [Google Scholar]
- 7. Malek S, Huang DB, Huxford T, Ghosh S, Ghosh G (2003) X‐ray crystal structure of an IkappaBbeta x NF‐kappaB p65 homodimer complex. J Biol Chem 278:23094–23100. [DOI] [PubMed] [Google Scholar]
- 8. Li Z, Nabel GJ (1997) A new member of the IκB protein gamily, IκBε, inhibits RelA (p65)‐mediated NF‐κB transcription. Mol Cell Biol 17:6184–6190. [DOI] [PMC free article] [PubMed] [Google Scholar]
- 9. Simeonidis S, Liang S, Chen G, Thanos D (1997) Cloning and functional characterization of mouse IkappaBepsilon. Proc Natl Acad Sci USA 94:14372–14377. [DOI] [PMC free article] [PubMed] [Google Scholar]
- 10. Whiteside ST, Epinat JC, Rice NR, Israël A (1997) I kappa B epsilon, a novel member of the IκB family, controls RelA and cRel NF‐κB activity. EMBO J 16:1413–1426. [DOI] [PMC free article] [PubMed] [Google Scholar]
- 11. Martí‐Renom MA, Stuart AC, Fiser A, Sánchez R, Melo F, Sali A (2000) Comparative protein structure modeling of genes and genomes. Ann Rev Biophys Biomol Struct 29:291–325. [DOI] [PubMed] [Google Scholar]
- 12. Aksel T, Majumdar A, Barrick D (2011) The contribution of entropy, enthalpy, and hydrophobic desolvation to cooperativity in repeat‐protein folding. Structure 19:349–360. [DOI] [PMC free article] [PubMed] [Google Scholar]
- 13. Parra RG, Espada R, Verstraete N, Ferreiro DU (2015) Structural and energetic characterization of the ankyrin repeat protein family. PLoS Comput Biol 11:e1004659. [DOI] [PMC free article] [PubMed] [Google Scholar]
- 14. Zhang Z, Smith DL (1993) Determination of amide hydrogen exchange by mass spectrometry: a new tool for protein structure elucidation. Protein Sci 2:522–531. [DOI] [PMC free article] [PubMed] [Google Scholar]
- 15. Zweifel ME, Barrick D (2001) Studies of the ankyrin repeats of the Drosophila melanogaster Notch receptor. 2. Solution stability and cooperativity of unfolding. Biochemistry 40:14357–14367. [DOI] [PubMed] [Google Scholar]
- 16. Xue B, Dunbrack RL, Williams RW, Dunker AK, Uversky VN (2010) PONDR‐FIT: a meta‐predictor of intrinsically disordered amino acids. Biochim Biophys Acta 1804:996–1010. [DOI] [PMC free article] [PubMed] [Google Scholar]
- 17. Altschul SF, Madden TL, Schäffer AA, Zhang J, Zhang Z, Miller W, Lipman DJ (1997) Gapped BLAST and PSI‐BLAST: a new generation of protein database search programs. Nucleic Acids Res 25:3389–3402. [DOI] [PMC free article] [PubMed] [Google Scholar]
- 18. Remmert M, Biegert A, Hauser A, Söding J (2011) HHblits: lightning‐fast iterative protein sequence searching by HMM‐HMM alignment. Nat Methods 9:173–175. [DOI] [PubMed] [Google Scholar]
- 19. Biasini M, Schmidt T, Bienert S, Mariani V, Studer G, Haas J, Johner N, Schenk AD, Philippsen A, Schwede T (2013) OpenStructure: an integrated software framework for computational structural biology. Acta Cryst D 69:701–709. [DOI] [PMC free article] [PubMed] [Google Scholar]
- 20. Biasini M, Bienert S, Waterhouse A, Arnold K, Studer G, Schmidt T, Kiefer F, Cassarino TG, Bertoni M, Bordoli L, Schwede T (2014) SWISS‐MODEL: modelling protein tertiary and quaternary structure using evolutionary information. Nucleic Acids Res 42:W252–W258. [DOI] [PMC free article] [PubMed] [Google Scholar]
- 21. Benkert P, Tosatto SCE (2008) QMEAN: a comprehensive scoring function for model quality assessment. Proteins 71:261–277. [DOI] [PubMed] [Google Scholar]
- 22. Benkert P, Biasini M, Schwede T (2011) Toward the estimation of the absolute quality of individual protein structure models. Bioinformatics 27:343–350. [DOI] [PMC free article] [PubMed] [Google Scholar]
- 23. Benkert P, Kunzli M, Schwede T (2009) QMEAN server for protein model quality estimation. Nucleic Acids Res 37:W510–W514. [DOI] [PMC free article] [PubMed] [Google Scholar]
- 24. Truhlar SM, Croy CH, Torpey JW, Koeppe JR, Komives EA (2006) Solvent accessibility of protein surfaces by amide H/2H exchange MALDI‐TOF mass spectrometry. J Am Soc Mass Spec 17:1490–1497. [DOI] [PubMed] [Google Scholar]
- 25. Sedgwick SG, Smerdon SJ (1999) The ankyrin repeat: a diversity of interactions on a common structural framework. Trends Biochem Sci 24:311–316. [DOI] [PubMed] [Google Scholar]
- 26. Binz HK, Stumpp MT, Forrer P, Amstutz P, Plückthun A (2003) Designing repeat proteins: well‐expressed, soluble and stable proteins from combinatorial libraries of consensus ankyrin repeat proteins. J Mol Biol 332:489–503. [DOI] [PubMed] [Google Scholar]
- 27. Croy CH, Bergqvist S, Huxford T, Ghosh G, Komives EA (2004) Biophysical characterization of the free IκBα ankyrin repeat domain in solution. Protein Sci 13:1767–1777. [DOI] [PMC free article] [PubMed] [Google Scholar]
- 28. Keppel TR, Jacques ME, Young RW, Ratzlaff KL, Weis DD (2011) An efficient and inexpensive refrigerated LC system for H/D exchange mass spectrometry. J Am Soc Mass Spectrom 22:1472–1476. [DOI] [PubMed] [Google Scholar]
- 29. Bergqvist S, Alverdi V, Mengel B, Hoffmann A, Ghosh G, Komives EA (2009) Kinetic enhancement of NF‐kappaB•DNA dissociation by IkappaBalpha. Proc Natl Acad Sci USA 106:19328–19333. [DOI] [PMC free article] [PubMed] [Google Scholar]
- 30. Sue SC, Alverdi V, Komives EA, Dyson HJ (2011) Detection of a ternary complex of NF‐κB and IκBα with DNA provides insights into how IκBα removes NF‐κB from transcription sites. Proc Natl Acad Sci USA 108:1367–1372. [DOI] [PMC free article] [PubMed] [Google Scholar]
- 31. Alverdi V, Hetrick B, Joseph S, Komives EA (2014) Direct observation of a transient ternary complex during IκBα‐mediated dissociation of NF‐κB from DNA. Proc Natl Acad Sci USA 111:225–230. [DOI] [PMC free article] [PubMed] [Google Scholar]
- 32. Dembinski HE, Wismer K, Vargas J, Suryawanshi GW, Kern N, Kroon G, Dyson HJ, Hoffmann A, Komives EA (2017) Functional consequences of stripping in NFkB signaling revealed by a stripping‐impaired IkBa mutant. Proc Natl Acad Sci USA 114:1916–1921. [DOI] [PMC free article] [PubMed] [Google Scholar]
- 33. Bours V, Franzoso G, Azarenko V, Park S, Kanno T, Brown K, Siebenlist U (1993) The oncoprotein Bcl‐3 directly transactivates through κB motifs via association with DNA‐binding p50B homodimers. Cell 72:729–739. [DOI] [PubMed] [Google Scholar]
- 34. Thompson JE, Phillips RJ, Erdjument‐Bromagne H, Tempst P, Ghosh S (1995) IκB‐β regulates the persistent response in a biphasic activation of NF‐κB. Cell 80:573–582. [DOI] [PubMed] [Google Scholar]
- 35. Chu ZL, McKinsey TA, Liu L, Qi X, Ballard DW (1996) Basal phosphorylation of the PEST domain in IκBβ regulates its functional interaction with the c‐rel proto‐oncogene product. Mol Cell Biol 16:5974–5984. [DOI] [PMC free article] [PubMed] [Google Scholar]
- 36. Tran K, Merika M, Thanos D (1997) Distinct functional properties of IκBα and IκBβ. Mol Cell Biol 17:5386–5399. [DOI] [PMC free article] [PubMed] [Google Scholar]
- 37. Lee SH, Hannink M (2002) Characterization of the nuclear import and export functions of IκBε. J Biol Chem 277:23358–23366. [DOI] [PubMed] [Google Scholar]
- 38. Dembinski H, Wismer K, Balasubramaniam D, Gonzalez HA, Alverdi V, Iakoucheva LM, Komives EA (2014) Predicted disorder‐to‐order transition mutations in IκBα disrupt function. Phys Chem Chem Phys 16:6480–6485. [DOI] [PMC free article] [PubMed] [Google Scholar]
- 39. Ramsey KM, Dembinski HE, Chen W, Ricci CG, Komives EA (2017) DNA and IκBα both induce long‐range conformational changes in NFκB. J Mol Biol 429:999–1008. [DOI] [PMC free article] [PubMed] [Google Scholar]
- 40. Wales TE, Fadgen KE, Gerhardt GC, Engen JR (2008) High‐speed and high‐resolution UPLC separation at zero degrees Celsius. Anal Chem 80:6815–6820. [DOI] [PMC free article] [PubMed] [Google Scholar]
- 41. Pettersen EF, Goddard TD, Huang CC, Couch GS, Greenblatt DM, Meng EC, Ferrin TE (2004) UCSF Chimera – a visualization system for exploratory research and analysis. J Comp Chem 25:1605–1612. [DOI] [PubMed] [Google Scholar]
- 42. Fraczkiewicz R, Braun W (1998) Exact and efficient analytical calculation of the accessible surface areas and their gradients for macromolecules. J Comp Chem 19:319–333. [Google Scholar]
- 43. Mosavi LK, Cammett TJ, Desrosiers DC, Peng ZY (2004) The ankyrin repeat as molecular architecture for protein recognition. Protein Sci 13:1435–1448. [DOI] [PMC free article] [PubMed] [Google Scholar]
- 44. Romero P, Obradovic Z, Dunker AK (1997) Sequence data analysis for long disordered regions prediction in the calcineurin family. Genome Informatics 8:110–124. [PubMed] [Google Scholar]
- 45. Li X, Romero P, Rani M, Dunker AK, Obradovic Z (1999) Predicting protein disorder for N‐, C‐, and interal regions. Genome Informatics 10:30–40. [PubMed] [Google Scholar]
Associated Data
This section collects any data citations, data availability statements, or supplementary materials included in this article.
Supplementary Materials
Supplementary Figure 1. Backbone solvent accessible surface area (SASA) correlates strongly with deuterium uptake from HDXMS. The GetArea server was used to calculate the backbone SASA for each residue in the crystal structures of Bcl‐3 (PDB 1K1B) and IκBα (PDB codes 1NFI, 1IKN). HDXMS was performed on each of these proteins and the deuterium uptake for each peptide was plotted (y‐axis) as a function of backbone SASA (x‐axis). The upper panel shows the correlation for Bcl‐3, for which the correlation coefficient (R) was 0.79. The middle panel shows the correlation for IκBα (PDB 1IKN), for which the correlation coefficient (R) was 0.73. The lower plot shows the correlation for IκBα (PDB 1NFI), for which the correlation coefficient (R) was 0.86. The plots show the correlation line from regression analysis in yellow with lines above and below in red indicating the region within one standard deviation of the regression line. The majority of HDXMS peptides fall within one standard deviation of the correlation line. These data were used to ascertain the goodness of fit for the correlation plots of the homology models.


