

Abstract
Memory T cell (Tmem) responses play a critical role in the outcome of allo‐transplantation. While the role of the T‐box transcription factor Eomesodermin (Eomes) in the maintenance of antigen‐specific Tmem is well studied, little is known about Eomes+CD8+T cell responses after transplantation. We evaluated the phenotype and function of allo‐reactive Eomes+CD8+T cells in healthy volunteers and kidney transplant patients and their relation to transplant outcome. High Eomes expression by steady‐state CD8+T cells correlated with effector and memory phenotype. Following allo‐stimulation, the expression of both the T‐box proteins Eomes and T‐bet by proliferating cells increased significantly, where high expression of Eomes and T‐bet correlated with higher incidence of allo‐stimulated IFNγ+TNFα+ CD8+T cells. In patients with no subsequent rejection, Eomes but not T‐bet expression by donor‐stimulated CD8+T cells, increased significantly after transplantation. This was characterized by increased EomeshiT‐bet‐/lo and decreased Eomes‐/loT‐bethi CD8+T cell subsets, with no significant changes in the EomeshiT‐bethi CD8+T cell subset. No upregulation of exhaustion markers programmed‐death‐1 (PD‐1) and cytotoxic‐T‐lymphocyte‐associated‐antigen‐4 (CTLA4) by donor‐stimulated Eomes+CD8+T cells was observed. Before transplantation, in patients without rejection, there were higher incidences of EomeshiT‐bet‐/lo, and lower incidences of EomeshiT‐bethi and Eomes‐/loT‐bethi donor‐stimulated CD8+T cell subsets, compared to those with subsequent rejection. Overall, our findings indicate that high Eomes expression by allo‐stimulated T‐bet+CD8+T cells is associated with enhanced effector function, and that an elevated incidence of donor‐stimulated CD8+T cells co‐expressing high levels of Eomes and T‐bet before transplantation, may correlate with an increased incidence of acute cellular rejection.
Keywords: Eomesodermin, human, kidney transplantation, memory T cells, rejection, T‐bet
Introduction
Pro‐inflammatory and cytotoxic memory T cells (Tmem) with enhanced proliferative and functional capacities 1, compared with naïve T cells, are activated by antigen (Ag)‐ presenting cells in diverse tissues, including organ allografts 2, 3. Additionally, allo‐reactive effector CD4+ and CD8+ Tmem are less susceptible to suppression by regulatory T cells in vivo, than their naïve T cell counterparts 4. Hence, Tmem are considered a major barrier to improved long‐term allograft survival and tolerance induction 5, 6.
Tmem are immunosuppression‐resistant 4, where allo‐reactive CD8+ Tmem are known to be more resistant than CD4+ Tmem 7, 8. In rodents, multiple viral infections result in the development of CD8+ Tmem that cross‐react with allo‐antigen (Ag) 9, and mediate resistance to tolerance induction. Unlike naïve CD8+ T cells, primed CD8+ Tmem are capable of mediating allograft rejection independent of CD154 co‐stimulation 10, whereas treatment with CD154 blockade does not prevent allograft rejection in sensitized allograft recipients 11. Accordingly, tolerance induction has not been successful in sensitized recipients exhibiting high levels of primed Tmem at the time of transplantation 12, 13. Furthermore, while deletion of allo‐reactive T cells is known to be critical for tolerance induction, homeostatic proliferation following lymphodepletion results in the development of Tmem that are immunosuppression‐resistant and can promote allograft rejection 14.
Eomesodermin (Eomes), a paralogue of the hallmark T‐helper (Th)1 cell transcription factor T‐bet, plays a key role in CD8+Tmem differentiation, survival and function 15, 16, 17. It is essential for long‐term survival of Ag‐specific effector CD8+ Tmem 17. In rodents, both Eomes and T‐bet orchestrate the induction and long‐term maintenance of effector CD8+T cell function. T‐bet is essential for early programming of cytokine production 18, whereas Eomes is induced during CD8+T cell differentiation and required to maintain effector function 19. Additionally, rodent studies have demonstrated critical roles of both T‐bet and Eomes in maintaining long‐term anti‐viral immunity and in preventing chronic viral infection 20, 21, 22, 23.
While Th1 responses and T‐bet expression have been linked to allograft rejection 24, 25, there is little information concerning the role of Eomes in the regulation of allo‐immunity. Furthermore, the relative expression of Eomes by allo‐reactive CD8+T cells and its relation to graft outcome in human organ transplant (tx) recipients is not known. Here, we evaluated Eomes and T‐bet expression by allo‐stimulated CD8+T cells of healthy volunteers and by donor‐stimulated CD8+T cells, before and after tx, in kidney tx patients given lymphodepletion induction therapy.
Materials and methods
Healthy subjects
Healthy adult volunteers of both sexes were recruited following informed consent under an IRB‐approved protocol at the University of Pittsburgh. In addition, leukocyte concentrates from healthy volunteers were purchased from the Pittsburgh Blood Bank, Pittsburgh, PA.
Kidney transplant patients
Cryopreserved peripheral blood mononuclear cell (PBMC) samples from consenting kidney tx patients were obtained from the human transplant biorepository at the Thomas E. Starzl Transplantation Institute. Demographics and general information concerning these patients are shown in Table 1. Three groups of patients were analyzed: (i) patients with no T cell‐mediated rejection within the first year post‐tx, i.e. stable (n = 11), (ii) patients with subclinical rejection (SCR), i.e. diagnosis of T cell‐mediated rejection in protocol biopsy with stable graft function (n = 5), and (iii) patients with acute cellular rejection (ACR), defined as those patients that had histological findings of cellular rejection and clinical graft dysfunction (n = 5). All patients were recipients of living‐donor kidney tx. All patients received T cell‐depleting polyclonal Ab (Thymoglobulin) as induction therapy and standard‐of‐care immunosuppression based on tacrolimus, mycophenolate mofetil (MMF) and methylprednisolone. In 2 patients (with no rejection), Azathioprine was administered instead of MMF.
Table 1.
Demographic and clinical characteristics of living donor kidney transplant patients with or without rejection

Peripheral blood mononuclear cell isolation
PBMC obtained from healthy volunteers and patients were isolated using Ficoll‐Paque Plus (GE Healthcare Bio‐Sciences; Piscataway, NJ) and cryopreserved with RPMI‐1640 (Invitrogen, Carlsbad, CA), 20% v/v fetal bovine serum (FBS) (Atlanta Biologicals; Flowery Branch, GA) and 10% dimethyl sulfoxide (Thermo Fisher Scientific, Pittsburgh, PA). For tx patients, samples were collected before, 1‐month, 3‐months and 1‐year after tx, when available, then processed and stored as above.
Flow cytometric analysis
For cell surface staining, the following conjugated Abs (and clones) were used: PerCP‐Cy5.5 CD3 (SP34‐2), APC‐H7 CD4 (L200), PECy7 CCR7 (3D12) and V450 CD45RA (5H9) from Becton Dickinson (BD; Franklin Lakes, NJ) and AF700 or PECy7 CD8 (RPA‐T8) from Biolegend (San Diego, CA). For intracellular staining, cell fixation and permeabilization were performed using Fix and Perm reagent (eBioscience, San Diego, CA) and the following conjugated Abs used: eFluor660 Eomes (WD1928) and PE or VB420 T‐bet (eBio4B10) from eBioscience; PE IFNγ (4SB3), Pacific Blue or AF700 TNFα (MAb11) and V450 Granzyme‐B (GrB) (GB11) from Biolegend. For cytokine staining, cells were stimulated with phorbol myristate acetate (PMA; 1ng/µl) and ionomycin (100ng/µl) for 3‐4 hr at 37°C. Data were acquired using a Fortessa flow cytometer (BD) and analysis performed using FlowJo software (Tree Star, San Carlos, CA).
CD3/CD28 activation
After thawing, PBMC were stained with 4uM carboxyfluorescein succinimidyl ester (CFSE; Invitrogen) and plated at a density of 2 x 10⁵ cells per well (round‐bottom 96‐well plates) with RPMI‐1640 (Invitrogen, Carslbad, CA) supplemented with 10% FBS, 2mM L‐glutamine (Mediatech Inc., Herndon, VA), 100 U/ml penicillin‐streptomycin (BioWhittaker, Walkersville MD), 10 mM HEPES (Mediatech) and 55 µM β‐2 mercaptoethanol (Invitrogen). Cells were activated with CD3/CD28 beads (T cell activation/expansion kit, Miltenyi Biotec), and cultured at 37°C for 4 days.
CFSE‐mixed leukocyte reaction (MLR)
In experiments using samples obtained from healthy volunteers, T lymphocytes were purified by magnetic selection (Pan T isolation kit; Cat#130‐091‐113, Miltenyi Biotec, Auburn, CA) from cryopreserved PBMC, followed by CFSE staining (Invitrogen). T cell‐depleted allogeneic PBMC were used as stimulators. Responders were co‐cultured with irradiated (3000 cGy) stimulators in complete RPMI‐1640 supplemented with 10% v/v FBS, 2mM L‐glutamine (Mediatech), 100 U/ml penicillin‐streptomycin (BioWhittaker), 10 mM HEPES (Mediatech Inc) and 55 µM β‐2 mercaptoethanol (Invitrogen), at a ratio of 1:1, in 96‐well, U‐bottom plates, and at a final concentration of 4x10⁵ cells/well at 37°C in 5% CO2 in air. Cultures were harvested on days 3, 5 or 7. Responder cells without stimulation served as controls.
In kidney tx patients, because the number of cells obtained after tx was limited, MLR were set up without sorting responder (recipient) or stimulator (donor) cells. CFSE‐stained responder cells were co‐cultured with irradiated (3000 cGy) stimulator PBMC stained with cell tracker violet BMQC (Life Technologies C10094, Carlsbad, CA). Cultures were harvested on day 7. Proliferation was determined by CFSE dilution, after gating out the stimulators (cell tracker violet positive cells).
Statistical analysis
All statistical analyses were performed using GraphPad Prism 6.07 software (GraphPad). The Wilcoxon test (for paired variables) or Mann‐Whitney test was used for analysis. P < 0.05 was considered statistically significant.
Results
Memory and effector phenotype of Eomeshi versus Eomes‐/lo CD8+T cells in healthy volunteers, before and after allo‐stimulation
Naïve and memory subsets of non‐activated Eomeshi versus Eomes‐/lo CD8+T cells in peripheral blood of healthy volunteers were evaluated based on their differential expression of CD45RA and CCR7, i.e. naïve (Tn; CD45RA+CCR7+), central memory (Tcm; CD45RA‐CCR7+), effector memory (Tem; CD45RA‐CCR7‐) and terminally‐differentiated effector memory (Temra; CD45RA+CCR7‐). Eomeshi CD8+T cells were comprised mostly of Tem and Temra. Of note, the percentages of Temra among the Eomeshi CD8+T cell population were significantly higher than among Eomes‐/lo CD8+T cells (P < 0.05), while naïve and Tcm were significantly higher in Eomes‐/lo compared to Eomeshi CD8+ T cells (Fig. 1a). Next, we examined the expression of the effector molecules GrB, IFNγ and TNFα by Eomeshi versus Eomes‐/lo CD8+T cells following their stimulation for 3‐4 hr with PMA/ionomycin. Eomeshi CD8+T cells consistently comprised significantly higher percentages of GrB+, IFNγ+ and TNFα+ cells (P < 0.05) than Eomes‐/lo CD8+T cells (Fig. 1b).
Figure 1.
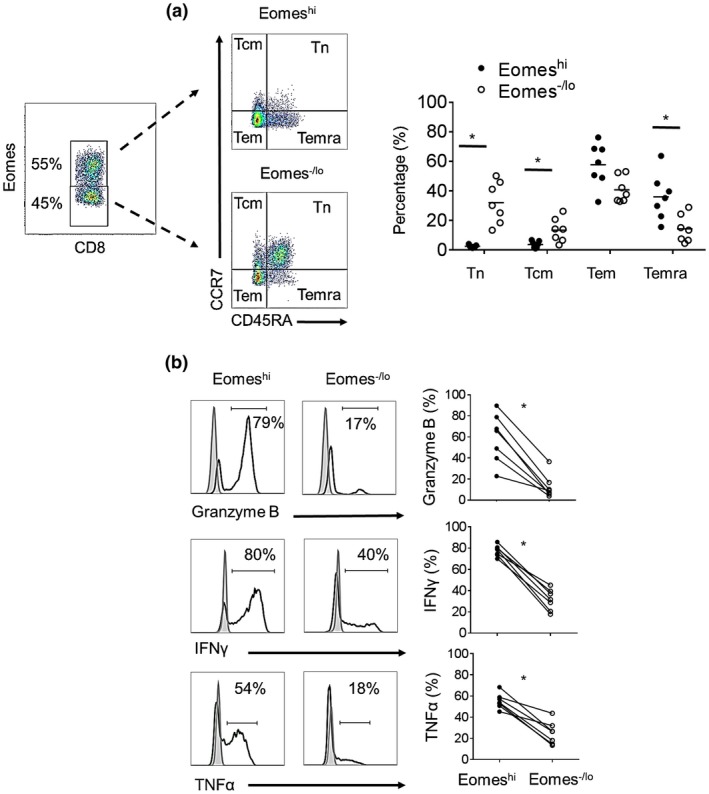
Memory and effector phenotype of Eomeshi versus Eomes‐/lo non‐activated CD8+T cells in healthy human volunteers. (a) Memory CD8+T cell subsets were defined based on their differential expression of CD45RA and CCR7: naïve T cells (Tn; CD45RA+CCR7+), central memory T cells (Tcm: CD45RA‐CCR7+), effector memory T cells (Tem: CD45RA‐CCR7‐) and terminally‐differentiated effector memory T cells (Temra; CD45RA+CCR7‐). Dot plots are from one representative individual. Mean values are indicated by horizontal bars (n = 7 individuals). (b) Expression of TNFα, IFNγ and granzyme‐B was assessed after 3‐4 hours of PMA/ionomysin stimulation (n = 7 individuals). Histograms (left) are from one representative individual; results are expressed as percent positive cells. Gray histograms indicate isotype controls. Data from all 7 individuals examined are shown on the right. Wilcoxon‐Mann‐Whitney test; *P < 0.05.
Following stimulation with allogenic human T cell‐depleted PBMC in CFSE‐MLR, two distinct Eomeshi and Eomes‐/lo proliferating CD8+T cell populations were consistently observed (Fig. 2a). The percent proliferation of Eomeshi versus Eomes‐/lo CD8+T cells in response to allo‐stimulation was variable between individuals. This variability in proliferation of Eomeshi versus Eomes‐/lo cells was also observed when the same responder CD8+T cells were stimulated by allogeneic cells from different individuals (data not shown). As reported previously 26, in vitro allo‐stimulated CD8+T cells exhibited a memory phenotype (i.e. CD45RO+; not shown). We further evaluated the memory phenotype of proliferating Eomeshi versus Eomes‐/lo CD8+T cells following allo‐stimulation based on CD45RA and CCR7 expression. As expected, proliferating cells comprised mainly CD45RA negative cells, i.e. either Tcm or Tem. While Eomeshi CD8+T cells comprised significantly higher percentages of Tem than Tcm (P < 0.05), the mean percentages of Tem and Tcm were similar for Eomes‐/lo CD8+T cells (Fig. 2b).
Figure 2.
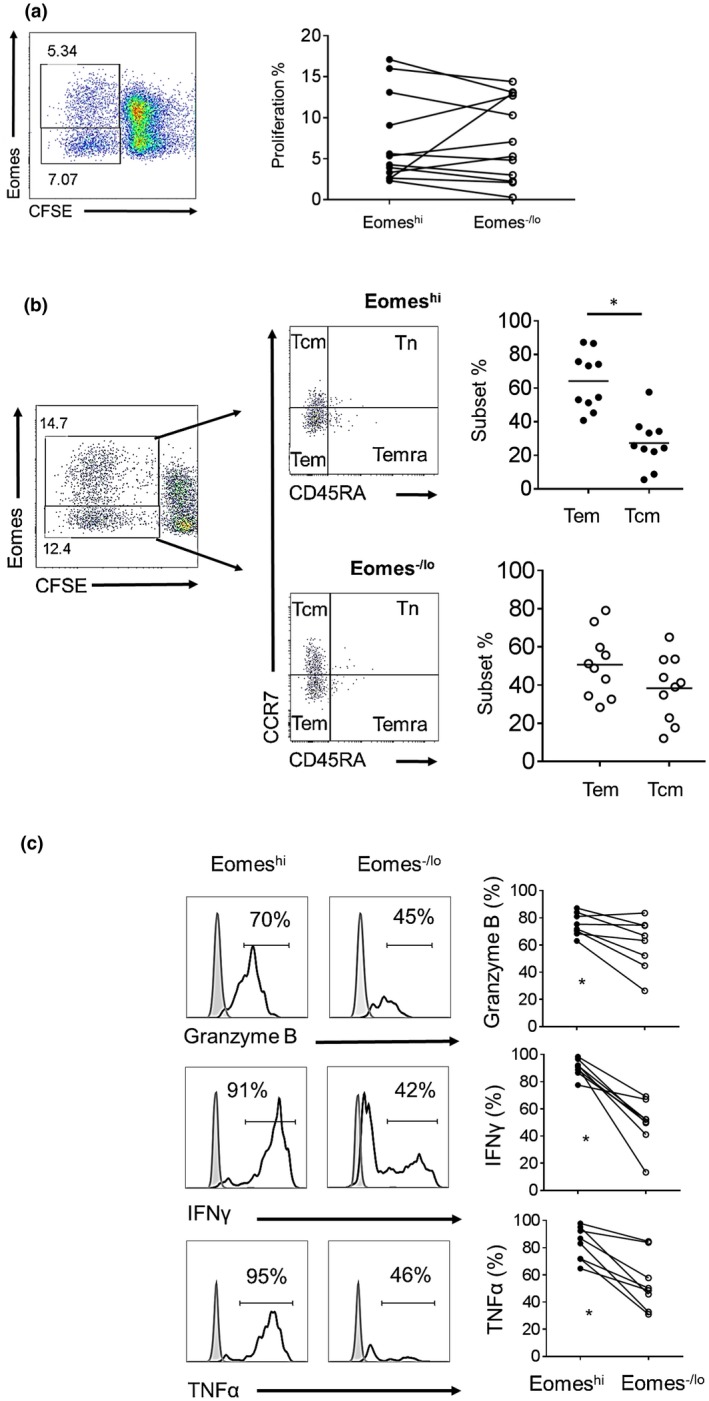
Memory and effector phenotype of allo‐stimulated Eomeshi versus Eomes‐/lo CD8+T cells. (a) CFSE‐labeled purified T cells were co‐cultured with allogeneic stimulators for 5 days. Percent responder cell proliferation was determined by CFSE dilution and Eomes expression by proliferating cells was then evaluated by flow cytometry. The dot plot is from one representative individual. Data from all individuals examined are shown on the right (n = 12). (b) Memory CD8+T cell subsets of proliferating cells were defined based on their differential expression of CD45RA and CCR7 (as in Fig. 1). The dot plots are from one representative individual. Data from 10 individuals examined are shown. (c) Expression of TNFα, IFNγ and granzyme‐B assessed 3‐4 hours after PMA/ionomysin stimulation following coculture with allogeneic stimulators. Histograms (left) are from a representative individual; results are expressed as percent positive cells, gating on proliferating cells. Gray histograms indicate isotype controls. Data from all individuals examined (n = 8) are shown on the right. Wilcoxon‐Mann‐Whitney test; *P < 0.05.
To evaluate their effector phenotype, we examined allo‐stimulated Eomeshi versus Eomes‐/lo CD8+T cells for GrB, IFNγ and TNFα expression following PMA/ionomycin stimulation. Like their non‐stimulated counterparts, allo‐stimulated Eomeshi CD8+T cells exhibited significantly higher incidences of GrB+, IFNγ+ and TNFα+ cells (P < 0.05) than Eomes‐/lo CD8+T cells (Fig. 2c).
Both proliferating and non‐proliferating Eomeshi CD8+T cells comprised a significantly higher incidence of dual IFNγ+TNFα+ cells than Eomes‐/lo cells (Supporting Information Fig. 1). The mean percentages of dual IFNγ+TNFα+ cells among Eomeshi proliferating cells were similar to those of Eomeshi non‐proliferating cells. Furthermore, in the non‐proliferating CD8+T cell populations, Eomeshi cells comprised a significantly higher incidence of dual IFNγ+TNFα+ cells than Eomes‐/lo cells. In correlation, non‐proliferating Eomeshi CD8+T cells were also comprised mainly of Tem and Temra (data not shown). These observations suggest that higher Eomes expression correlates with enhanced effector function, even in the absence of proliferation after allo‐stimulation.
Next, we evaluated the percentages of Eomeshi CD8+T cells and their intensity of Eomes expression 3, 5 and 7 days following allo‐stimulation (Fig. 3). Eomes expression (MFI) increased progressively over time, such that the incidence of proliferating Eomeshi CD8+T cells was higher than that of Eomes‐/lo CD8+T cells after 7 days of culture. This suggests that prolonged allo‐stimulation in vitro is associated with increased incidence of Eomeshi CD8+T cells.
Figure 3.
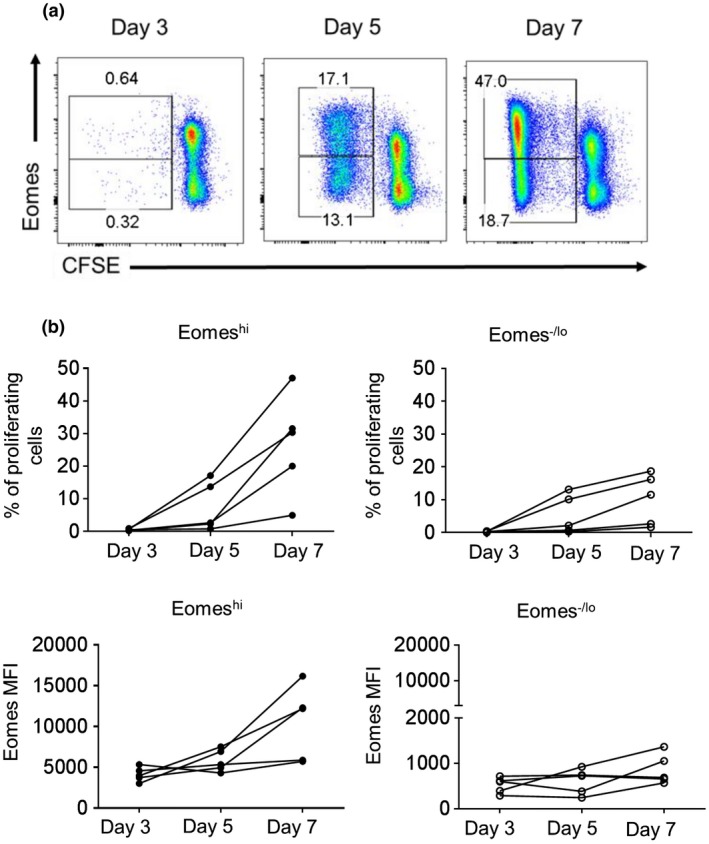
Kinetics of Eomes expression by CD8+T cells following allo‐stimulation in vitro. CFSE‐labeled purified T cells were co‐cultured with allogeneic stimulators for 3, 5 and 7 days. Percent responder cell proliferation determined by CFSE dilution and Eomes expression by proliferating cells over time was then evaluated by flow cytometry. (a) The dot plots are from one representative individual. (b) Percent of proliferation of Eomeshi and Eomes‐/lo CD8+T cells (top) and MFI for Eomes expression (bottom). Combined data from five individuals examined are shown.
T‐bet expression by Eomeshi and Eomes‐/lo CD8+T cells of healthy volunteers, before and after allo‐stimulation
The T‐box protein T‐bet is essential for effector CD8+T cell development and function 16, 21, 27. Furthermore, T‐bet drives Th1 differentiation 28, 29, which plays a major role in T cell responses to allo‐Ag 24, 25. We evaluated Eomeshi and Eomes‐/lo CD8+T cells for T‐bet expression before and after allo‐stimulation. Non‐stimulated Eomeshi CD8+T cells exhibited significantly higher T‐bet expression than Eomes‐/lo CD8+T cells (P < 0.001) (Fig. 4a), which parallels the enhanced effector phenotype of Eomeshi CD8+T cells (Fig. 2c).
Figure 4.
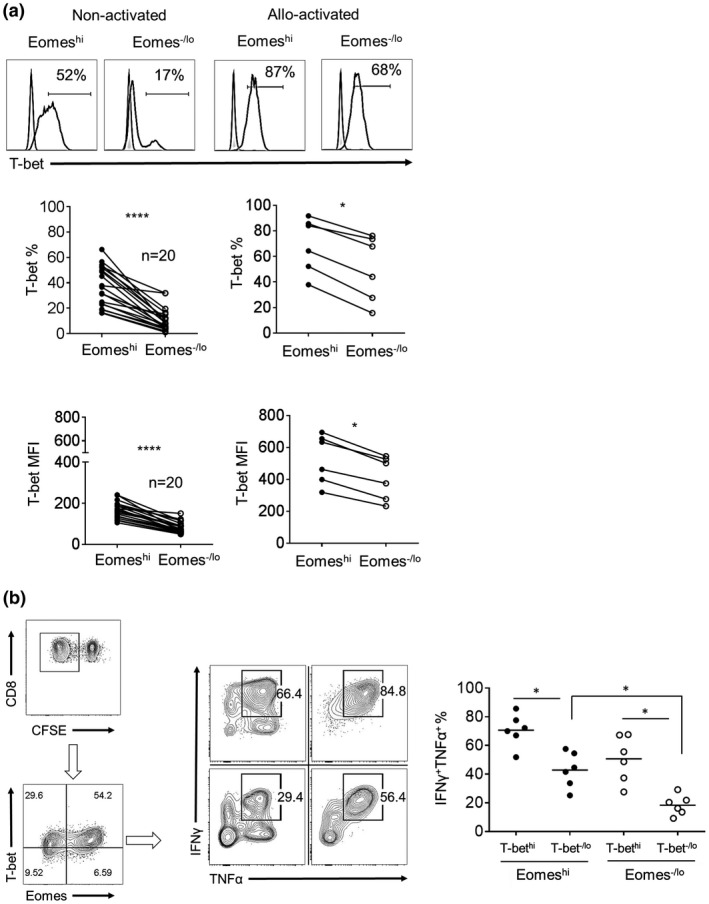
T‐bet expression by non‐stimulated and allo‐stimulated Eomeshi and Eomes‐/lo CD8+T cells. (a) T‐bet expression by non‐activated CD8+T cells (left) and proliferating cells after allo‐stimulation (right). Histograms are from one representative individual. Data from multiple normal healthy individuals are shown below (non‐activated; n = 20 and allo‐stimulated; n = 6). (b) Dual expression of IFNγ and TNFα by EomeshiT‐bethi, EomeshiT‐bet‐/lo, Eomes‐/loT‐bethi and Eomes‐/loT‐bet‐/lo CD8+T cell subsets, following coculture with allogeneic stimulators. Dot plots (left and center) are representative of one individual. Data from 6 individuals are shown in the graph (right). Gray histograms indicate isotype controls. Horizontal bar represents the mean. Wilcoxon‐Mann‐Whitney test; *P < 0.05, ****P < 0.0001.
Following allo‐stimulation, T‐bet expression was upregulated by Eomeshi and Eomes‐/lo proliferating cells. However, T‐bet expression by proliferating Eomeshi CD8+T cells remained significantly higher than that by Eomes‐/lo cells (P < 0.05) (Fig. 4a). Meanwhile, T‐bet expression was strongly upregulated by Eomeshi and Eomes‐/lo CD8+T cells after CD3/CD28 activation (Supporting Information Fig. 2). Next, we assessed the effector phenotype of CD8+T cells co‐expressing T‐bet and Eomes following allo‐stimulation (Fig. 4b). Proliferating EomeshiT‐bethi cells comprised the highest incidence of dual IFNγ and TNFα positive (IFNγ+TNFα+) cells, while proliferating Eomes‐/loT‐bet‐/lo cells comprised the lowest incidence of these cells. Notably, within the T‐bethi or T‐bet‐/lo populations, higher Eomes expression correlated with higher incidences of IFNγ+TNFα+ cells (P < 0.05). When total CD8+T cells (both proliferating and non‐proliferating) were evaluated, similar incidences of IFNγ+TNFα+ cells were observed (not shown). These findings suggest that, irrespective of T‐bet expression, higher Eomes expression by alloreactive human CD8+T cells correlates with an enhanced effector phenotype, even in the absence of proliferation.
Next, we evaluated the kinetics of Eomes and T‐bet expression by allo‐stimulated CD8+T cells. Following allo‐stimulation, proliferating (dividing) CD8+T cells exhibited significant increases in both Eomes and T‐bet expression (P < 0.01) after the first division, compared to non‐proliferating cells (division 0). While a gradual increase in T‐bet and Eomes expression was observed initially over the first 3 divisions, expression of both factors declined gradually with subsequent divisions (Fig. 5). These observations indicate that proliferation of CD8+T cells in response to allo‐stimulation is associated with a concomitant increase in Eomes and T‐bet expression.
Figure 5.
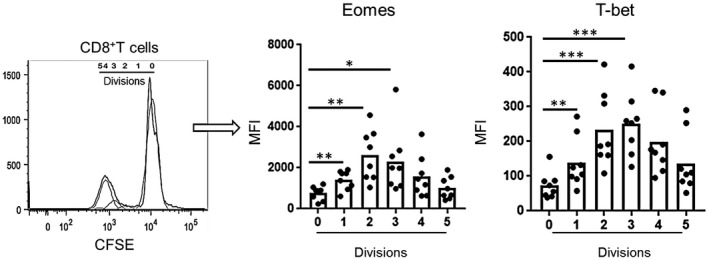
Eomes and T‐bet expression by proliferating CD8+T cells following allo‐stimulation in vitro. Divisions of CFSE‐labeled proliferating cells measured using flowjo software. Mean fluorescence intensity (MFI) of Eomes and T‐bet expression was evaluated for each division. The histogram (left) is from one representative individual coculture. Combined data from 8 individuals examined are shown (left). Wilcoxon‐Mann‐Whitney test; *P s< 0.05, **P < 0.01, ***P < 0.001.
Eomes and T‐bet co‐expression by donor stimulated CD8+T cells of kidney tx patients with no rejection
Next, we aimed to evaluate Eomes and T‐bet co‐expression in human renal allograft recipients with no rejection (Table 1). First, we evaluated the incidences of Eomes+CD8+T cells in patients before tx. No significant difference was observed in the intensity of Eomes expression (MFI), when compared to healthy controls (Supporting Information Fig. 3a). Similar to healthy volunteers, Eomeshi CD8+T cells comprised significantly higher incidences of T‐bet+ cells (P < 0.05) than Eomes‐/lo CD8+T cells (Supporting Information Fig. 3b). Following allo‐stimulation, within the proliferating T‐bet‐/lo or T‐bethi populations, higher Eomes expression also correlated with a higher incidence of IFNγ+TNFα+ cells (Supporting Information Fig. 3c). These data indicate that, in patients with end stage renal disease, the effector phenotype of Eomes+CD8+T cells is similar to that of healthy controls.
Next, we determined the kinetics of Eomes and T‐bet expression by donor (allo)‐ reactive CD8+T cells in renal allograft recipients with no rejection, before and after tx. In these experiments, proliferation of donor‐stimulated CD8+T cells was only observed in post‐tx samples obtained from 6/11 patients. In 5/11 patient samples, no proliferation of donor‐stimulated CD8+T cells was observed. Both proliferating and non‐proliferating Eomeshi CD8+T cells were similar in regards to their effector phenotype, i.e. the incidence of the IFNγ+TNFα+ cells (Supporting Information Fig. 1). Hence, total CD8+T cells were examined after coculture with donor cells (n = 11). EomeshiT‐bethi, EomeshiT‐bet‐/lo and Eomes‐/loT‐bethi CD8+T cell subsets were evaluated (Fig. 6a). In donor‐stimulated recipient CD8+T cells (Fig. 6b), no significant changes were observed in the incidence of the EomeshiT‐bethi subset after tx, compared with before tx. The EomeshiT‐bet‐/lo CD8+T cell subset was increased significantly 1 month (P < 0.05) and 3 months (P < 0.05) post‐tx, while the Eomes‐/loT‐bethi subset was reduced significantly (P < 0.05) 1 month after tx. In MLR experiments where proliferation was observed (6/11), proliferating CD8+T cells exhibited similar incidences of EomeshiT‐bethi, EomeshiT‐bet‐/lo and Eomes‐/loT‐bethi CD8+T cell subsets before and after tx (not shown).
Figure 6.
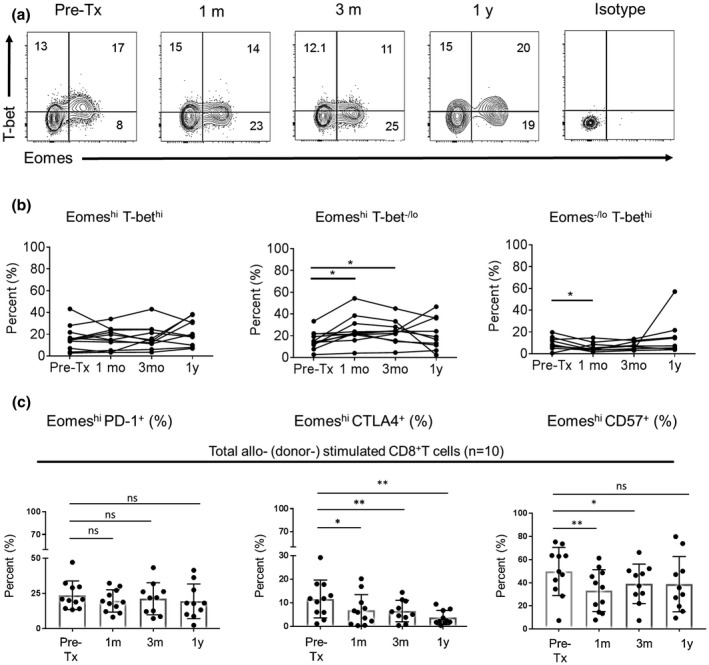
Pre‐ and post‐tx Eomes and T‐bet expression by donor‐stimulated CD8+T cells of kidney tx recipients with no rejection. (a) After co‐culture of recipient PBMC with donor PBMC, total CD8+T cells were evaluated for Eomes and T‐bet co‐expression. Dot plots are representative of one kidney tx recipient. (b) The percentages of EomeshiT‐bethi, EomeshiT‐bet‐/lo and Eomes‐/loT‐bethi subsets in total CD8+T cells were determined. Results are expressed as percentages of each subset. (c) Percentages of PD‐1+, CTLA4+ and CD57+ Eomeshi CD8+T cells following stimulation with donor cells. Wilcoxon‐Mann‐Whitney test; *P < 0.05, **P < 0.01.
Additionally, we evaluated Eomes and T‐bet expression (MFI) by CD8+T cells in renal allograft recipients with no rejection (n = 11) before and after stimulation with donor cells (Supporting Information Fig. 4a). In non‐stimulated CD8+T cells, Eomes expression was significantly higher at 1 month (P < 0.01), 3 months (P < 0.01) and 1 year (P < 0.05) post‐tx. By contrast, T‐bet expression was increased significantly only at 1 year (P < 0.05) post‐tx. Following stimulation with donor cells (Supporting Information Fig. 4b), total CD8+T cells exhibited significantly increased Eomes expression 1 month (P < 0.01), 3 months (P < 0.01) and 1 year (P < 0.05) post‐tx. By contrast, T‐bet expression was not increased.
To determine whether upregulation of Eomes expression was associated with exhaustion of donor‐stimulated CD8+T cells in patients with no rejection, we evaluated the expression of the exhaustion markers programmed death 1 (PD‐1) and cytotoxic T‐lymphocyte associated antigen 4 (CTLA4). Compared to before tx, donor‐stimulated CD8+T cells maintained similar levels of PD‐1 after tx. In contrast, there was a significant reduction in CTLA4 expression by donor‐stimulated CD8+T cells at 1 month (P < 0.05), 3 months (P < 0.01), and 1 year (P < 0.01) after tx. Furthermore, donor‐stimulated CD8+T cells exhibited significant reduction of the activation marker CD57 expression by donor‐stimulated CD8+T cells, at 1 month (P < 0.05) and 3 months (P < 0.01) after tx (Fig. 6c).
Pre‐tx Eomes and T‐bet co‐expression by donor‐stimulated CD8+T cells of kidney tx patients with or without subsequent rejection
PBMC were collected before tx from renal allograft recipients (Table 1) with either no subsequent rejection (n = 11), subclinical rejection (SCR; n = 5) or acute cellular rejection (ACR; n = 5). Pre‐tx recipient CD8+T cells were evaluated for EomeshiT‐bethi, EomeshiT‐bet‐/lo and Eomes‐/loT‐bethi CD8+T cell subsets following stimulation with donor cells. Samples from healthy volunteers served as controls (Fig. 7).
Figure 7.
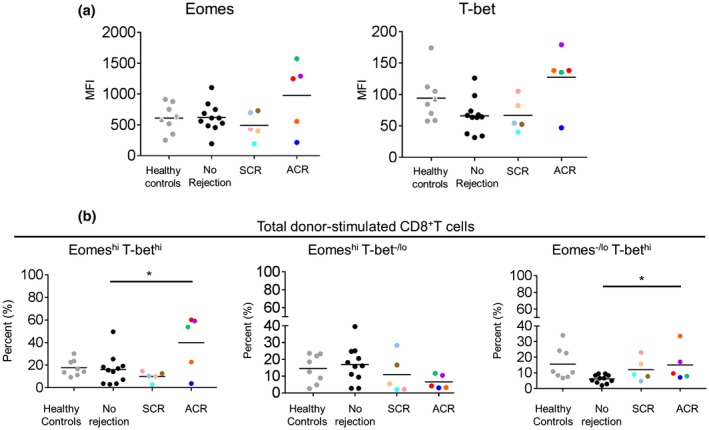
Pre‐tx Eomes and T‐bet expression by donor‐stimulated CD8+T cells of kidney tx recipients with or without subsequent rejection. PBMC were obtained before transplantation from kidney allograft recipients with no subsequent rejection (n = 11), subclinical rejection (SCR; n = 5) and acute cellular rejection (ACR; n = 5). Recipient PBMC were co‐cultured with donor PBMC for 7 days. After coculture, total CD8+T cells were evaluated for (a) Mean fluorescence intensity (MFI) of Eomes and T‐bet expression, and (b) for the incidences of EomeshiT‐bethi, EomeshiT‐bet‐/lo and Eomes‐/loT‐bethi subsets. Color coded dots correspond with the same patients in Table 1. Wilcoxon‐Mann‐Whitney test; *P < 0.05.
In patients with ACR, there was a trend towards higher Eomes and T‐bet expression (MFI) by donor‐stimulated CD8+T cells before transplantation compared to healthy controls, patients with no rejection, and patients with SCR (Fig. 7a). Meanwhile, the incidences of the EomeshiT‐bethi and Eomes‐/loT‐bethi subsets were significantly higher (P < 0.05), but the incidences of the EomeshiT‐bet‐/lo subset were lower in patients with ACR compared to those with no rejection (Fig. 7b).
Collectively, these data suggest that an increased incidence of donor‐reactive CD8+T cells co‐expressing high levels of Eomes and T‐bet before tx, may correlate with an increased incidence of ACR.
Discussion
Allo‐reactive Tmem constitute a major barrier to improved long‐term organ allograft survival 6, 30, 31, 32, where impairment of Tmem responses is crucial to attain Ag‐specific tolerance 9. T cell depletion is a common induction therapy in tx protocols. However, lymphodepletion leads to the generation of Tmem that are resistant to co‐stimulation blockade 14. Additionally, in rodents 7, 33 and nonhuman primate (NHP) 8 allo‐tx models, CD8+Tmem are known to mediate immunosuppression‐resistant allograft rejection.
The T‐box transcription factors Eomes and T‐bet, are considered master regulators of Ag‐specific CD8+ Tmem differentiation, function and survival 15, 16. Rodent studies have demonstrated the critical roles of both Eomes and T‐bet in long‐term survival of effector CD8+T cells. Reduced Eomes expression results in deficient long‐term Ag‐specific Tmem development and homeostatic renewal 17, whereas in chronic viral infection 23 both Eomes and T‐bet are essential for the maintenance of anti‐viral effector CD8+ T cell responses. In the latter study, Eomeshi virus‐specific CD8+T cells displayed enhanced cytotoxicity, despite expressing the T cell exhaustion markers B lymphocyte‐induced maturation protein‐1 (Blimp‐1) and PD‐1. These virus‐specific Eomeshi CD8+ T cells exhibited robust proliferation, but were associated with lower effector function, in contrast to T‐bethi CD8+T cells. Of importance, genetic deletion of either T‐bet+ or Eomes+ subsets results in failure of mice to control chronic viral infection 23, suggesting that both transcription factors are required for the maintenance of anti‐viral Tmem with effector function.
In humans, Eomes is highly expressed by CD8+ compared to CD4+ T cells 34, 35. In kidney tx patients with primary cytomegalovirus (CMV) infection 36, T‐bet and Eomes are upregulated in CMV‐specific CD8+T cells. In lung tx patients, 37, reduced T‐bet but not Eomes expression by CMV‐specific CD8+T cells is associated with reduced viral control and increased incidence of CMV relapse after tx. Meanwhile, the role of Eomes in the development and maintenance of allo‐ (donor‐) reactive Tmem in tx patients is not known. The present data show that, after CD8+T cell allo‐stimulation, two distinct populations of proliferating Eomeshi and Eomes‐/lo CD8+T cells can be identified. Importantly, irrespective of T‐bet expression, both proliferating and non‐proliferating CD8+T cells expressing high levels of Eomes demonstrated a stronger effector phenotype, compared to low Eomes‐expressing cells. Nevertheless, elevated co‐expression of Eomes and T‐bet by allo‐stimulated CD8+T cells correlated with the highest incidence of dual IFNγ+TNFα+ cells.
In tx patients with stable graft function, upregulation of Eomes, but not T‐bet, by donor‐stimulated CD8+T cells was observed at 1 and 3 months after tx. This was associated with maintained PD‐1 expression by donor‐stimulated Eomes+CD8+T cells after tx, compared to before tx, suggesting an exhausted phenotype as previously reported in patients with human immunodeficiency virus (HIV) infection 38. In contrast, CTLA4 expression by Eomes+CD8+T cells after tx was reduced significantly (Fig. 6c). Recently, using a NHP model 39, 40, we have shown that prolonged kidney allograft survival is associated with reduced Eomes, but increased CTLA4 expression by recipient donor‐reactive CD8+Tmem, which can be due to the immunoregulatory influence of regulatory dendritic cell infusion before tx, and/or different immunosuppressive regimen.
Higher incidences of T cells primed to produce high levels of IFNγ correlate directly with severity of rejection in human kidney tx 41, and increased incidences of ACR 42. Recently, use of donor‐specific IFNγ ELISPOT assays demonstrated that increased anti‐donor reactivity before tx, correlated with higher incidences of ACR 43, 44, while increased anti‐donor reactivity after tx was associated with increased incidences of SCR and subsequent development of anti‐donor HLA Abs 45. This supports earlier observations demonstrating the role of Th1 (T‐bet‐mediated) T cell responses in renal allograft rejection 24, 25. However, mounting evidence suggests that IFNγ can have immunoregulatory properties 46, 47, 48. Prolonged allograft survival using a co‐stimulation blockade‐based regimen is not achievable in IFNγ‐/‐ recipients 49, 50. Also, the Th1 transcription factor T‐bet is essential for regulatory T cell homeostasis and migration to sites of inflammation 51. These observations suggest that IFNγ expression alone cannot be linked directly to allograft rejection 52, 53. While Eomes and PD‐1 co‐expression correlates with exhausted virus‐specific CD8+T cells 38, co‐expression of Eomes and T‐bet by donor‐reactive CD8+T cells might prove to be a useful marker to determine the risk of T cell‐mediated rejection in kidney tx patients. Hence, in patients with subsequent ACR, the percentages of donor‐stimulated EomeshiT‐bethi CD8+T cells were higher before tx, compared to those with no subsequent rejection (Fig. 7).
Before tx, patients with subsequent ACR exhibited increased percentages of donor‐reactive CD8+T cells expressing significantly higher levels of T‐bet, i.e. EomeshiT‐bethi and Eomes‐/loT‐bethi. Also, the same group of patients exhibited lower percentages of donor‐reactive EomeshiT‐bet‐/lo CD8+T cells, although not significantly (Fig. 7). After tx, patients with subsequent stable graft function maintained low percentages of donor‐reactive EomeshiT‐bethi and Eomes‐/loT‐bethi CD8+T cells up to 1 year after tx (Fig. 6b). In reverse correlation, the percentages of donor‐reactive EomeshiT‐bet‐/lo CD8+T cells were significantly increased at 1 and 3 months after tx in the same group of patients. These observations suggest upregulation of Eomes expression by donor‐reactive CD8+T cells, without concomitant upregulation of T‐bet expression, may correlate with absence of anti‐donor reactivity early after tx and hence reduced incidence of acute cellular rejection. However, considering the potential role of Eomes in effector T cell development and maintenance, particularly in the absence of T‐bet‐mediated effector mechanisms, it is yet to be determined whether such observations correlate with long‐term stable graft function. Indeed, rodent data suggest that Eomes may compensate for the lack of T‐bet function to promote Th1‐driven allograft rejection 54. In this rodent model, adoptive transfer of allogeneic CD4+T cells deficient in both T‐bet and retinoid‐related orphan receptor (ROR) γt (the hallmark Th17 cell transcription factor) is associated with enhanced Eomes expression increased IFNγ production by the double‐deficient cells and enhanced skin allograft injury. This suggests that, under these conditions, Eomes may compensate for the lack of T‐bet function to drive Th1‐driven allograft rejection.
Continuous exposure of CD8+T cells to Ag results in the downregulation of T‐bet expression and upregulation of Eomes expression, associated with reduced cytokine production and increased PD‐1 expression, but enhanced cytotoxic function 23. In our study, patients with no rejection exhibited significantly higher Eomes expression after tx, but no changes in PD‐1 expression were observed (Fig. 6c). Additionally, this was associated with significant reduction in CTLA4 expression. Furthermore, CD57 expression by donor‐stimulated Eomes+CD8+T cells was reduced significantly only 1‐3 months after tx in patients with stable graft function (Fig. 6c). Of note, in patients with HIV infection, CD57+CD8+T cells with high Eomes expression correlate with better viral control 55. Accordingly, increased Eomes expression may not correlate with long‐term exhaustion of antigen‐specific CD8+T cells after tx 56, which may have implications for transplant outcome, as well as future therapeutic strategies, e.g. potential weaning of immunosuppression.
In conclusion, this is the first report, to our knowledge, that has examined Eomes and T‐bet co‐expression by allo‐reactive CD8+T cells of human healthy volunteers and of organ tx patients in response to donor Ag stimulation. Our study has revealed that high Eomes expression correlates with enhanced effector phenotype by allo‐stimulated CD8+T cells. Importantly, our data suggest that high Eomes and T‐bet co‐expression by donor‐reactive CD8+T cells before tx may correlate with cellular rejection. These findings provide new insight into allo‐reactive CD8+T cells in allograft recipients. It will now be important to conduct a long‐term follow‐up study involving a larger number of patients to further evaluate the significance of these findings.
Disclosure
The authors of this manuscript have no conflict of interest to disclose.
Supporting information
Fig. S1. Percentage of TNFα and INFγ double positive cells in proliferating and non‐proliferating human CD8+T cell populations after allo‐stimulation.
Fig. S2. T‐bet expression by Eomeshi and Eomes‐/lo human CD8+T cells following CD3/CD8 activation.
Fig. S3. T‐bet expression and function of Eomeshi and Eomes‐/lo human CD8+T cells in patients with end stage renal disease (ESRD) before transplantation.
Fig. S4. Eomes and T‐bet expression (MFI) by allo‐ (donor‐) stimulated CD8+T cells, before and after tx, in kidney tx recipients with no rejection.
Acknowledgements
This study was partly supported by National Institutes of Health (NIH) grant U01 AI51698, research funds from the Starzl Transplantation Institute and by the Thomas E. Starzl Transplantation Institute Fellowship in Clinical and Human Translational Research to A. P.‐G.
References
- 1. Shiao SL, McNiff JM, Pober JS. Memory T cells and their costimulators in human allograft injury. The Journal of Immunology. 2005;175:4886–96. [DOI] [PubMed] [Google Scholar]
- 2. Masopust D, Vezys V, Marzo AL, Lefrancois L. Preferential localization of effector memory cells in nonlymphoid tissue. Science. 2001;291:2413–7. [DOI] [PubMed] [Google Scholar]
- 3. Chalasani G, Dai Z, Konieczny BT, Baddoura FK, Lakkis FG. Recall and propagation of allospecific memory T cells independent of secondary lymphoid organs. Proceedings of the National Academy of Sciences of the United States of America. 2002;99:6175–80. [DOI] [PMC free article] [PubMed] [Google Scholar]
- 4. Yang J, Brook MO, Carvalho‐Gaspar M, et al. Allograft rejection mediated by memory T cells is resistant to regulation. Proceedings of the National Academy of Sciences of the United States of America. 2007;104:19954–9. [DOI] [PMC free article] [PubMed] [Google Scholar]
- 5. Lakkis FG, Sayegh MH. Memory T cells: a hurdle to immunologic tolerance. Journal of the American Society of Nephrology. 2003;14:2402–10. [DOI] [PubMed] [Google Scholar]
- 6. Valujskikh A, Li XC. Frontiers in nephrology: T cell memory as a barrier to transplant tolerance. Journal of the American Society of Nephrology. 2007;18:2252–61. [DOI] [PubMed] [Google Scholar]
- 7. Trambley J, Bingaman AW, Lin A, et al. Asialo GM1(+) CD8(+) T cells play a critical role in costimulation blockade‐resistant allograft rejection. J Clin Invest. 1999;104:1715–22. [DOI] [PMC free article] [PubMed] [Google Scholar]
- 8. Kitchens WH, Haridas D, Wagener ME, et al. Integrin antagonists prevent costimulatory blockade‐resistant transplant rejection by CD8(+) memory T cells. American Journal of Transplantation. 2012;12:69–80. [DOI] [PMC free article] [PubMed] [Google Scholar]
- 9. Adams AB, Williams MA, Jones TR, et al. Heterologous immunity provides a potent barrier to transplantation tolerance. J Clin Invest. 2003;111:1887–95. [DOI] [PMC free article] [PubMed] [Google Scholar]
- 10. Jones ND, Van Maurik A, Hara M, et al. CD40‐CD40 ligand‐independent activation of CD8+ T cells can trigger allograft rejection. The Journal of Immunology. 2000;165:1111–8. [DOI] [PubMed] [Google Scholar]
- 11. Zhai Y, Meng L, Gao F, Busuttil RW, Kupiec‐Weglinski JW. Allograft rejection by primed/memory CD8+ T cells is CD154 blockade resistant: therapeutic implications for sensitized transplant recipients. The Journal of Immunology. 2002;169:4667–73. [DOI] [PubMed] [Google Scholar]
- 12. Sener A, Tang AL, Farber DL. Memory T‐cell predominance following T‐cell depletional therapy derives from homeostatic expansion of naive T cells. American Journal of Transplantation. 2009;9:2615–23. [DOI] [PubMed] [Google Scholar]
- 13. Benichou G, Gonzalez B, Marino J, Ayasoufi K, Valujskikh A. Role of memory T cells in allograft rejection and tolerance. Frontiers in Immunology. 2017;8:170. [DOI] [PMC free article] [PubMed] [Google Scholar]
- 14. Wu Z, Bensinger SJ, Zhang J, et al. Homeostatic proliferation is a barrier to transplantation tolerance. Nature Medicine. 2004;10:87–92. [DOI] [PMC free article] [PubMed] [Google Scholar]
- 15. Pearce EL, Mullen AC, Martins GA, et al. Control of effector CD8+ T cell function by the transcription factor eomesodermin. Science. 2003;302:1041–3. [DOI] [PubMed] [Google Scholar]
- 16. Intlekofer AM, Takemoto N, Wherry EJ, et al. Effector and memory CD8+ T cell fate coupled by T‐bet and eomesodermin. Nature Immunology. 2005;6:1236–44. [DOI] [PubMed] [Google Scholar]
- 17. Banerjee A, Gordon SM, Intlekofer AM, et al. Cutting edge: the transcription factor eomesodermin enables CD8+ T cells to compete for the memory cell niche. The Journal of Immunology. 2010;185:4988–92. [DOI] [PMC free article] [PubMed] [Google Scholar]
- 18. Szabo SJ, Sullivan BM, Stemmann C, Satoskar AR, Sleckman BP, Glimcher LH. Distinct effects of T‐bet in TH1 lineage commitment and IFN‐gamma production in CD4 and CD8 T cells. Science. 2002;295:338–42. [DOI] [PubMed] [Google Scholar]
- 19. Cruz‐Guilloty F, Pipkin ME, Djuretic IM, et al. Runx3 and T‐box proteins cooperate to establish the transcriptional program of effector CTLs. Journal of Experimental Medicine. 2009;206:51–9. [DOI] [PMC free article] [PubMed] [Google Scholar]
- 20. Paley MA, Wherry EJ. TCF‐1 flips the switch on Eomes. Immunity. 2010;33:145–7. [DOI] [PubMed] [Google Scholar]
- 21. Kao C, Oestreich KJ, Paley MA, et al. Transcription factor T‐bet represses expression of the inhibitory receptor PD‐1 and sustains virus‐specific CD8+ T cell responses during chronic infection. Nature Immunology. 2011;12:663–71. [DOI] [PMC free article] [PubMed] [Google Scholar]
- 22. Doering TA, Crawford A, Angelosanto JM, Paley MA, Ziegler CG, Wherry EJ. Network analysis reveals centrally connected genes and pathways involved in CD8+ T cell exhaustion versus memory. Immunity. 2012;37:1130–44. [DOI] [PMC free article] [PubMed] [Google Scholar]
- 23. Paley MA, Kroy DC, Odorizzi PM, et al. Progenitor and terminal subsets of CD8+ T cells cooperate to contain chronic viral infection. Science. 2012;338:1220–5. [DOI] [PMC free article] [PubMed] [Google Scholar]
- 24. Homs S, Mansour H, Desvaux D, et al. Predominant Th1 and cytotoxic phenotype in biopsies from renal transplant recipients with transplant glomerulopathy. American Journal of Transplantation. 2009;9:1230–6. [DOI] [PubMed] [Google Scholar]
- 25. Sun Q, Cheng D, Zhang M, He Q, Chen Z, Liu Z. Predominance of intraglomerular T‐bet or GATA3 may determine mechanism of transplant rejection. Journal of the American Society of Nephrology. 2011;22:246–52. [DOI] [PMC free article] [PubMed] [Google Scholar]
- 26. Macedo C, Orkis EA, Popescu I, et al. Contribution of naive and memory T‐cell populations to the human alloimmune response. American Journal of Transplantation. 2009;9:2057–66. [DOI] [PubMed] [Google Scholar]
- 27. Pipkin ME, Sacks JA, Cruz‐Guilloty F, Lichtenheld MG, Bevan MJ, Rao A. Interleukin‐2 and inflammation induce distinct transcriptional programs that promote the differentiation of effector cytolytic T cells. Immunity. 2010;32:79–90. [DOI] [PMC free article] [PubMed] [Google Scholar]
- 28. Szabo SJ, Kim ST, Costa GL, Zhang X, Fathman CG, Glimcher LH. Pillars article: a novel transcription factor, T‐bet, directs Th1 lineage commitment. The Journal of Immunology. 2015;194:2961–75. [PubMed] [Google Scholar]
- 29. Szabo SJ, Kim ST, Costa GL, Zhang X, Fathman CG, Glimcher LH. A novel transcription factor, T‐bet, directs Th1 lineage commitment. Cell. 2000;100:655–69. [DOI] [PubMed] [Google Scholar]
- 30. Ford ML, Larsen CP. Overcoming the memory barrier in tolerance induction: molecular mimicry and functional heterogeneity among pathogen‐specific T‐cell populations. Curr Opin Organ Transplant. 2010;15:405–10. [DOI] [PMC free article] [PubMed] [Google Scholar]
- 31. Zeng YQ, Lu C, Dai Z. Editorial: Memory T cells: effectors, regulators, and implications for transplant tolerance. Frontiers in Immunology. 2016;7:7. [DOI] [PMC free article] [PubMed] [Google Scholar]
- 32. Nelsen MK, Beard KS, Plenter RJ, Kedl RM, Clambey ET, Gill RG. Disruption of transplant tolerance by an "incognito" form of CD8 T cell‐dependent memory. American Journal of Transplantation. 2017;17:1742–53. [DOI] [PMC free article] [PubMed] [Google Scholar]
- 33. Ferrari‐Lacraz S, Zheng XX, Kim YS, et al. An antagonist IL‐15/Fc protein prevents costimulation blockade‐resistant rejection. The Journal of Immunology. 2001;167:3478–85. [DOI] [PMC free article] [PubMed] [Google Scholar]
- 34. McLane LM, Banerjee PP, Cosma GL, et al. Differential localization of T‐bet and Eomes in CD8 T cell memory populations. The Journal of Immunology. 2013;190:3207–15. [DOI] [PMC free article] [PubMed] [Google Scholar]
- 35. Knox JJ, Cosma GL, Betts MR, McLane LM. Characterization of T‐bet and Eomes in peripheral human immune cells. Frontiers in Immunology. 2014;5:217. [DOI] [PMC free article] [PubMed] [Google Scholar]
- 36. Hertoghs KM, Moerland PD, van Stijn A, et al. Molecular profiling of cytomegalovirus‐induced human CD8+ T cell differentiation. J Clin Invest. 2010;120:4077–90. [DOI] [PMC free article] [PubMed] [Google Scholar]
- 37. Popescu I, Pipeling MR, Shah PD, Orens JB, McDyer JF. T‐bet: Eomes balance, effector function, and proliferation of cytomegalovirus‐specific CD8+ T cells during primary infection differentiates the capacity for durable immune control. The Journal of Immunology. 2014;193:5709–22. [DOI] [PMC free article] [PubMed] [Google Scholar]
- 38. Buggert M, Tauriainen J, Yamamoto T, et al. T‐bet and Eomes are differentially linked to the exhausted phenotype of CD8+ T cells in HIV infection. PLoS Path. 2014;10:e1004251. [DOI] [PMC free article] [PubMed] [Google Scholar]
- 39. Ezzelarab MB, Zahorchak AF, Lu L, et al. Regulatory dendritic cell infusion prolongs kidney allograft survival in nonhuman primates. American Journal of Transplantation. 2013;13:1989–2005. [DOI] [PMC free article] [PubMed] [Google Scholar]
- 40. Ezzelarab MB, Lu L, Guo H, et al. Eomesodermin(lo) CTLA4(hi) alloreactive CD8+ memory T cells are associated with prolonged renal transplant survival induced by regulatory dendritic cell infusion in CTLA4 immunoglobulin‐treated nonhuman primates. Transplantation. 2016;100:91–102. [DOI] [PMC free article] [PubMed] [Google Scholar]
- 41. D'Elios MM, Josien R, Manghetti M, et al. Predominant Th1 cell infiltration in acute rejection episodes of human kidney grafts. Kidney International. 1997;51:1876–84. [DOI] [PubMed] [Google Scholar]
- 42. Heeger PS, Greenspan NS, Kuhlenschmidt S, et al. Pretransplant frequency of donor‐specific, IFN‐gamma‐producing lymphocytes is a manifestation of immunologic memory and correlates with the risk of posttransplant rejection episodes. The Journal of Immunology. 1999;67:S220–75. [PubMed] [Google Scholar]
- 43. Bestard O, Crespo E, Stein M, et al. Cross‐validation of IFN‐gamma Elispot assay for measuring alloreactive memory/effector T cell responses in renal transplant recipients. American Journal of Transplantation. 2013;13:1880–90. [DOI] [PubMed] [Google Scholar]
- 44. Crespo E, Lucia M, Cruzado JM, et al. Pre‐transplant donor‐specific T‐cell alloreactivity is strongly associated with early acute cellular rejection in kidney transplant recipients not receiving T‐cell depleting induction therapy. PLoS One. 2015;10:e0117618. [DOI] [PMC free article] [PubMed] [Google Scholar]
- 45. Crespo E, Cravedi P, Martorell J, et al. Posttransplant peripheral blood donor‐specific interferon‐gamma enzyme‐linked immune spot assay differentiates risk of subclinical rejection and de novo donor‐specific alloantibodies in kidney transplant recipients. Kidney International. 2017;92:201–13. [DOI] [PMC free article] [PubMed] [Google Scholar]
- 46. Wood KJ, Sawitzki B. Interferon gamma: a crucial role in the function of induced regulatory T cells in vivo. Trends in Immunology. 2006;27:183–7. [DOI] [PubMed] [Google Scholar]
- 47. Sawitzki B, Kingsley CI, Oliveira V, Karim M, Herber M, Wood KJ. IFN‐gamma production by alloantigen‐reactive regulatory T cells is important for their regulatory function in vivo. Journal of Experimental Medicine. 2005;201:1925–35. [DOI] [PMC free article] [PubMed] [Google Scholar]
- 48. Kelchtermans H, De Klerck B, Mitera T, et al. Defective CD4+CD25+ regulatory T cell functioning in collagen‐induced arthritis: an important factor in pathogenesis, counter‐regulated by endogenous IFN‐gamma. Arthritis Research & Therapy. 2005;7:R402–15. [DOI] [PMC free article] [PubMed] [Google Scholar]
- 49. Konieczny BT, Dai Z, Elwood ET, et al. IFN‐gamma is critical for long‐term allograft survival induced by blocking the CD28 and CD40 ligand T cell costimulation pathways. The Journal of Immunology. 1998;160:2059–64. [PubMed] [Google Scholar]
- 50. Hassan AT, Dai Z, Konieczny BT, et al. Regulation of alloantigen‐mediated T‐cell proliferation by endogenous interferon‐gamma: implications for long‐term allograft acceptance. Transplantation. 1999;68:124–9. [DOI] [PubMed] [Google Scholar]
- 51. Koch MA, Tucker‐Heard G, Perdue NR, Killebrew JR, Urdahl KB, Campbell DJ. The transcription factor T‐bet controls regulatory T cell homeostasis and function during type 1 inflammation. Nature Immunology. 2009;10:595–602. [DOI] [PMC free article] [PubMed] [Google Scholar]
- 52. Nickerson P, Steurer W, Steiger J, Zheng X, Steele AW, Strom TB. Cytokines and the Th1/Th2 paradigm in transplantation. Current Opinion in Immunology. 1994;6:757–64. [DOI] [PubMed] [Google Scholar]
- 53. Strom TB, Roy‐Chaudhury P, Manfro R, et al. The Th1/Th2 paradigm and the allograft response. Current Opinion in Immunology. 1996;8:688–93. [DOI] [PubMed] [Google Scholar]
- 54. Sabet‐Baktach M, Eggenhofer E, Rovira J, et al. Double deficiency for RORgammat and T‐bet drives Th2‐mediated allograft rejection in mice. The Journal of Immunology. 2013;191:4440–6. [DOI] [PubMed] [Google Scholar]
- 55. Simonetta F, Hua S, Lecuroux C, et al. High eomesodermin expression among CD57+ CD8+ T cells identifies a CD8+ T cell subset associated with viral control during chronic human immunodeficiency virus infection. Journal of Virology. 2014;88:11861–71. [DOI] [PMC free article] [PubMed] [Google Scholar]
- 56. Sanchez‐Fueyo A, Markmann JF. Immune exhaustion and transplantation. American Journal of Transplantation. 2016;16:1953–7. [DOI] [PubMed] [Google Scholar]
Associated Data
This section collects any data citations, data availability statements, or supplementary materials included in this article.
Supplementary Materials
Fig. S1. Percentage of TNFα and INFγ double positive cells in proliferating and non‐proliferating human CD8+T cell populations after allo‐stimulation.
Fig. S2. T‐bet expression by Eomeshi and Eomes‐/lo human CD8+T cells following CD3/CD8 activation.
Fig. S3. T‐bet expression and function of Eomeshi and Eomes‐/lo human CD8+T cells in patients with end stage renal disease (ESRD) before transplantation.
Fig. S4. Eomes and T‐bet expression (MFI) by allo‐ (donor‐) stimulated CD8+T cells, before and after tx, in kidney tx recipients with no rejection.