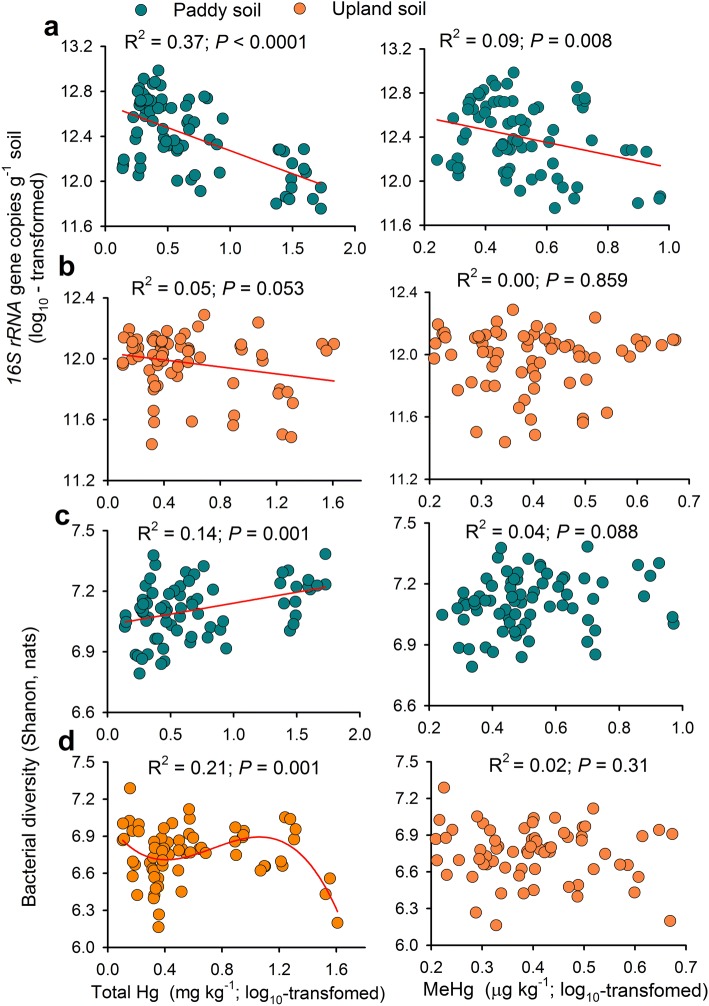
Fig. 1.
Relationships between soil mercury (Hg, including total Hg and methylmercury, MeHg) and the bacterial abundance (a, b), and diversity (c, d) in paddy and upland soils. Green and yellow dots represent samples from paddy and upland fields, respectively. Red lines represent regressions with linear (straight) and cubic (curve) functions (P < 0.05)

