Abstract
Native mass spectrometry detection of ligand-protein complexes allowed rapid detection of natural product binders of apo and calcium-bound S100A4 (a member of the metal binding protein S100 family), T cell/transmembrane, immunoglobulin (Ig), and mucin protein 3, and T cell immunoreceptor with Ig and ITIM (immunoreceptor tyrosine-based inhibitory motif) domains precursor protein from extracts and fractions. Based on molecular weight common hits were detected binding to all four proteins. Seven common hits were identified as apigenin 6-C-β-D-glucoside 8-C-α-L-arabinoside, sweroside, 4′,5-dihydroxy-7-methoxyflavanone-6-C-rutinoside, loganin acid, 6-C-glucosylnaringenin, biochanin A 7-O-rutinoside and quercetin 3-O-rutinoside. Mass guided isolation and NMR identification of hits confirmed the mass accuracy of the ligand in the ligand-protein MS complexes. Thus, molecular weight ID from ligand-protein complexes by electrospray ionization Fourier transform mass spectrometry allowed rapid dereplication. Native mass spectrometry using electrospray ionization Fourier transform mass spectrometry is a tool for dereplication and metabolomics analysis.
Keywords: dereplication, ligand-protein complex, metabolomics, molecular weight, native mass spectrometry
Introduction
Secondary metabolites from natural sources, such as plants, animals, and microorganisms, are evolved by natural selection and encoded to bind specific proteins to exert a wide range of biological functions [1]. The basis of natural product binding to proteins can be explained by the similarity of biosynthetic enzyme substrate interactions and protein-natural product interactions [2]. Natural products have embedded molecular recognition and can be considered as useful library components for screening against protein targets.
Natural product extracts and fractions were screened using electrospray ionization Fourier transform mass spectrometry (ESI-FTMS) for its ability to determine the accurate molecular weight of compounds binding to native state protein targets [3–5].
Extraction and fractionation, as previously reported, is an effective strategy to prepare a partially purified library of natural products in which all compounds are compliant to the partition coefficient (log P) criteria of Lipinski’s “rule of five” (RO5), i.e., all components have a log P < 5 [6, 7]. Solvent extraction used n-hexane, dichloromethane, and methanol. n-Hexane extracted highly lipophilic compounds, which were discarded. Dichloromethane and methanol extracts were combined and treated with polyamide gel (PAG) for plant extracts to remove tannins, and cross-linked poly(divinylbenzene-N-vinyl-pyrrolidone) copolymer (DVB3NVP) to recover the compounds with log P < 5 [6, 7]. Tannins are a group of plant secondary metabolites that have been found to show high affinity to proteins [8]. The extracts were fractionated by reverse-phase high-performance liquid chromatography (RP-HPLC) using a C18 column and a binary mobile phase of methanol and water plus 0.1% trifluoroacetic acid (TFA). RP-HPLC provided a secondary resolution of log P components [6, 7].
In this study, three proteins were investigated: 1) human (Homo sapiens) calcium-binding protein S100A4 in apo and calcium-bound states, 2) mouse (Mus musculus) TIM3, and 3) human TIGIT.
S100A4 is an important member of the S100 protein family. Apo S100A4 upon binding to calcium results in a conformational change, which allows the protein to interact with the downstream targets to produce a range of biological effects. The protein has no enzymatic activity. It interacts with other protein targets in intracellular, extracellular spaces, or in both compartments [9].
In normal state, S100A4 enhances cell proliferation and angiogenesis, and in cancer the protein plays the key role in tumor progression and metastasis, as it regulates migration and invasion. S100A4 is also overexpressed in several nonmalignant diseases such as tissue fibrosis, rheumatoid arthritis, psoriasis, brain damage, autoimmune diseases, and others. Thus, the S100A4 protein could become a promising biomarker for the early diagnosis of cancer metastasis and a possible therapeutic target of anticancer drug development. Though it is well known that S100A4 interacts with numerous proteins, it is necessary to regulate the interaction of S100A4 with other proteins and define the biological effects thereafter [9].
TIM3 is a receptor and preferentially expressed on helper T cell 1 (TH1). TIM3 is also expressed on tumor-associated dendritic cells (DCs), macrophages, and CD8+ T cells [10, 11]. TIM3 is a receptor for phosphatidylserine (PtdSer). TIM3 expressing cells respond to apoptotic cells through a TIM3/PtdSer interaction [12]. TIM3 impedes the positive effects of immunostimulatory nucleic acids in DCs. It is reported that administration of TIM3 monoclonal antibodies (mABs) and cisplatin can reduce the size of murine colorectal (MC38) synergistic tumors in mice. Like this, inhibition of TIM3 can be employed in combination with immunostimulatory nucleic acids to increase the success of anticancer treatment [10, 11, 13]. TIM3 negatively regulates T cells resulting development and progression of ovarian cancer cells [14]. It is overexpressed in prostate cancer [15]. Upon lipopolysaccharide stimulation, monocytes produce proinflammatory factors by the Tim3/galectin-9 pathway [16]. A recent report does not support a TIM3 and galectin-9 interaction in mediating immune responses [17]. CD4+ T cells in human tumors express TIM3 [18]. TIM3 expression can also be a prognostic marker in non-small cell lung cancer [19], ovarian cancer [14], and leukemia [20]. Inhibition of the TIM3 pathway might improve effectiveness of tumor vaccines [21].
TIGIT is a coinhibitory receptor containing an Ig variable domain, a transmembrane domain, and an Ig tail tyrosine. The protein is expressed by regulatory T cells (Tregs), activated T cells, and natural killer (NK) cells. TIGIT overexpression on CD8+ tumor infiltrating lymphocytes (TILs) and Tregs was reported in a several tumors and regulation of TIGIT expression showed therapeutic benefits in different tumors. Therefore, TIGIT is an important therapeutic target for tumor management [22].
TIGIT inhibits T cell activation by two ways: 1) directly by negative downstream signaling or 2) indirectly either by ligand competition or CD226 inhibition to arrest the positive costimulatory signal. TIGIT competes with CD226 to bind the poliovirus receptor (PVR) and poliovirus receptor-related 2 (PVRL2), which are involved in cell adhesion and motility on fibroblasts and endothelial cells. CD226 is a costimulatory molecule that is highly expressed on most immune cells and plays an important role, especially in T cell activation. PVR is highly expressed in various classes of tumor cells. Ras activation, toll-like receptors (TLR), ligand-activated antigen-presenting cells (APCs), and genotoxic chemicals can also induce the expression of PVR. The TIGIT and PVR interaction initiates bidirectional signalling and negatively regulates macrophages M2 polarization. Thus, TIGIT is a promising target for macrophage-mediated inflammatory diseases [23, 24].
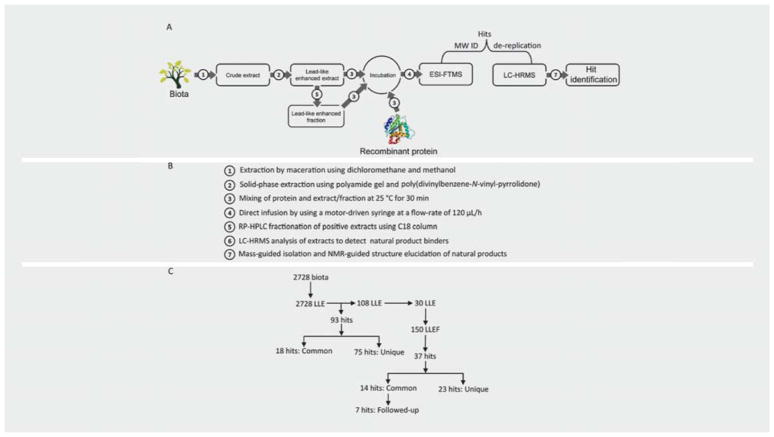
Natural products are secondary metabolites that are produced by common or unique biosynthetic pathways [25]. Hence, natural product extracts and fractions contain many common metabolites requiring dereplication strategies to identify commonly occurring compounds. Based on molecular weight, ESI-FTMS offered the possibility to identify common metabolites that may occur in different biota sources due to similar biosynthetic pathways [26]. Additionally, mass detection in ESI-FTMS allows mass-guided isolation of the compounds. The applicability of native mass spectrometry using ESI-FTMS to provide the molecular weight as a tool for dereplication is explored in this paper (Fig. 1).
Fig. 1.
Native MS screening and molecular weight identification work flow. The figure shows the diagram (A) of work flow, including seven different steps (B). Maceration and solid-phase extraction methods were used for the preparation of lead-like enhanced extract (LLE). A total of 93 hits were detected in 108 extracts, which showed binding to 4 proteins, including S100A4, Ca2+-S100A4, TIM3, and TIGIT (C). Thirty positive extracts were fractionated by RP-HPLC using a C18 column, and 150 lead-like enhanced fractions (LLEF) were screened against the proteins (C). In total, 37 hits were detected in the fractions (C). In fraction screening, the common hits showed binding to all four proteins. Seven common hits were selected for large-scale isolation and structure elucidation. The preliminary screening results were confirmed by ESI-FTMS screening of the pure compounds.
Results
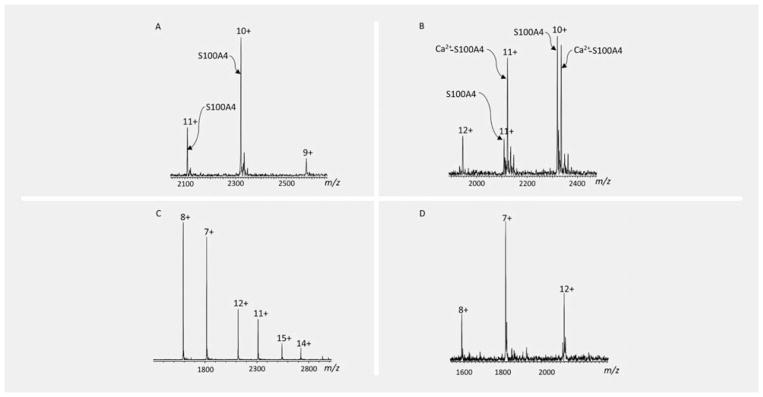
Positive ion native ESI-FTMS spectra of apo S100A4 showed a charge-state distribution (CSD) that ranges from 9+ (m/z = 2578.6) to 12+ (m/z = 1933.5). The 10+ ions (m/z = 2320.5) were the most abundant with the other three substantial ions, but lower abundances (Fig. 2A). Comparing the ESI-FTMS spectra of calcium-bound S100A4 (Ca2+-S100A4), when the CSD changes upon binding with calcium ions (Fig. 2B), an additional ionic species 12+ appeared (the most abundant). In the same instrumental conditions of spectra acquisition, the 9+ ions were not detected in the calcium-bound protein. The CSD of TIM3 included 7+, 8+, 11+, 12+, 14+, and 15+ ionic species, among which the 8+ ions were the most abundant (Fig. 2C). The CSD of TIGIT showed three ionic species: 7+ (the most abundant, m/z = 1815.7), 8+ (m/z = 1588.8), and 12+ (m/z = 2118.7) (Fig. 2D).
Fig. 2.
ESI-FTMS spectra of natively folded proteins acquired from a Bruker Apex III 4.7 Tesla mass spectrometer. The panels A, B, C, and D show the CSD of apo, calcium-bound S100A4, TIM3, and TIGIT, respectively.
A library of 2728 LLEs was generated from randomly selected biota including whole plants and different parts of the plants, such as bark, leaves, roots, twigs, and mixtures of different parts. Six-hundred and eighty-two extracts were screened against each protein. The molecular weight of the binders was calculated from the mass difference between the protein and complexes. Based on an LC-HRMS profile, seven common hits: NP_358 (natural product with molecular weight 358), NP_376, NP_434, NP_564, NP_592, NP_594, and NP_610 were followed up for large-scale isolation and structure elucidation. For mass-guided isolation, the biota powders were extracted by dichloromethane and methanol. In LC-LRMS analysis, it was observed that the methanol extracts of the biota contained the hits. Mass-guided isolation was followed by RP-HPLC using a C18 column. The chemical structures of the compounds were confirmed by NMR spectra (Supporting Information).
Based on the calculated molecular weight of the natural product binders, a total of 93 hits were detected in 108 extracts that were obtained from 57 genera. Eighteen common hits were detected in 73 extracts obtained from 37 genera. Ten common hits showed binding to S100A4, 11 hits to Ca2+-S100A4, 11 hits to TIM3, and 12 hits to TIGIT. Seventy-five unique hits were detected in 86 extracts obtained from 42 genera. Six unique hits were detected to bind to S100A4, 33 hits to Ca2+-S100A4, 19 hits to TIM3, and 17 hits to TIGIT. Thirty positive extracts were fractionated and five fractions were collected for each extract. A total of 150 fractions were screened and 37 hits were detected from 15 genera. Among them, 23 hits were obtained in the extracts plus 14 additional hits were detected in fractions. Fraction number 3 produced the highest number of hits (11 hits) and fraction number 5 showed the lowest (4 hits). Six hits were detected in fraction 1, 8 hits in fraction 2, and 8 hits were from fraction 4. Twenty-three unique hits were detected in 23 fractions obtained from 11 genera. Four unique hits were detected to bind to S100A4, 4 hits to Ca2+-S100A4, 7 hits to TIM3, and 8 hits to TIGIT. Fourteen common hits binding to all four proteins, i.e., nonselectives, were detected in 24 fractions from 12 genera (Table 1).
Table 1.
Classification of hits based on molecular weight of natural products.
| Source | Protein | Chemical subspace | ||||||
|---|---|---|---|---|---|---|---|---|
| Count | Genera | S100A4 | Ca2+-S100A4 | TIM3 | TIGIT | RO3 | RO5 | bRO5 |
| Screening of extracts | ||||||||
| Unique hits | ||||||||
| 75 | 42 | 6 | 33 | 19 | 17 | 15 | 40 | 35 |
| Common hits | ||||||||
| 18 | 37 | 10 | 11 | 11 | 12 | 1 | 6 | 12 |
| Screening of fractions | ||||||||
| Unique hits | ||||||||
| 23 | 11 | 4 | 4 | 7 | 5 | 1 | 14 | 9 |
| Common hits** | ||||||||
| 14 | 11 | – | 4 | 10 | ||||
In fraction screening, the common hits showed binding to all four proteins. The extracts were obtained from the biota including whole plant or different parts of the plant such as flowers, leaves, twigs, bark, or roots.
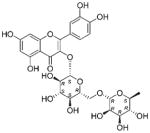
During screening, dilution of some extracts improved hit detection. For example, no complex was detected during the screening of TIM3 (15.8 μM, 98 μL) with an extract (2 μL) from Lysiana sp. (NB000130) at a concentration of 2.5 μge/μL. However, in a new injection with a diluted extract (0.25 μge/μL) with the same concentration of protein, protein peaks appeared with no changes in CSD, as the pure protein and a natural product binder, NP_610 (MW = 610), were detected to form a complex with the proteins (Fig. 3). Following mass-guided isolation and NMR structure elucidation, the compound was identified as quercetin 3-O-rutinoside. The binding of TIM3 and pure quercetin 3-O-rutinoside was confirmed by an ESI-FTMS experiment. Similarly, by dilution of extracts natural products NP_580, NP_408, NP_578, and NP_594 binding to S100A4 were detected during screening of extracts from Xylosma sp. (NB006263), Homalium sp. (NB032396), Xylosma sp. (NB022125), and Fagraea sp. (NB5320630), respectively.
Fig. 3.
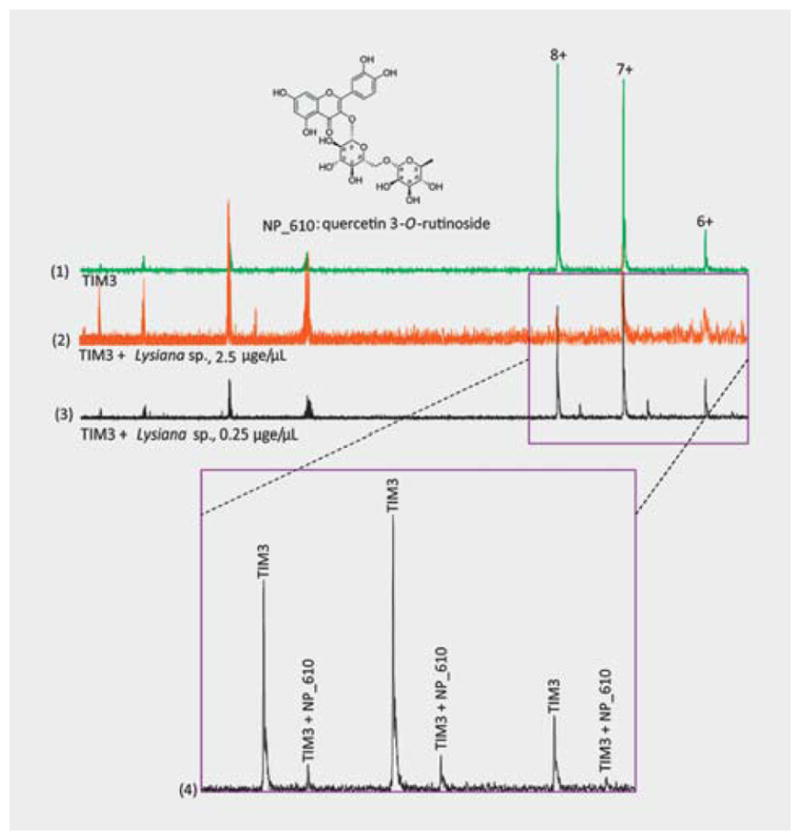
Hit detection in extract upon dilution. In (1), the figure shows the ESI-FTMS spectra of TIM3 at a concentration of 15.8 μM that was acquired by 32 scans at the 256 K mode. In (2), the spectrum was acquired for TIM3 plus an extract (at 2.5 μge/μL) from Lysiana sp. by applying the same experimental and instrumental conditions. No complex was observed in this spectrum. Upon dilution of the extract (at 0.25 μge/μL), a hit, NP_610, was detected to form a complex with the protein (3). From the spectra of (2) and (3), it was observed that in the diluted extract, the intensity of small molecular ions (at lower mass ranges) was decreased, while at the same time, the intensity of the protein and complexes was increased.
A comparative analysis of the results from extract and fraction screening showed that the hits identified from the extract screening were confirmed in fractions. Notably, additional hits were detected in the fractions. For example, a hit, NP_594 (Table 2), was detected in an extract from Fagreae sp. (NB5320562). During fraction screening, the binding of NP_594 was confirmed in fraction number 2 and an additional hit, NP_358 (Table 2), was detected in fraction number 1. A natural product binder of TIM3, NP_592 (Table 2), was detected in an extract from Daviesia sp. (NB001409), and binding of NP_592 to TIM3 was confirmed in fraction number 2 from Daviesia sp. (NB001409), while two additional hits, NP_434 (Table 2) and NP_610 (Table 2), were detected in that fraction (Fig. 4). These results demonstrated that probably reduction of the mixture size of the samples from extract to fraction improved protein-natural product interactions in the sample and thus increased hit detection.
Table 2.
Molecular weight ID of hits from different biota and their identified structures.
| Common hits | Biota | Structure | log P** | |||
|---|---|---|---|---|---|---|
| NatureBank ID* | Family | Genus | Plant Parts | |||
| NP_358 | NB5320562 | Gentianaceae | Fagraea sp. | Whole plant |

|
− 1.13 |
| NB009711 | Leeaceae | Leea sp. | Twigs | |||
| NP_376 | NB027889 | Grossulariaceae | Ribes sp. | Whole plant |
|
− 2.22 |
| NB016536 | Lamiaceae | Dicrastylis sp. | Twigs | |||
| NP_434 | NB001409 | Fabaceae | Daviesia sp. | Twigs |

|
0.08 |
| NB021038 | Euphorbiaceae | Baloghia sp. | Bark | |||
| NP_564 | NB001282 | Fabaceae | Desmodium sp. | Mixed parts |
|
− 2.54 |
| NB017090 | Euphorbiaceae | Aleurites sp. | Bark | |||
| NP_592 | NB026860 | Lamiaceae | Prostanthera sp. | Roots |

|
0.23 |
| NB012115 | Fabaceae | Swainsona sp. | Twigs | |||
| NB001409 | Fabaceae | Daviesia sp. | Twigs | |||
| NB008817 | Fabaceae | Daviesia sp. | Roots | |||
| NB5320562 | Gentianaceae | Fagraea sp. | Whole plant | |||
| NP_594 | NB000435 | Fabaceae | Rhynchosia sp. | Mixed parts |
|
− 0.50 |
| NB001423 | Fabaceae | Daviesia sp. | Bark | |||
| NB001409 | Fabaceae | Daviesia sp. | Twigs | |||
| NB5320630 | Gentianaceae | Fagraea sp. | Mixed parts | |||
| NB5320562 | Gentianaceae | Fagraea sp. | Whole plant | |||
| NP_610 | NB005751 | Flagellariaceae | Flagellaria sp. | Leaves |
|
− 2.41 |
| NB012151 | Fabaceae | Hovea sp. | Roots | |||
| NB022411 | Idiospermaceae | Idiospermum sp. | Bark | |||
| NB011891 | Loganiaceae | Logania sp. | Mixed parts | |||
| NB017441 | Loranthaceae | Diplatia sp. | Twigs | |||
| NB031656 | Lauraceae | Endiandra sp. | Whole plant | |||
| NB010078 | Loganiaceae | Mitrasacme sp. | Mixed parts | |||
| NB6000880 | Lauraceae | Lindera sp. | Whole plant | |||
| NB000130 | Loganiaceae | Lysiana sp. | Mixed parts | |||
The specimen was identified by the experts in Queensland herbarium and stored. The detail of the specimens is available in the NatureBank database.
The log P of the compounds was predicted based on a modified version of the method of Viswanadhan et al. [42].
Fig. 4.
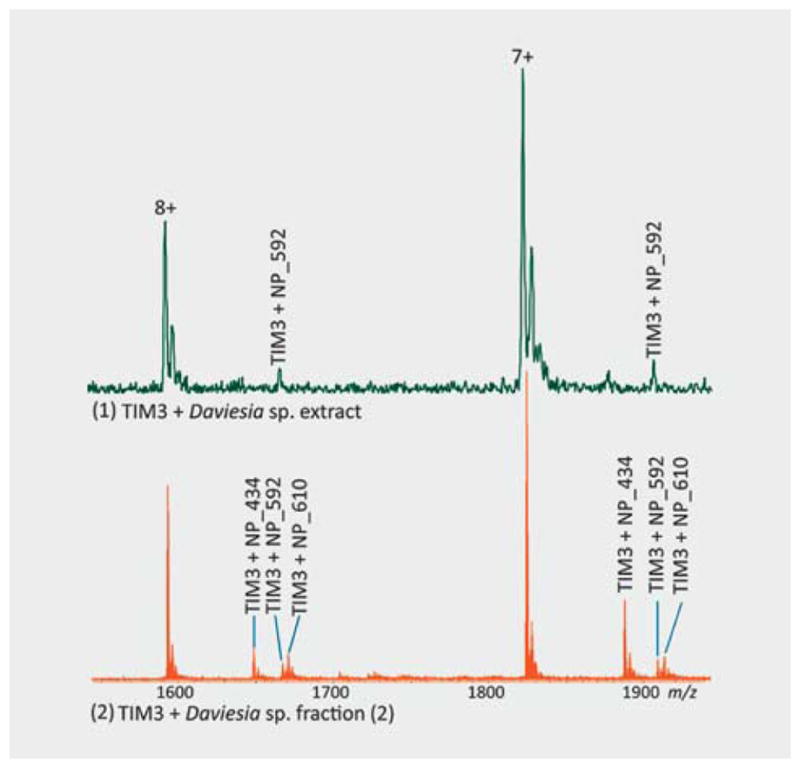
Additional hit detection in the fraction. In (1), the figure shows a hit, NP_592, was detected in the extract of Daviesia sp. and in (2), two additional hits, NP_434 and NP_610, were detected in fraction number 2.
During the screening of extracts and fractions, highly intense complexes were observed with the ions corresponding to the most abundant ions in the protein spectra. In some cases, the binding of natural products altered the CSD of the proteins. The CSD of TIM3 was observed as 8+, 7+, and 6+ in the protein spectrum. Fifteen hits were detected in all the three charge states. Five hits were detected in 7+ and 6+ charge states. Ten hits were detected in 8+ and 7+ charge states and only two hits were detected in the 8+ charge state (Fig. 5). A similar effect was observed with other proteins as well.
Fig. 5.
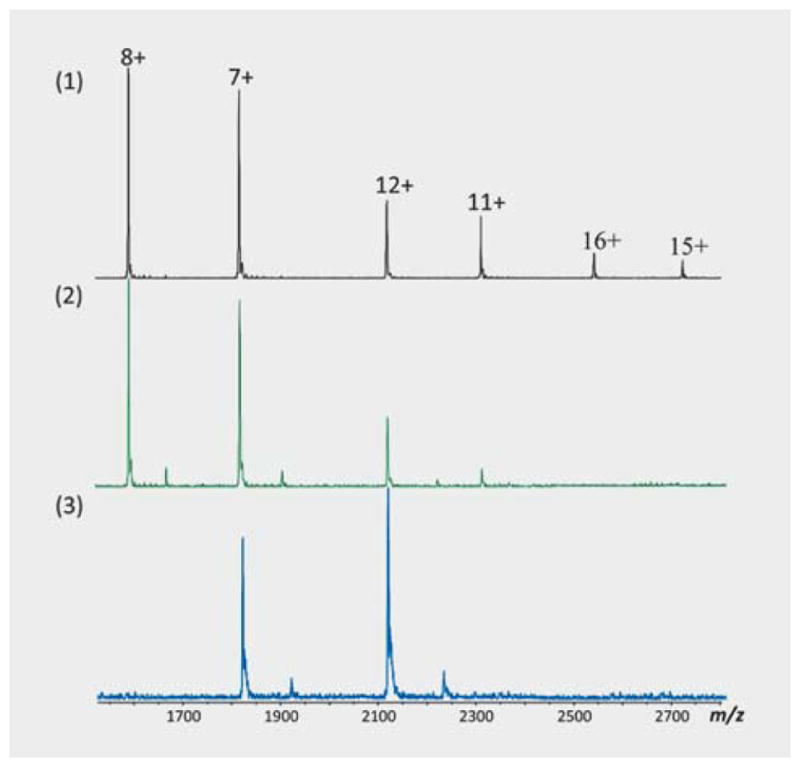
Alteration of charge-state distribution of protein-natural product complexes in gas-phase ions. In (1), the figure shows the protein (TIM3) spectrum at a concentration of 15.8 μM, acquired by 16 scans. The binding of NP_610 from Endiandra sp. (NB5250851) to TIM3 changed the CSD of the protein (2) due to less protonation; 15+ and 16+ ionic species were not observed. In (3), the binding of NP_624 from Lysiana sp. to TIM3 brought remarkable changes in CSD for both the protein and protein-NP_624 complexes; only 7+ and 12+ ions were observed.
The ions that corresponded to the 1: 1 complexes of natural products (P: L) with the proteins were considered specific bindings and the ions that corresponded to the 1:n (n > 1) complexes were considered nonspecific bindings [27]. In most cases, specific protein-natural product binding was observed (Fig. 6). Only specific binding was counted as a hit.
Fig. 6.
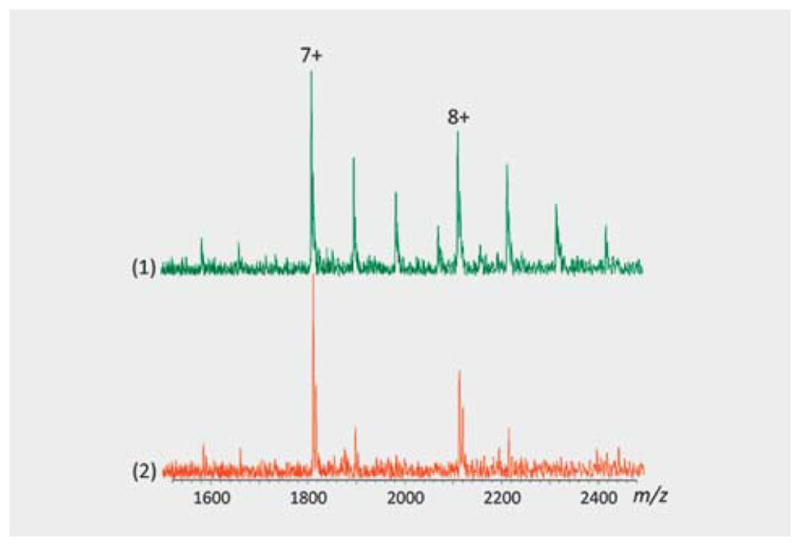
Specific and nonspecific protein-natural product interactions. In (1), the figure shows the nonspecific binding of NP_610 to TIGIT (13.8 μM), where the partially purified fraction was incubated at a concentration of 2.5 μg/μL. In the second spectrum (2), the fraction was diluted ten-fold and specific binding was observed. Thus, the specific and nonspecific interactions were distinguished.
From an analysis of taxonomical classes of positive biota, it was observed that some common hits were detected in extracts obtained from the biota with similar taxonomical classes (Fig. 4S, Supporting Information). This can be explained by the similar primary and secondary metabolism of plants from different species. Plants produce secondary metabolites to survive in the environment. Secondary metabolism of plants is also related to primary metabolism and building blocks. Similar or same compounds produced in different species may be due to similar biosynthetic pathways and for common purposes [28]. Hence, it is anticipated that a common hit from different biota is probably the same compound.
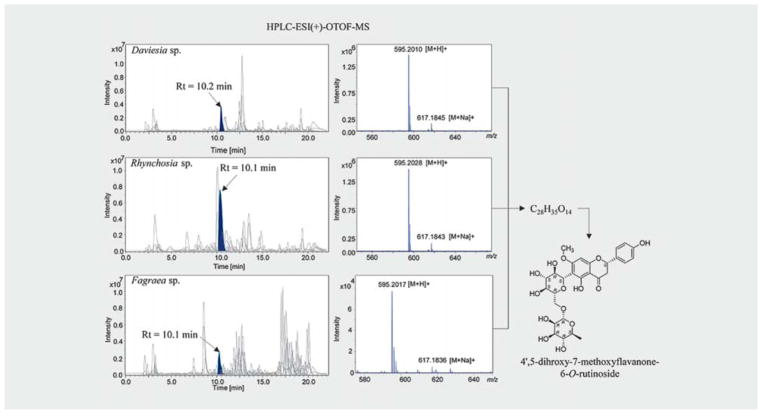
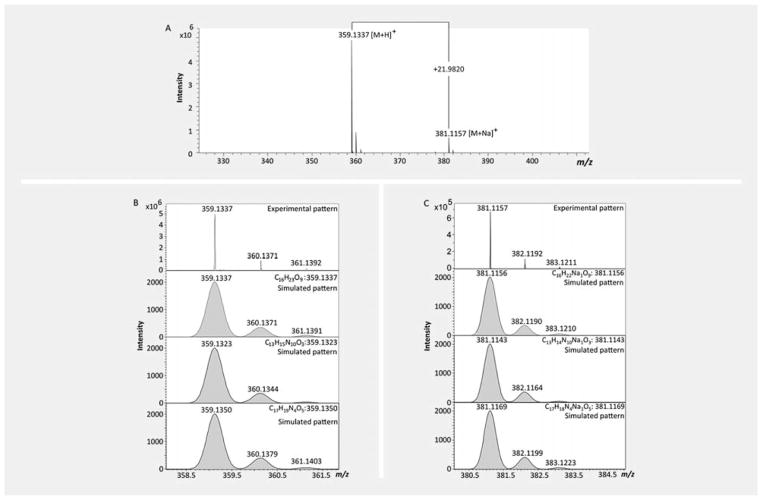
An additional LC-HRMS analysis of the extracts showed that the common hits from different biota showed a similar or the same retention time in a C18 column (Fig. 7). From the molecular formula of the hits predicted from high-resolution MS spectrum using “SmartFormula” in Bruker DataAnalysis software, it was observed that the common hits from different biota have the same molecular formula (Fig. 8). Full scan mass spectra on maXis II OTOF provided exact mass values (m/z) for the plant metabolites with a mass accuracy of 5 ppm. MS signals of lower intensity allowed for the characterization of the observed ions as [M + H]+ and sodium adducts [M + Na]+. First, 30 sum formula suggestions were calculated using the 5 ppm mass accuracy windows, allowing only C, H, N, and O as elements (Table 3). Then, the suggested formulas were evaluated by rating the results according to the matching of experimental and theoretical isotope patterns. The suggested formulas were evaluated by rating the results according to the matching of experimental and theoretical isotope patterns (Fig. 9).
Fig. 7.
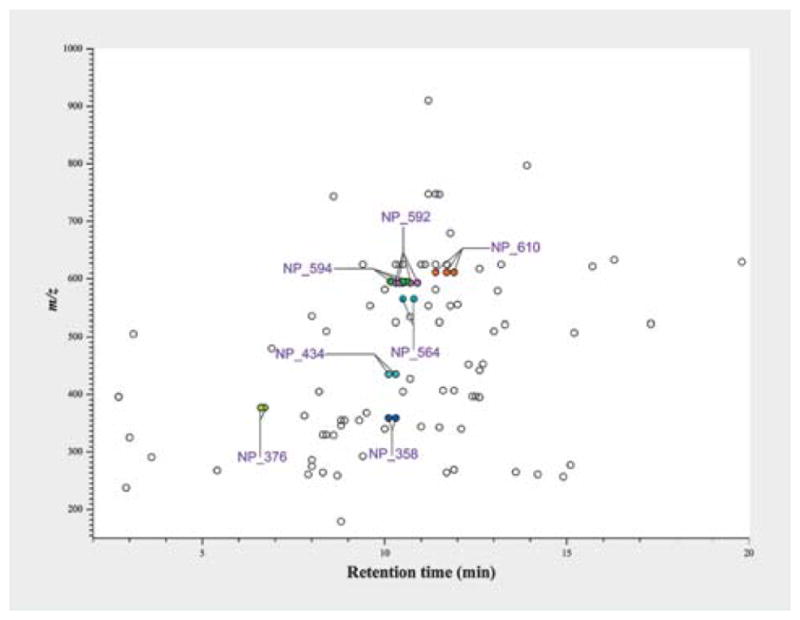
LC-HRMS profile hits. The m/z values of the compounds were plotted against their retention time in C18 column. The plot shows that the common hits have similar retention time.
Fig. 8.
Example of a common hit from different biota with a similar retention time (Rt). Liquid chromatography analysis of the extracts showed that NP_594, from Daviesia sp., Rhynchosia sp., and Faraea sp., has similar retention time. From high-resolution MS spectra, the molecular formula of NP_594 ([M + H]+) was predicted as C28H35O14, which was confirmed by NMR structure elucidation of the compound.
Table 3.
Predicted molecular formula of NP_358 from true isotopic distribution.
| Meas. m/z | Ion Formula | Cal. m/z | err (ppm) | mSigma | # mSigma | Score | rdb | ē Conf | N-Rule |
|---|---|---|---|---|---|---|---|---|---|
| 359.1337 [M + H]+ | C16H23O9 | 359.1337 | − 0.1 | 1.8 | 1 | 100 | 5.5 | even | ok |
| C13H15N10O3 | 359.1323 | − 3.8 | 5.4 | 2 | 46.92 | 11.5 | even | ok | |
| C17H19N4O5 | 359.1350 | 3.7 | 14.2 | 3 | 41.07 | 10.5 | even | ok | |
| 381.1157 [M + Na]+ | C14H17N6O7 | 381.1153 | − 0.9 | 2 | 1 | 100 | 9.5 | even | ok |
| C11H9N16O | 381.114 | − 4.4 | 5.1 | 2 | 43.88 | 15.5 | even | ok | |
| C15H13N10O3 | 381.1167 | 2.7 | 13.7 | 3 | 57.08 | 14.5 | even | ok |
Meas. m/z = measured m/z value, Formula = sum formula, Score = score of the formula (a value between 0 and 100%), Cal. m/z = calculated m/z of the formula, err (ppm) = deviation between measured mass and theoretical mass of the selected peak in ppm, mSigma = sigma is a rate for the agreement of the theoretical and measured isotopic pattern of the mass peak of interest. It combines the standard deviation of the masses and intensities for all isotopic peaks. The values are given in milliSigma and lower numbers indicate a better fit, rdb = number of rings and double bonds in the formula, ē Conf = the electron configuration, even or odd and N-Rule indicates whether the nitrogen rule is fulfilled.
Fig. 9.
Molecular formula prediction and isotopic distribution match. In A, the high-resolution MS spectrum is showing the molecular ion of NP_358 (m/z = 359.1337) and its sodium adduct (m/z = 381.1157). In B, the isotope pattern match is exemplified by the experimental and simulated isotope pattern of the ions.
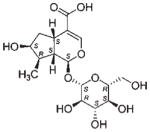
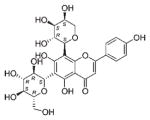
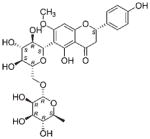
The common hit, NP_358, isolated from Fagraea sp. and Leea sp., was identified as sweroside [29, 30]. NP_376, isolated from Ribes sp. and Dicrastylis sp., was identified as loganin acid [31]. NP_434, isolated from Baloghia sp. and Daviesia sp., was identified as 6-C-glucosylnaringenin [32–34]. NP_564, isolated from Desmodium sp. and Aleurites sp., was identified as schaftoside [35, 36]. NP_592, isolated from Daviesia sp., Fagraea sp., Swainsona sp., and Plectranthus sp., was identified as biochanin A 7-O-rutinoside [37]. NP_594, isolated from Daviesia sp., Rhynchosia sp., and Fagraea sp., was identified as 4′,5-dihydroxy-7-methoxyflavanone-6-C-rutinoside [32, 33, 38]. NP_610, isolated from Flagellaria sp., Hovea sp., Idiospermum sp., Logania sp., Diplatia sp., Lauraceae sp., Mitrasacme sp., Endiandra sp., and Lysiana sp., was identified as quercetin 3-O-rutinoside [39–41]. The structures of the compounds, their biological sources and log P values are given in Table 2.
Pure compounds were retested in the same experimental conditions as for screening to validate the preliminary screening results. The seven compounds (common hits) showed nonselective binding to the four proteins, which was consistent with the preliminary screening results.
Discussion
The results shown here highlight the strengths and advantages of ESI-FTMS screening to detect hits from complex extracts and partially purified fractions for dereplication purposes. Chemical structure determination and mass analysis of the natural product binders demonstrated the mass accuracy of the ESI-FTMS hit detection. Confirmation of the binding of pure compounds to the proteins validated the preliminary screening results. The molecular weight knowledge of natural product binders was an advantage in the isolation and chemical structure determination. Based on the molecular weight of the hits, the compounds were classified into lead-like (molecular weight < 300 Da), drug-like (molecular weight < 500 Da), and compounds bRO5 (Table 1). The lead-like compounds also comply with the molecular weight criteria of fragment-like compounds (RO3). Thus, the hits with a molecular weight < 300 Da can be taken into fragment-based drug discovery. Doak and colleagues [43], in a review on orally bioavailable drugs and clinical candidates bRO5, showed that the major oral bRO5 class originated from natural products. Hits with a molecular weight > 500 Da can be used as chemical probes to study natural product-protein binding, such as identification of binding sites and binding mode analysis and identification of important functional group(s) of the compounds that are the major contributors in binding with proteins. This data can be used in structure-based drug design.
The presence of common hits in multiple biota can be explained by the similar primary and secondary metabolism in plants, which involve similar biosynthetic pathways, and are produced for common purposes [28]. Following mass-guided isolation and NMR structure elucidation, it was observed that a common hit from different species was the same compound. In LC-HRMS analysis, the common hits showed a similar or the same retention time. A molecular formula analysis method was applied for dereplication purposes. Predicted molecular formulas were validated by NMR-guided structure elucidation. Interestingly, the common hits are all glycosides (Table 2). In plants, glycoside biosynthesis follows two major pathways, the shikimic acid pathway and the phenylalanine pathway [44]. The plant species with common secondary metabolites may have common biosynthetic pathways to produce the same compound.
The preliminary screening results shown here highlight the strengths and advantages of native mass spectrometry using electrospray ionization to analyze natural product libraries. Molecular weight ID identifies common binders. Native mass spectrometry using ESI is a tool for dereplication and metabolomics analysis.
Materials and Methods
Chemicals
Ammonium acetate (Fluka) buffer solution was prepared in Milli-Q-water (Millipore). NAP-5 disposable columns (GE healthcare) were used for the protein buffer exchange. Ubiquitin was purchased from Thermo Fisher Scientific. HPLC grade acetonitrile, di-chloromethane, methanol, and formic acid were purchased from Honeywell.
Proteins
The recombinant proteins, human calcium-binding protein S100A4, mouse TIM3, and human TIGIT were expressed in and purified from Escherichia coli as described previously [45–47]. The purified proteins were stored in a buffer solution containing 2-amino-2-hydroxymethyl-propane-1, 3-diol (TRIS), 2-(4-(2-hydroxyethyl) piperazin-1-yl) ethane sulfonic acid (HEPES), 3,3′, 3″-phosphanetriyltripropanoic acid (TCEP), sodium chloride (NaCl), ethylenediaminetetraacetic acid (EDTA), or sodium azide (NaN3) at a pH 7.0. Both apo and calcium-bound S100A4 (Ca2+-S100A4) were used for analysis. For ESI-FTMS screening, the proteins were buffer exchanged into 10 mM ammonium acetate solution at pH 6.8. The amino acid sequences of the proteins are given in Table 1S, Supporting Information. A UV visible spectrometer (V-630-BIO-spectrophotometer) was used to determine protein concentration. The ExPASy ProtPram tool was used for calculation of the extinction coefficient of the proteins by assuming all pairs of Cys residues are from cysteines. The optimum screening concentration of the proteins was determined by serial dilution, and the concentration that produced the base peak around 3 000 000.000 (absolute intensity) was used to incubate with extracts and fractions (Table 2S, Supporting Information).
Biota
NatureBank housed at the Griffith Institute for Drug Discovery (www.griffith.edu.au/gridd) is a collection of over 63 000 biota samples from plants and marine invertebrates collected from tropical Queensland, Tasmania, China, Malaysia, and Papua New Guinea. A total of 2728 plant biota were randomly selected to screen against the proteins.
Preparation of lead-like enhanced extracts and fractions
Freeze-dried powder biota (300 mg) were extracted using an automated SPE system (Gilson Aspec). First, the biota powders were sequentially extracted using 11 mL of n-hexane (discarded), 13 mL of dichloromethane (DCM), and 12 mL of methanol (MeOH). The crude DCM and MeOH extracts were combined and treated with polyamide gel (PAG) and cross-linked poly(divinyl-benzene-N-vinyl-pyrrolidone) copolymer (DVB3NVP) to prepare the LLE. The biota, PAG, and DVB3NVP were packed into empty SPE cartridges (Phenomenex). A Waters HPLC system equipped with a Gilson fraction collector was used to prepare LLEFs. LLEs were dissolved in DMSO and fractionated by a reverse-phase column (C18, 4.6 mm × 100 mm, 5 μm; Phenomenex). A binary mobile phase of methanol-water plus 0.1% trifluroacetic acid was used, and five fractions were collected by gradient elution (Table 3S, Supporting Information).
Native MS screening of extracts and fractions
For incubation of proteins with extracts or fractions, 96-well PCR plates (BioCentrix) were used. Bruker electrospray ionization mass spectrometers, Apex III 4.7 Tesla, and SolariX 12 Tesla equipped with an external Apollo ESI source were used for the direct screening of extracts and fractions by applying the positive ionization mode. For Apex III 4.7 Tesla, mass spectra were recorded with a mass range from 50 to 6000 m/z for a broad band low-resolution acquisition. A Bruker Xmass data acquisition station and Xmass data analysis software (version 5.10) were used for data acquisition and analysis, respectively. For SolariX 12 Tesla, mass spectra were recorded with a mass range from 300 to 10 000 m/z for the high-resolution acquisition. Bruker Compass SolariX software (ftms Control), version 2.0, was used to control the instrument and data acquisition. Bruker DataAnalysis software, version 4.3, was used to analyze the spectra.
Optimization of electrospray ionization Fourier transform mass spectrometry
A Bruker SolariX 12 Tesla mass spectrometer was optimized based on the default method suggested by Bruker, while the Apex III 4.7 Tesla was optimized based on previous work [48]. The optimum conditions for critical instrumental parameters for Apex III 4.7 Tesla and SolariX 12 Tesla are summarized in Tables 4S and 5S, Supporting Information, respectively). For mass calibration, ubiquitin was used as a reference standard to generate accurate m/z values and subsequent calibration of the quadrupole mass analyzers in both linear and nonlinear curve fittings. The calibrant was prepared at a concentration of 2 × 10⁻¹³ in a solution of acetonitrile: water: formic acid (50: 50: 0.1, v/v). For curve fitting, CSD of denatured ubiquitin was compared with the Bruker reference dataset.
Screening strategy
A one extract-protein strategy was used to screen 2728 LLEs against the proteins. In this screening, 17.5 μM of S100A4/Ca2+-S100A4 (monomer concentration), 15.8 μM of TIM3, and 13.8 μM of TIGIT were used. An aliquot of 100 μL protein was mixed with extracts for 30 min at 25 °C. Each sample was directly injected into the ESI using a motor-driven syringe at a flow rate of 120 μL/h. To identify hits, the sample (protein plus extract) spectra were compared with the protein spectrum (control). The molecular weights of the binders were calculated from the mass difference between the protein and complexes. One-hundred and fifty fractions from 30 positive extracts (150 = 30 × 5) were screened against all four proteins. For fraction screening, 50 μL of protein was used.
LC-HRMS analysis of extracts
The positive extracts were analyzed by LC-HRMS. Bruker Compass Hystar software was used for the configuring and coupling of an Agilent HPLC (1100 series) to a Bruker Maxis II OTOF mass spectrometer. A binary mobile phase of methanol and water plus 0.1% of formic acid and a reverse-phase C18 column (250 × 4.6 mm, 5 μm) were used. Thirty microliters of extract solution at a concentration of 250 μg/μL was injected per sample. A standard mix of uracil, benzophenone, methyl 4-hydroxybenzoate, and ethyl 4-hydroxybenzoate was used to observe the column performance. To reduce cross contamination, a blank solution (methanol/water, 50/50) was used after each five samples. The same mobile phase and gradient method were used for the standard mix, extract, and blank solution. For extract analysis, the positive electrospray ionization mode was applied with a mass range of detection from 50 to 1300 m/z. For data acquisition and MS control, Bruker otofControl 4.0 was used. The method of LC-HRMS and optimum instrumental conditions for the ESI source and MS tune parameters are provided in Tables 6S and 7S, Supporting Information.
Molecular formula analysis of hits
Bruker Compass DataAnalysis software, version 4.3, was used to analyze the LC-HRMS data. In the HR3MS spectra, natural product binders were detected as parent ions ([M + H]n+) corresponding to the molecular weights detected during native MS screening. The molecular formula of the compounds was predicted by using “SmartFormula”. The charge on the molecular ions of natural product binders was determined by deconvolution. Considering the isotope pattern information, the number of meaningful suggestions was reduced to about 10. The details of charge deconvolution and molecular formula analysis are described in the Supporting Information.
Large-scale isolation and structure determination of hits
For large-scale isolation of the selected hits, 10 g of freeze-dried biota powders were extracted sequentially using n-hexane (250 × 2 mL), DCM (250 × 3 mL), and MeOH (250 × 3 mL). In the LC-LRMS analysis, DCM and MeOH extracts using a Waters ZQ system revealed that the MeOH extracts from the biota contained the binders. Both positive and negative electrospray ionization modes were used. For LC-LRMS analysis of extracts, a C18 column (100 × 2 mm, 3 μm) and a binary mobile phase of methanol and water plus 0.1% (v/v) formic acid at a flow rate of 1 mL/min were used. The detailed method of LC-LRMS of extracts is described in Table 8S, Supporting Information.
RP-HPLC fractionation was used for mass-guided isolation and to purify the natural product binders. NP_358 (natural product with a molecular weight of 358 Da), NP_376, NP_434, NP_564, NP_592 NP_594, and NP_610 were isolated from methanol extracts of the biota. For structure elucidation, 1D and 2D NMR spectra of the compounds were recorded on a Bruker 800 MHz spectrometer with CryoProbe by applying standard parameters of spectra acquisition at 25 °C. Bruker NMR tubes (outer diameter 5 mm/3 mm) were used for sample preparation using dimethyl sulfoxide-d6 and pyridine-d5. For sample handling, the high-throughput robot system SampleJet was used, which was controlled by the Bruker software IconNMR. Standard parameters were applied for the acquisition of NMR spectra. To analyze NMR spectra, TopSpin and MestReNova software were used. To confirm the structures, experimental NMR data were compared with the reported literature data. The NMR spectra of the compounds are available in Figs. 5S–37S, Supporting Information.
Confirmation of hits
The proteins were prepared in 10 mM aqueous ammonium acetate buffer at a concentration of 17.5 μM of S100A4/Ca2+-S100A4, 15.8 μM of TIM3, and 13.8 μM of TIGIT. Purified natural product binders, NP_358 (natural product with a molecular weight of 358 Da), NP_376, NP_434, NP_564, NP_592, NP_594, and NP_610 were incubated with the proteins at a molar concentration ratio ([P]:[L]) of 1: 2. The same instrumental conditions of screening were applied to investigate protein and pure compound binding.
Supplementary Material
Acknowledgments
The authors thank the Australian Research Council for partial funding of 4.7 and 12 Tesla mass spectrometers (ARC LIEF LE0237908, LE20100170). We gratefully acknowledge access to the NatureBank (biota samples and extracts) housed at the Griffith Institute for Drug Discovery (www.griffith.edu.au/gridd). A. K. acknowledges Griffith University for providing the Griffith University International Postgraduate Research Scholarship, Griffith University Postgraduate Research Scholarship, and School of Natural Sciences Postgraduate Research Scholarship.
ABBREVIATIONS
- apo
inactive or unbound state of protein
- bRO5
beyond the rule of five
- CD
cluster of differentiation
- CSD
charge-state distribution
- DCs
dendritic cells
- DVB-NVP
cross-linked poly(divinylbenzene-N-vinyl-pyrrolidone) copolymer
- ESI-FTMS
electrospray ionization Fourier transform mass spectrometry
- ID
identity
- LC-HRMS
liquid chromatography high-resolution mass spectrometry
- LC-LRMS
liquid chromatography low resolution mass spectrometry
- Ig
immunoglobulin
- ITIM
immunoreceptor tyrosine-based inhibitory motif
- LLE
lead-like enhanced extract
- LLEF
lead-like enhanced fraction
- mABs
monoclonal antibodies
- NK
natural killer
- NMR
nuclear magnetic resonance
- NP
natural product
- PAG
polyamide gel
- PVR
poliovirus receptor
- PVRL2
poliovirus receptor-related 2
- PtdSer
phosphatidylserine
- RP-HPLC
reverse-phase high-performance liquid chromatography
- RO3
rule of three
- RO5
rule of five
- S100A4
a member of the metal-binding protein S100 family
- SPE
solid-phase extraction
- TFA
trifluoroacetic acid
- TH 1
helper T cell 1
- TIM
T cell/transmembrane, Ig, and mucin
- TIM3
T cell/transmembrane, Ig, and mucin protein 3
- TIGIT
T cell immunoreceptor with Ig and ITIM domains precursor protein
- Tregs
regulatory T cells
Footnotes
Conflict of Interest
The authors declare no conflict of interest.
Supporting information available online at http://www.thieme-connect.de/products
Hit detection and molecular weight determination of hits during native MS screening, the strategy for classification of the hits, detailed information of common hits and their biota sources, NMR spectra of the isolated common hits NP_358, NP_376, NP_434, NP_592, NP_564, NP_594, and NP_610, amino acid sequences of human S100A4 and TIGIT and mouse TIM3 proteins that were used for this project, determination of optimum screening concentrations of the proteins, gradient methods (timetable) for LLEF preparation, LC-LRMS and LC–HRMS analysis of extracts/fractions, optimum screening conditions of critical instrumental parameters, and the charge deconvolution method are available as Supporting Information.
References
- 1.Williams DH, Stone MJ, Hauck PR, Rahman SK. Why are secondary metabolites (natural products) biosynthesized? J Nat Prod. 1989;52:1189–1208. doi: 10.1021/np50066a001. [DOI] [PubMed] [Google Scholar]
- 2.Kellenberger E, Hofmann A, Quinn RJ. Similar interactions of natural products with biosynthetic enzymes and therapeutic targets could explain why nature produces such a large proportion of existing drugs. Nat Prod Rep. 2011;28:1483–1492. doi: 10.1039/c1np00026h. [DOI] [PubMed] [Google Scholar]
- 3.Marshall AG, Hendrickson CL, Jackson GS. Fourier transform ion cyclotron resonance mass spectrometry: a primer. Mass Spectrom Rev. 1998;17:1–35. doi: 10.1002/(SICI)1098-2787(1998)17:1<1::AID-MAS1>3.0.CO;2-K. [DOI] [PubMed] [Google Scholar]
- 4.Pramanik BN, Bartner PL, Mirza UA, Liu YH, Ganguly AK. Electrospray ionization mass spectrometry for the study of non-covalent complexes: an emerging technology. J Mass Spectrom. 1998;33:911–920. doi: 10.1002/(SICI)1096-9888(1998100)33:10<911::AID-JMS737>3.0.CO;2-5. [DOI] [PubMed] [Google Scholar]
- 5.Banerjee S, Mazumdar S. Electrospray ionization mass spectrometry: a technique to access the information beyond the molecular weight of the analyte. Int J Anal Chem. 2012;2012:282574. doi: 10.1155/2012/282574. [DOI] [PMC free article] [PubMed] [Google Scholar]
- 6.Camp D, Davis RA, Campitelli M, Ebdon J, Quinn RJ. Drug-like properties: guiding principles for the design of natural product libraries. J Nat Prod. 2011;75:72–81. doi: 10.1021/np200687v. [DOI] [PubMed] [Google Scholar]
- 7.Camp D, Campitelli M, Carroll AR, Davis RA, Quinn RJ. Front-loading natural-product-screening libraries for log P: background, development, and implementation. Chem Biodiver. 2013;10:524–537. doi: 10.1002/cbdv.201200302. [DOI] [PubMed] [Google Scholar]
- 8.Collins R, Ng T, Fong W, Wan C, Yeung H. Removal of polyphenolic compounds from aqueous plant extracts using polyamide minicolumns. IUBMB Life. 1998;45:791–796. doi: 10.1080/15216549800203212. [DOI] [PubMed] [Google Scholar]
- 9.Fei F, Qu J, Zhang M, Li Y, Zhang S. S100A4 in cancer progression and metastasis: a systematic review. Oncotarget. 2017;8:73219. doi: 10.18632/oncotarget.18016. [DOI] [PMC free article] [PubMed] [Google Scholar]
- 10.DeKruyff RH, Bu X, Ballesteros A, Santiago C, Chim YL, Lee HH, Karisola P, Pichavant M, Kaplan GG, Umetsu DT, Freeman GJ, Casasnovas JM. T cell/transmembrane, Ig, and mucin-3 allelic variants differentially recognize phosphatidylserine and mediate phagocytosis of apoptotic cells. J Immunol. 2010;84:1918–1930. doi: 10.4049/jimmunol.0903059. [DOI] [PMC free article] [PubMed] [Google Scholar]
- 11.Lee J, Phong B, Egloff AM, Kane LP. TIM polymorphisms – genetics and function. Genes Immun. 2011;12:595–604. doi: 10.1038/gene.2011.75. [DOI] [PMC free article] [PubMed] [Google Scholar]
- 12.Bu X, Ballesteros A, Chim YL, Santiago C, Lee HH, Umetsu D, Casasnovas J, DeKruyff R, Freeman G. TIM33 is a receptor for phosphatidylserine and allelic variants differentially mediate uptake of apoptotic cells. J Immunol. 2010;184:130–141. doi: 10.4049/jimmunol.0903059. [DOI] [PMC free article] [PubMed] [Google Scholar]
- 13.Chiba S, Baghdadi M, Akiba H, Yoshiyama H, Kinoshita I, Dosaka-Akita H, Fujioka Y, Ohba Y, Gorman JV, Colgan JD, Hirashima M, Uede T, Takaoka A, Yagita H, Jinushi M. Tumor-infiltrating DCs suppress nucleic acid-mediated innate immune responses through interactions between the receptor TIM33 and the alarmin HMGB1. Nat Immunol. 2012;13:832–842. doi: 10.1038/ni.2376. [DOI] [PMC free article] [PubMed] [Google Scholar]
- 14.Wu J, Liu C, Qian S, Hou H. The expression of Tim-3 in peripheral blood of ovarian cancer. DNA Cell Biol. 2013;32:648–653. doi: 10.1089/dna.2013.2116. [DOI] [PubMed] [Google Scholar]
- 15.Piao YR, Piao LZ, Zhu LH, Jin ZH, Dong XZ. Prognostic value of T cell immunoglobulin mucin-3 in prostate cancer. Asian Pac J Cancer Prev. 2013;14:3897–3901. doi: 10.7314/apjcp.2013.14.6.3897. [DOI] [PubMed] [Google Scholar]
- 16.Gao X, Li C, Pan X, Li L, Fu J, Yao W. Expression and significance of Tim-3 on peripheral blood monocytes in patients with chronic hepatitis B. Chinese J Cell Mol Immunol. 2013;29:739–743. [PubMed] [Google Scholar]
- 17.Leitner J, Rieger A, Pickl WF, Zlabinger G, Grabmeier-Pfistershammer K, Steinberger P. TIM33 does not act as a receptor for galectin-9. PLoS Pathog. 2013;9:e1003253. doi: 10.1371/journal.ppat.1003253. [DOI] [PMC free article] [PubMed] [Google Scholar]
- 18.Yan J, Zhang Y, Zhang JP, Liang J, Li L, Zheng L. Tim-3 expression defines regulatory T cells in human tumors. PLoS One. 2013;8:e58006. doi: 10.1371/journal.pone.0058006. [DOI] [PMC free article] [PubMed] [Google Scholar]
- 19.Bai J, Li X, Tong D, Shi W, Song H, Li Q. T-cell immunoglobulin- and mucin-domain-containing molecule 3 gene polymorphisms and prognosis of non-small-cell lung cancer. Tumor Biol. 2013;34:805–809. doi: 10.1007/s13277-012-0610-1. [DOI] [PubMed] [Google Scholar]
- 20.Roth CG, Garner K, Eyck ST, Boyiadzis M, Kane LP, Craig FE. TIM3 expression by leukemic and non-leukemic myeloblasts. Cytometry B Clin Cytom. 2013;84:167–172. doi: 10.1002/cyto.b.21080. [DOI] [PubMed] [Google Scholar]
- 21.Lee MJ, Woo MY, Heo YM, Kim JS, Kwon MH, Kim K, Park S. The inhibition of the T-cell immunoglobulin and mucin domain 3 (Tim3) pathway enhances the efficacy of tumor vaccine. Biochem Biophys Res Commun. 2010;402:88–93. doi: 10.1016/j.bbrc.2010.09.121. [DOI] [PubMed] [Google Scholar]
- 22.Liu XG, Hou M, Liu Y. TIGIT, a novel therapeutic target for tumor immunotherapy. Immunol Invest. 2017;46:172–182. doi: 10.1080/08820139.2016.1237524. [DOI] [PubMed] [Google Scholar]
- 23.Chen X, Lu PH, Liu L, Fang ZM, Duan W, Liu ZL, Wang CY, Zhou P, Yu XF, He WT. TIGIT negatively regulates inflammation by altering macrophage phenotype. Immunobiology. 2016;221:48–55. doi: 10.1016/j.imbio.2015.08.003. [DOI] [PubMed] [Google Scholar]
- 24.Lozano E, Dominguez-Villar M, Kuchroo V, Hafler DA. The TIGIT/CD226 axis regulates human T cell function. J Immunol. 2012;188:3869–3875. doi: 10.4049/jimmunol.1103627. [DOI] [PMC free article] [PubMed] [Google Scholar]
- 25.Gutzeit HO, Ludwig-Müller J. Plant natural Products: Synthesis, biological Functions and practical Applications. Weinheim: John Wiley & Sons; 2014. [Google Scholar]
- 26.Cseke LJ, Kirakosyan A, Kaufman PB, Warber S, Duke JA, Brielmann HL. Natural Products from Plants. Boca Raton: CRC Press; 2016. [Google Scholar]
- 27.Ockey DA, Dotson JL, Struble ME, Stults JT, Bourell JH, Clark KR, Gadek TR. Structure-activity relationships by mass spectrometry: identification of novel MMP33 inhibitors. Bioorganic Med Chem. 2004;12:37–44. doi: 10.1016/j.bmc.2003.10.053. [DOI] [PubMed] [Google Scholar]
- 28.Seigler DS. Plant secondary Metabolism. Norwell: Springer Science & Business Media; 2012. [Google Scholar]
- 29.Cambie RC, Lal AR, Rickard CE, Tanaka N. Chemistry of Fijian plants. V.: Constituents of Fagraea gracilipes A. Gray Chem Pharm Bull. 1990;38:1857–1861. [Google Scholar]
- 30.Zhou Y, Di YT, Gesang S, Peng SL, Ding LS. Secoiridoid glycosides from Swertia mileensis. Helv Chim Acta. 2006;89:94–102. [Google Scholar]
- 31.Calis I, Lahloub MF, Sticher O. Loganin, loganic acid and periclymenoside, a new biosidic ester iridoid glucoside from Lonicera periclymenum L. (Caprifoliaceae) Helv Chim Acta. 1984;67:160–165. [Google Scholar]
- 32.Hammami S, Jannet HB, Bergaoui A, Ciavatta L, Cimino G, Mighri Z. Isolation and structure elucidation of a flavanone, a flavanone glycoside and vomifoliol from Echiochilon fruticosum growing in Tunisia. Molecules. 2004;9:602–608. doi: 10.3390/90700602. [DOI] [PMC free article] [PubMed] [Google Scholar]
- 33.Kang TH, Jeong SJ, Ko WG, Kim NY, Lee BH, Inagaki M, Miyamoto T, Higuchi R, Kim YC. Cytotoxic lavandulyl flavanones from Sophora flavescens. J Nat Prod. 2000;63:680–681. doi: 10.1021/np990567x. [DOI] [PubMed] [Google Scholar]
- 34.Singh V, Yadav B, Pandey V. Flavanone glycosides from Alhagi pseudalhagi. Phytochemistry. 1999;51:587–590. doi: 10.1016/s0031-9422(99)00010-2. [DOI] [PubMed] [Google Scholar]
- 35.Siewek F, Herrmann K, Grotjahn L, Wray V. Isomeric di-C-glycosylflavones in fig (Ficus carica L.) Z Naturforsch C. 1985;40:8–12. [Google Scholar]
- 36.Xie C, Veitch NC, Houghton PJ, Simmonds MS. Flavone C-glycosides from Viola yedoensis Makino. Chem Pharm Bull. 2003;51:1204–1207. doi: 10.1248/cpb.51.1204. [DOI] [PubMed] [Google Scholar]
- 37.Silva VCDA, Carvalho MGDE, Silva LDC. Chemical constituents from roots of Andira anthelmia (Legumonosae) Rev Latinoam Quím. 2007;35:13–19. [Google Scholar]
- 38.Maltese F, Erkelens C, van der Kooy F, Choi YH, Verpoorte R. Identification of natural epimeric flavanone glycosides by NMR spectroscopy. Food Chem. 2009;116:575–579. [Google Scholar]
- 39.Lallemand J, Duteil M. 13C nmr spectra of quercetin and rutin. Magn Reson Chem. 1977;9:179–180. [Google Scholar]
- 40.Moon BH, Lee YS, Shin CS, Lim YH. Complete assignments of the 1H and 13C NMR data of flavone derivatives. Bull Korean Chem Soc. 2005;26:603–608. [Google Scholar]
- 41.Napolitano JG, Lankin DC, Chen SN, Pauli GF. Complete 1HNMR spectral analysis of ten chemical markers of Ginkgo biloba. Magn Reson Chem. 2012;50:569–575. doi: 10.1002/mrc.3829. [DOI] [PMC free article] [PubMed] [Google Scholar]
- 42.Viswanadhan VN, Ghose AK, Revankar GR, Robins RK. Atomic physico-chemical parameters for three dimensional structure directed quantitative structure-activity relationships. J Chem Inf Comput Sci. 1989;29:163–172. doi: 10.1021/ci00053a005. [DOI] [PubMed] [Google Scholar]
- 43.Doak BC, Over B, Giordanetto F, Kihlberg J. Oral druggable space beyond the rule of 5: insights from drugs and clinical candidates. Chem Biol. 2014;21:1115–1142. doi: 10.1016/j.chembiol.2014.08.013. [DOI] [PubMed] [Google Scholar]
- 44.Kar A. Pharmacognosy and Pharmacobiotechnology. New Delhi: New Age International; 2003. [Google Scholar]
- 45.House RP, Pozzuto M, Patel P, Dulyaninova NG, Li ZH, Zencheck WD, Vitolo MI, Weber DJ, Bresnick AR. Two functional S100A4 monomers are necessary for regulating nonmuscle myosin-IIA and HCT116 cell invasion. Biochemistry. 2011;50:6920–6932. doi: 10.1021/bi200498q. [DOI] [PMC free article] [PubMed] [Google Scholar]
- 46.DeKruyff RH, Bu X, Ballesteros A, Santiago C, Chim YL, Lee HH, Karisola P, Pichavant M, Kaplan GG, Umetsu DT. T cell/transmembrane, Ig, and mucin-3 allelic variants differentially recognize phosphatidylserine and mediate phagocytosis of apoptotic cells. J Immunol. 2010;184:1918–1930. doi: 10.4049/jimmunol.0903059. [DOI] [PMC free article] [PubMed] [Google Scholar]
- 47.Stengel KF, Harden-Bowles K, Yu X, Rouge L, Yin J, Comps-Agrar L, Wiesmann C, Bazan JF, Eaton DL, Grogan JL. Structure of TIGIT immunoreceptor bound to poliovirus receptor reveals a cell-cell adhesion and signaling mechanism that requires cis-trans receptor clustering. Proc Natl Acad Sci U S A. 2012;109:5399–5404. doi: 10.1073/pnas.1120606109. [DOI] [PMC free article] [PubMed] [Google Scholar]
- 48.Yang B, Feng YJ, Vu H, McCormick B, Rowley J, Pedro L, Crowther GJ, Van Voorhis WC, Forster PI, Quinn RJ. Bioaffinity mass spectrometry screening. J Biomol Screen. 2016;21:194–200. doi: 10.1177/1087057115622605. [DOI] [PubMed] [Google Scholar]
Associated Data
This section collects any data citations, data availability statements, or supplementary materials included in this article.


