

Summary
The Hippo pathway plays a crucial role in organ size control and tumor suppression, but its precise regulation has not been fully understood. In this study, we discovered phosphatidic acid (PA)-related lipid signaling as a key regulator of the Hippo pathway. Supplementing PA in various Hippo-activating conditions activates YAP. This PA-related lipid signaling is involved in the Rho-mediated YAP activation. Mechanistically, PA directly interacts with Hippo components LATS and NF2 to respectively disrupt the LATS-MOB1 complex formation and NF2-mediated LATS membrane translocation and activation. Inhibition of phospholipase D (PLD)-dependent PA production suppresses YAP oncogenic activities. PLD1 is highly expressed in breast cancer and positively correlates with YAP activation, suggesting their pathological relevance in breast cancer development. Taken together, our study not only reveals a role of PLD-PA lipid signaling in regulation of the Hippo pathway, but also indicates the PLD-PA-YAP axis as a potential therapeutic target for cancer treatment.
Keywords: Phosphatidic acid, Hippo, LATS, NF2, MOB1, YAP, Rho, Phospholipase D
eTOC Blurb
Han et al. report phosphatidic acid (PA)-related lipid signaling as a key regulator of the Hippo pathway. PA directly binds Hippo pathway components LATS and NF2, and respectively inhibits the LATS-MOB1 complex formation and the NF2-mediated LATS membrane translocation and activation, thereby inhibiting Hippo signaling.
Graphical Abstract
Introduction
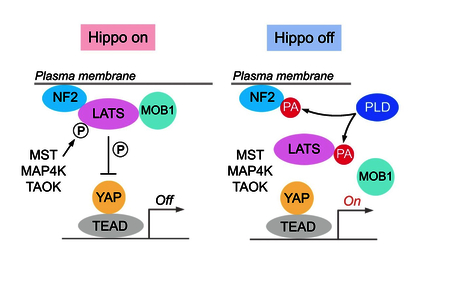
The Hippo pathway, which was initially identified in Drosophila, is evolutionally conserved and functions in diverse cellular processes. It constrains organ size by inducing programmed cell death and restricting excessive cell growth, both of which are critical properties for tumor suppression (Halder and Johnson, 2011; Pan, 2010; Piccolo et al., 2014; Yu and Guan, 2013; Yu et al., 2015a; Zanconato et al., 2016). The mammalian Hippo pathway is composed of core kinases (MST1/2 and LATS1/2), adaptor proteins (SAV1 for MST1/2 and MOB1 for LATS1/2), downstream effectors (YAP and its analog protein TAZ) and nuclear transcriptional factors (TEAD1–4). MST1/2 phosphorylate and activate LATS1/2, which in turn phosphorylate YAP/TAZ to create the docking sites for 14–3-3 proteins. 14–3-3 binding sequesters YAP/TAZ in the cytoplasm and inhibits their transactivation activities in the nucleus. When the Hippo pathway is inactivated, the unphosphorylated YAP/TAZ translocate into the nucleus, associate with TEAD1–4, and initiate the transcription of genes involved in multiple cellular functions.
Studies from both genetically engineered mouse models and cell line-based gene inactivation suggest the LATS1/2-mediated YAP/TAZ phosphorylation and inhibition as the major outputs of the Hippo pathway (Moroishi et al., 2016; Plouffe et al., 2016; Yi et al., 2016). Depletion of LATS1/2 fully abolished YAP phosphorylation and retained YAP in the nucleus (Plouffe et al., 2016). However, the physiological regulation of LATS1/2 remains largely unknown.
In parallel to MST1/2, members from MAP4K and TAOK families can directly phosphorylate and activate LATS1/2 (Li et al., 2015; Meng et al., 2015; Plouffe et al., 2016; Zheng et al., 2015). Moreover, phosphorylation of LATS1/2 requires their plasma membrane translocation, which is facilitated by the Hippo upstream component NF2 (Yin et al., 2013). As the adaptor protein, MOB1 is required for LATS1/2 activation (Plouffe et al., 2016; Wei et al., 2007). In addition, Rho GTPase integrates various upstream stimuli (e.g. GPCR signaling, mevalonate pathway, energy stress, mechanotransduction) to sufficiently restrict LATS1/2 activation (Dupont et al., 2011; Gong et al., 2015; Sorrentino et al., 2014; Wang et al., 2015; Wang et al., 2014c; Yu et al., 2012; Zhao et al., 2012), while the underlying mechanism remains to be elucidated.
In this study, we revealed phosphatidic acid (PA)-related lipid signaling as a key regulator of the Hippo pathway. PA treatment activates YAP under various Hippo-activating conditions. Mechanistically, PA directly interacts with LATS and NF2 to respectively disrupt the LATS-MOB1 complex formation and the NF2-mediated LATS membrane translocation and phosphorylation. Inhibition of phospholipase D (PLD)-dependent PA production significantly suppresses YAP oncogenic activities. Interestingly, PLD1 is highly expressed in breast cancer and its high expression level correlates with YAP activation in breast tumor tissues. Taken together, our study not only reveals an unexpected lipid-protein interaction-mediated regulation of the Hippo pathway, but also proposes the PLD-PA-YAP axis as a potential therapeutic target for cancer treatment.
Results
PA positively regulates YAP
During a lipid screen study, we found that phosphatidic acid (PA) treatment dramatically suppressed YAP phosphorylation at S127 (Figure 1A), which is consistent with a previous observation (Yu et al., 2012). As controls, phosphoinositides (PI, PIP, PIP2, PIP3), phosphatidylcholine (PC), phosphatidylethanolamine (PE), phosphatidylserine (PS), as well as their derivatives diacylglycerol (DAG) and lysophosphatidylcholine (LPC), have no or only mild effect on YAP phosphorylation (Figure 1A). In concordance with previous findings (Miller et al., 2012; Yu et al., 2012), two GPCR ligands lysophosphatidic acid (LPA) and sphingosine-1- phosphate (S1P) also strongly reduced YAP phosphorylation (Figure 1A). The effect of PA on YAP phosphorylation is both time- and dose- dependent (Figure 1B). In addition, PA treatment dramatically induced YAP nuclear translocation (Figure 1C). Under all the tested Hippoactivating conditions including serum starvation, contact inhibition, glucose starvation, addition of PA was sufficient to reduce YAP phosphorylation (Figure 1D) and promote the transcription of YAP downstream genes CTGF and CYR61 (Figure 1E), suggesting a generic role of PA in regulation of the Hippo pathway. This PA-mediated regulation seems to be specific for the Hippo pathway, since we did not observe the similar effect of PA on other tested signaling pathways under the same experimental setting (Figure S1A). We also confirmed the role of PA using a different cell line SKOV3, where PA treatment significantly induced YAP nuclear translocation and YAP downstream gene transcription (Figure S1B). Taken together, these results demonstrate that PA is a positive regulator of YAP.
Figure 1. PA positively regulates YAP.
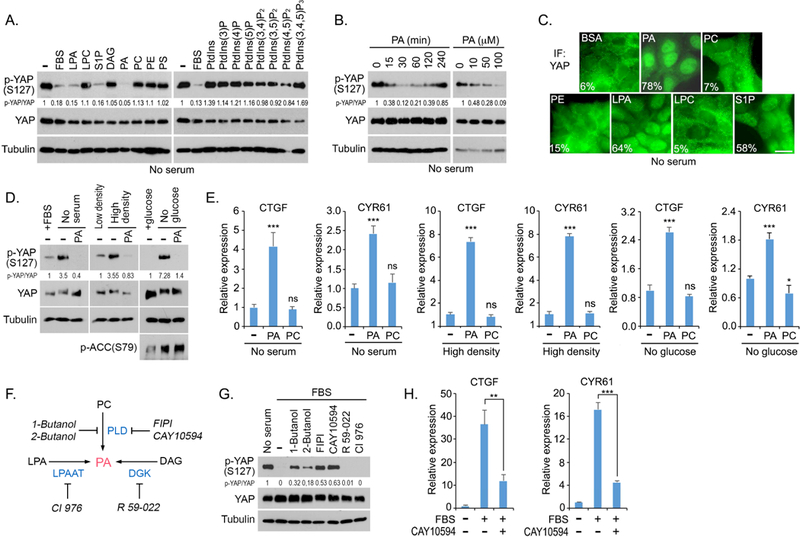
(A) PA reduces YAP phosphorylation. HEK293A cells were serum starved for 24 hours and subjected to the indicated lipid treatment (100 mM) for 30 min. FBS, fetal bovine serum.
(B) PA reduces YAP phosphorylation in both time- and dose-dependent manners.
(C) PA induces YAP nuclear translocation. HEK293A cells were serum starved for 24 hours and subjected to the indicated lipid treatment (100 μM) for 30 min. Cells from 10 different views (~200 cells) were randomly selected and quantified for YAP localization. Percentage of cells with nuclear YAP enrichment was shown. Scale bar, 20 μm.
(D) Supplementing PA in Hippo-activating conditions dephosphorylates YAP. HEK293A cells were cultured in serum-free medium, contact inhibition or glucose-free medium for 24 hours and subjected to PA treatment (100 μM) for 30 min.
(E) PA promotes YAP downstream gene transcription under Hippo-activating conditions. YAP- regulated gene transcripts (CTGF and CYR61) were detected by quantitative PCR under lipid treatment (100 μΜ) for 2 h and normalized (mean ± s.d., n = 3 biological replicates). * p < 0.05. *** p < 0.001. ns, no significance.
(F) Schematic illustration of three metabolic pathways for PA production. The inhibitors targeting each pathway or enzyme were indicated.
(G) Inhibition of PLD-mediated PA production induced YAP phosphorylation in serum-treated condition. Serum-starved HEK293A cells were pretreated with the indicated inhibitors (0.3% 1- Butanol, 0.3% 2-Butanol, 30 μM FIPI, 20 μM CAY10594, 20 μM R 59–022, and 20 μM CI 976) for 30 min and subjected to serum stimulation for 1 hour.
(H) Inhibition of PLD-mediated PA production suppresses serum-induced YAP downstream gene transcription. YAP-regulated gene transcripts (CTGF and CYR61) were detected by quantitative PCR. Serum-starved HEK293A cells were pretreated with 20 μM CAY10594 for 30 min, subjected to serum treatment for 2 hours and normalized (mean ± s.d., n = 3 biological replicates). ** p < 0.01. *** p < 0.001.
See also Figures S1 and S2.
Phospholipase D-mediated PA production is requiredfor YAP activation
Three most common metabolic pathways are known to produce PA (Figure 1F): PC can be hydrolyzed by phospholipase D (PLD) to produce PA and choline; LPA can be acylated through lysophosphatidic acid-acyltransferase (LPAAT) to generate PA; and DAG can be phosphorylated by diacylglycerol kinase (DGK) to form PA. To determine which of these pathways contributes to the PA-induced YAP activation, serum-starved cells were pretreated with inhibitors targeting the metabolic enzyme in each pathway and subjected to the serum Stimulation. As shown in Figure 1G, treatment with PLD inhibitors, FIPI and CAY10594, partially rescued YAP phosphorylation upon serum stimulation, while inhibition of either DGK by R 59–022 or LPAAT by CI-976 failed to do so. In addition, 1-Butanol and 2-Butanol, which compete with water in PLD-mediated hydrolysis of PC to generate phosphatidylalcohol but not PA (Yang et al., 1967), were also able to rescue YAP phosphorylation under serum-stimulated condition (Figure 1G). Consistently, the serum-induced YAP downstream gene transcription was significantly suppressed by PLD inhibitor CAY 10594 (Figure 1H). Similar findings were also observed in an ovarian cancer cell line HEY, where inhibition of PLD induced YAP cytoplasmic translocation and suppressed YAP downstream gene transcription (Figure S1C). Notably, addition of PA in the PLD inhibitors-treated cells diminished YAP phosphorylation (Figure S2A), suggesting that the PLD-mediated PA production is involved in YAP activation.
Given the redundant role between PLD1 and PLD2 in catalyzing PA production (Frohman, 2015; Peng and Frohman, 2012), we generated the PLD1/2-deficient cells in both HEK293A (Figure S2B) and HEY (Figure S2C). Like PLD inhibitors, loss of PLD1/2 increased YAP phosphorylation (Figures S2B and S2C) and suppressed YAP downstream gene transcription (Figures S2D and S2E) in both cell lines. PLD1/2 deficiency also induced YAP cytoplasmic translocation (Figures S2F and S2G), while supplementing PA in PLD1/2-deficient HEY cells significantly rescued YAP downstream gene transcription (Figure S2E) and YAP nuclear localization (Figures S2F and S2G). These data further demonstrate a positive role of PLD-PA lipid signaling in regulation of YAP.
PLD-PA lipid signaling is involved in the Rho-mediated YAP activation
Since PA can be converted into LPA via phospholipase A (PLA) (Sonoda et al., 2002) and LPA is known to activate YAP through GPCR signaling (Yu et al., 2012), it raises the possibility that PA may function indirectly via LPA to activate YAP. Interestingly, pretreatment of LPA antagonist Ki16425 (Ohta et al., 2003) inhibited the LPA-induced YAP dephosphorylation but failed to block the PA-induced YAP dephosphorylation (Figure 2A). LPA is known to activate YAP through Rho and actin cytoskeleton (Yu et al., 2012) and inactivation of Rho by C3 toxin or depolymerization of actin cytoskeleton by latrunculin B dramatically suppressed LPA-induced YAP dephosphorylation (Figure 2B) and YAP nuclear translocation (Figures 2C and 2D). Interestingly, PA treatment was still able to suppress YAP phosphorylation (Figure 2B) and translocate YAP into the nucleus (Figures 2C and 2D) under these two inhibitory conditions. Moreover, treatment of PA, but not LPA, reduced YAP phosphorylation in RhoA knockout (KO) cells (Figure 2E). These results not only demonstrate that PA activates YAP independently of LPA, but also raise the possibility that PA could involve in the Rho-mediated YAP activation.
Figure 2. The PLD-PA lipid axis is involved in Rho-mediated YAP activation.
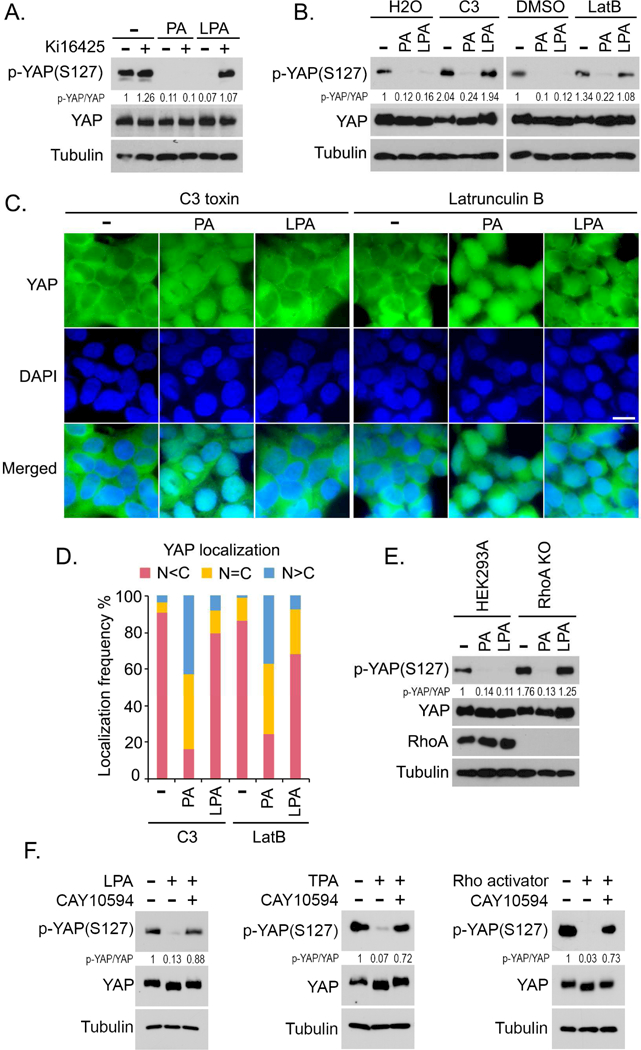
(A) PA reduces YAP phosphorylation independently of LPA. Serum-starved HEK293A cells were pretreated with Ki16426 (10 μM) or DMSO for 30 min, and subjected to PA (100 μM) treatment for 30 min or LPA (1 μM) treatment for 1 hour.
(B) PA but not LPA reduces YAP phosphorylation under C3 toxin or latrunculin B-treated condition. Serum-starved HEK293A cells were pretreated with C3 (2 μg/mL) for 4 hours or latrunculin B (LatB) (2 μg/mL) for 30 min, and subjected to PA (100 μM) treatment for 30 min or LPA (1 μM) treatment for 1 hour.
(C and D) PA but not LPA induces YAP nuclear translocation under C3 toxin or latrunculin B- treated condition. Serum-starved HEK293A cells were pretreated with C3 (2 μg/mL) for 4 hours or latrunculin B (LatB) (2 μg/mL) for 30 min, and subjected to PA (100 μM) treatment for 30 min or LPA (1 μM) treatment for 1 hour. YAP localization was shown (C). Cells from 10 different views (~200 cells in total) were randomly selected and quantified for YAP localization
(D). Scale bar, 20 μm.
(E) PA but not LPA reduces YAP phosphorylation in RhoA KO cells. Wild-type and RhoA KO HEK293A cells were serum starved for 24 hours and subjected to PA (100 μM) treatment for 30 min or LPA (1 μM) treatment for 1 hour.
(F) Inhibition of PLD-mediated PA production blocks Rho-induced YAP dephosphorylation. Serum-starved HEK293A cells were pretreated with PLD inhibitor CAY10594 (20 μM) for 30 min and subjected to LPA (1 μM), TPA (200 nM) or Rho activator II (1 μg/mL) treatment for 1 hour, respectively.
See also Figure S2.
To test this hypothesis, we pretreated the cells with PLD inhibitor CAY10594 to inhibit the PA production and examined the efficacy of Rho in activating YAP. Three different stimuli were employed to activate Rho: LPA, the PKC activator TPA and Rho activator II (Figure 2F). Intriguingly, inhibition of PLD significantly rescued YAP phosphorylation under all these tested Rho-activating conditions (Figure 2F). In addition, loss of PLD1/2 sustained YAP phosphorylation under the Rho activator II and TPA-treated conditions (Figure S2H). These data suggest that the PLD-mediated PA production is required for the Rho-induced YAP activation. Interestingly, cellular PA level is tightly controlled by Rho GTPase: inactivation of Rho by C3 toxin or serum starvation dramatically decreased PA level (Figure S2I); while activation of Rho by serum, LPA, Rho activator II and TPA significantly elevated PA level (Figure S2J). Given the fact that Rho GTPase is both necessary and sufficient for PLD activation (Hammond et al., 1997; Hess et al., 1997; Kuribara et al., 1995; Malcolm et al., 1996; Malcolm et al., 1994; Sung et al., 1997; Walker and Brown, 2002; Yamazaki et al., 1999), our data indicate that PLD-PA lipid signaling is involved in the Rho-induced YAP activation.
PA inhibits LATS kinase
The observation that PA treatment suppressed YAP phosphorylation at S127 (Figure 1A) indicates that the Hippo pathway is inhibited by PA. As shown in Figure 3A, PA treatment decreased LATS1 phosphorylation but not that of MST1 or its substrate MOB1. Moreover, loss of PLD1/2 increased LATS phosphorylation but had no effect on that of MST1 and MOB1 (Figure S2B). Depletion of MST1/2 did not affect the ability of PA to reduce YAP phosphorylation (Figure 3B). These data suggest that PA inhibits LATS but not MST.
Figure 3. PA inhibits LATS1/2 kinases in the Hippo pathway.
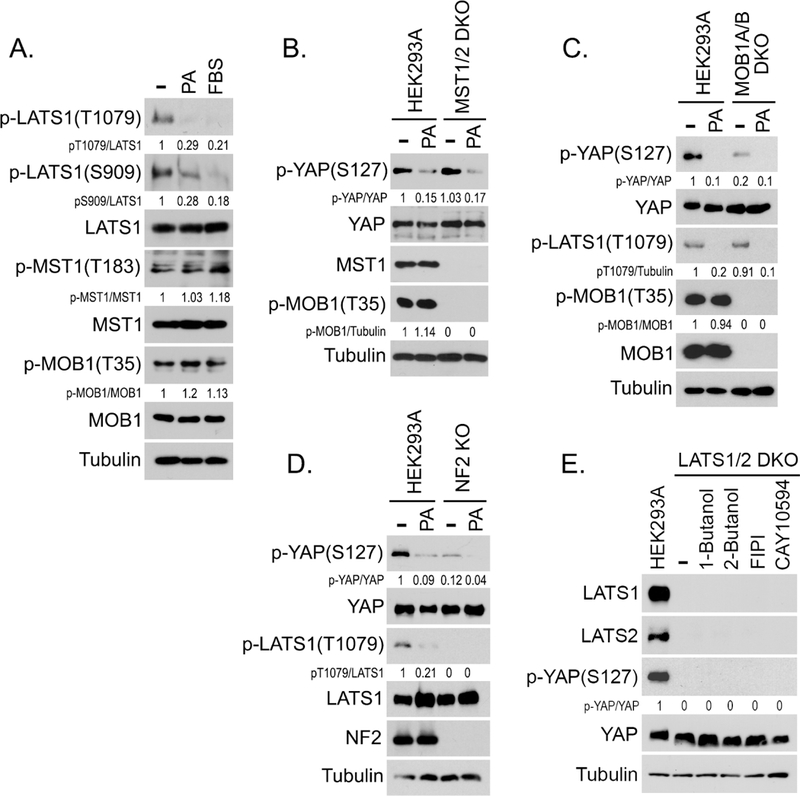
(A) PA inhibits LATS phosphorylation but not MST phosphorylation. Serum-starved HEK293A cells were treated by PA (100 μM) or serum for 30 min.
(B-D) PA inhibits YAP phosphorylation in the MST1/2 DKO, MOB1A/B DKO and NF2 KO cells. Wild-type HEK293A cells as well as the MST1/2 DKO (B), MOB1A/B DKO (C) and NF2 KO (D) cells, were serum starved for 24 hours and treated with PA (100 μM) for 30 min.
(E) Inhibition of PLD-mediated PA production fails to rescue YAP phosphorylation in the LATS1/2 DKO cells. Wild-type HEK293A and LATS1/2 DKO cells were treated by the indicated inhibitors (0.3% 1-Butanol, 0.3% 2-Butanol, 30 μΜ FIPI, and 20 μΜ CAY10594) for 1 hour.
See also Figure S2.
We also examined the role of PA in activating YAP using the MOB1A/B double knockout (DKO) and NF2 KO cells. Although YAP phosphorylation was relatively low in both MOB1A/B DKO and NF2 KO cells, it still can be further inhibited by PA (Figures 3C and 3D). PA treatment stabilized TAZ but did not affect the expression of other Hippo upstream components (Figure S2K). Notably, inhibition of PLD-dependent PA production failed to rescue YAP phosphorylation in the LATS1/2 DKO cells (Figure 3E), suggesting that LATS could be the direct target of PA in the Hippo pathway.
PA physically interacts with Hippo components LATS andNF2
To determine the mechanism underlying the PA-mediated LATS inhibition, we tested several possibilities and surprisingly found that PA directly binds LATS. Purified LATS1 protein (Figure 4A) specifically interacted with PA but not other tested lipids (Figure 4B), and their interaction was PA-dose dependent (Figure 4C). To determine the binding specificity between LATS1 and PA in the Hippo pathway, several Hippo components were purified (Figure 4D) and subjected to the lipid dot-blot assay. As shown in Figure 4E, PA specifically interacted with LATS1/2 and NF2 among the tested Hippo components. PA did not directly bind YAP (Figures S3A and S3B). Consistently, LATS1 and NF2 also associate with the PA-containing liposomes (Figure 4F). Taken together, these data demonstrate that PA is a bona-fide binding partner for LATS and NF2 in the Hippo pathway.
Figure 4. PA directly interacts with LATS1/2 and NF2 in the Hippo pathway.
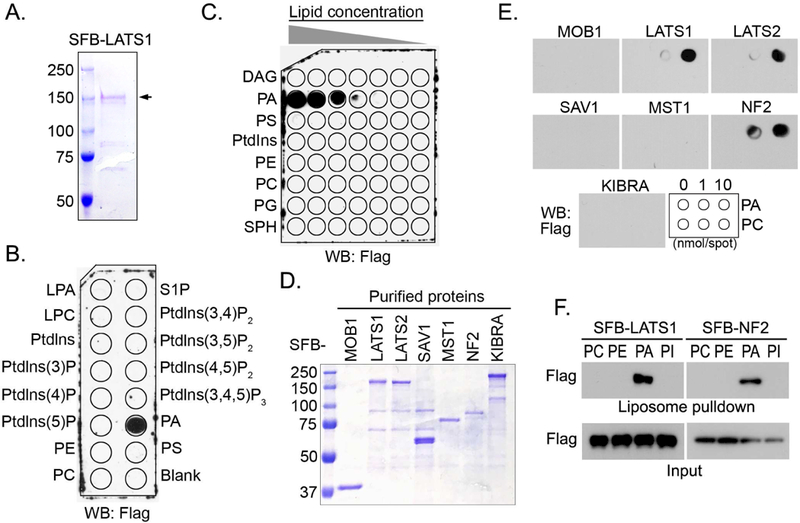
(A) Purified SFB-LATS1 protein was visualized by coomassie blue staining. SFB-tagged LATS1 was expressed in HEK293T cells, purified by streptavidin agarose beads, washed thoroughly in high-salt buffer containing 250 mM NaCl and eluted by 2 mg/mL Biotin.
(B) LATS1 specifically interacts with PA. Purified LATS1 protein (0.5 μg/mL) was incubated with a PIP Strips membrane at room temperature for 2 hours and subjected to Western blotting.
(C) PA interacts with LATS1 in a dose-dependent manner. Purified LATS1 protein (0.5 μg/mL) was incubated with a membrane lipid array containing eight lipids dotted in a gradient of amount. PG, phosphatidylglycerol; SPH, sphingomyelin.
(D and E) LATS1/2 and NF2 interact with PA. The Hippo pathway components were purified and visualized by coomassie blue staining (D). These purified proteins (0.5 μg/mL) were subjected to the lipid dot-blot assay (E).
(F) LATS1 and NF2 specifically bind PA-containing liposomes. Purified LATS1 and NF2 proteins were subjected to a liposome pulldown assay.
See also Figure S3.
Mapping the PA-binding regions in LATS1
To uncover the PA-binding region(s) in LATS1, we generated a series of LATS1 truncations (Figure 5A) and purified all these truncated proteins from bacteria (Figure S3C). As shown in Figure 5B, PA associates with C-terminal LATS1 and particularly the C1 fragment (residues 601~830). PA-binding proteins typically interact with the negatively charged head group of PA through their positively charged amino acid residues, including lysine (K), arginine (R) and histidine (H) (Lemmon, 2008; Shin and Loewen, 2011; Stace and Ktistakis, 2006). Analysis of LATS1 amino acid sequences indicates that the isoelectric point of LATS1 is 8.84. As shown in Figure 5C, PA binds strongly to LATS1 at pH 7.0, where LATS1 is positively charged. Their interaction was gradually decreased when pH was increased from 7.0 to 10.0 (Figure 5C), where LATS1 was switched from positive charge into negative charge. These data suggest that PA may directly associate with the positively charged amino acids within the LATS1-C1 fragment.
Figure 5. PA interacts with LATS and inhibits LATS-MOB1 complex formation.
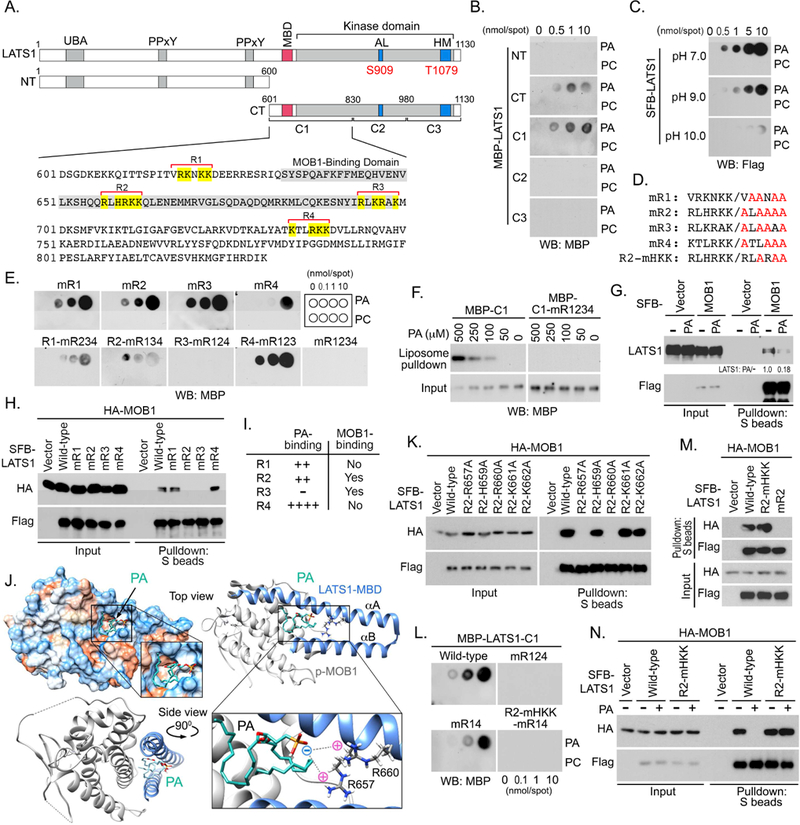
(A) Schematic illustration of LATS1 protein truncations used in this study. Four regions enriched in positively charged amino acids in the LATS1-C1 fragment were named as R1, R2, R3 and R4, where positively charged amino acids were highlighted in yellow. MOBl-binding domain (MBD) was indicated in gray.
(B) PA interacts with the LATS1-C1 fragment. The bacterially purified LATS1 truncation proteins (0.5 μg/mL) were subjected to lipid dot-blot assay.
(C) LATS1-PA interaction is regulated by pH. Purified SFB-LATS1 protein (0.5 μg/mL) was subjected to a lipid dot-blot assay under indicated pH conditions.
(D and E) Identification of the PA-binding regions within the LATS1-C1 fragment. Illustration of mutations generated for each predicted region in LATS1-C1 (D). All the purified LATS1-C1 mutant proteins (0.5 μg/mL) were subjected to a lipid dot-blot assay (E).
(F) LATS1-C1 fragment but not its mR1234 mutant binds PA-containing liposomes.
(G) PA treatment disrupts the interaction between LATS1 and MOB1. HEK293A cells were transfected with SFB-MOB1, serum starved for 24 hours, and subjected to PA (100 μM) treatment for 30 min.
(H) R2 and R3 regions in LATS1-C1 are required for the LATS1-MOB1 complex formation.
(I) Summary of the PA-binding and MOB1-binding abilities for the four predicted regions in LATS1-C1 fragment.
(J) The representative docking conformation of PA with LATS1-MBD/p-MOB1 complex. αA and αB, two a-helices of LATS1-MBD.
(K) Residues R657 and R660 are required for the association between LATS1 and MOB1.
(L-N) Generation of a LATS1 mutant that is capable of binding MOB1 under PA treatment. Indicated LATS1-C1 mutant proteins (0.5 μg/mL) were subjected to a lipid dot-blot assay (L). Residues H659, K661 and K662 are dispensable for the LATS1-MOB1 complex formation (M). PA failed to block the interaction between LATS1-R2-mHKK mutant and MOB1 (N).
See also Figure S3.
Interestingly, four regions that are rich in positively charged amino acids are revealed within the LATS1-C1 fragment (Figure 5A). To determine which of them is required for PA binding, a mutagenesis study was performed to replace all the positively charged amino acids (K, R and H) by neutral alanine (A) individually or in a combination (Figures 5D and S3D). These LATS1-C1 mutant proteins were then purified from bacteria (Figure S3D) and subjected to the lipid dot-blot assay. As shown in Figure 5E, mutating the highlighted positive residues in all four regions (mR1234) fully disrupted the binding between PA and the LATS1-C1 fragment. Moreover, the LATS1-C1 fragment, but not its mR1234 mutant, bound the PA-containing liposome in a dose-dependent manner (Figure 5F). Among these predicted regions, PA directly associated with regions R1, R2 and R4, but not R3 (Figure 5E). Collectively, these data show that PA directly binds to multiple regions (R1, R2 and R4) within the LATS1-C1 fragment.
PA binding disrupts the LATS-MOB1 complex formation
Among the identified three PA-binding regions in LATS1 kinase, R4 region contains the conserved lysine site (K734) (Figure 5A) that is required for the ATP binding (Yu et al., 2015b), raising the possibility that PA could compete the ATP association to inhibit LATS. To test this, the purified LATS1 protein was incubated with PA to saturation and subjected to in vitro kinase assay using the bacterially purified GST-YAP as the substrate. As shown in Figure S3E, the PA- bound LATS1 was still able to phosphorylate GST-YAP; while the LATS1 kinase dead (KD) mutant (K734R), where the ATP-binding site K734 was mutated to another positively charged amino acid arginine (R), failed to do so. These data indicate that PA binding does not affect the ability of LATS to bind ATP.
Since the other two PA-binding regions (R1 and R2) are adjacent to or within the MOB1- binding domain (MBD), next, we examined whether PA binding could affect LATS1 and MOB1 complex formation. Interestingly, PA treatment dramatically disrupted the interaction between LATS1 and MOB1 (Figure 5G). Moreover, mutating either R2 or R3 region, but not R1 or R4 region, disrupted the association between LATS1 and MOB1 (Figure 5H). These results suggest that R2 region could be involved in the PA-induced inhibition of the LATS1-MOB1 complex formation (Figure 5I).
To elucidate the underlying mechanism, we took advantage of the resolved crystal structure of LATS1-MBD and phospho-MOB1 (p-MOB1) (Ni et al., 2015) to perform the PA docking and molecular dynamics (MD) simulation analyses. Interestingly, PA was docked into a pocket region that is formed between two anti-parallel helices of LATS1-MBD (Figure 5J, left upper panel). The negatively charged PA head forms an intramolecular interaction with residues R657 and R660 in LATS1-MBD (Figure 5J, right lower panel). Since these two arginine residues are essential for the LATS1-MBD/p-MOB1 complex formation (Ni et al., 2015), their electrostatic interactions with PA could affect the LATS1-MBD/p-MOB1 complex formation. In addition, PA fatty acid chains are predicted to face the A-terminal part of a-helix A in LATS1- MBD (Figure 5J, left lower panel), which is involved in one of the binding interfaces between LATS1-MBD and p-MOB1 (Ni et al., 2015). Our MD simulation study further suggests that PA binding to the LATS1-MBD could deform the structure of the A-terminal part of a-helix A (Figure S3F), suggesting another potential mechanism by which PA interferes with the LATS-MBD/p-MOBl complex formation. Collectively, these simulation analyses illustrated a model for the PA-mediated inhibition of LATS1-MOB1 complex formation.
PA binds to LATS1-R2 region and disrupts the LATS1-MOB1 complex formation
R657 and R660 are two essential residues among the positively charged amino acids within the R2 region of LATS1, because mutating either of them was sufficient to abolish the association between LATS1 and MOB1 (Figure 5K). To generate a R2 mutant that cannot bind PA but still maintains the LATS1-MOB1 complex formation, we mutated the other three positively charged amino acids (H659, K661 and K662) in R2 region and generated a mutant, R2-mHKK (Figure 5D). Indeed, this R2-mHKK mutant failed to bind PA (Figures S3G and 5L), but still can associate with MOB1 (Figure 5M). Importantly, PA treatment failed to disrupt the interaction between MOB1 and LATS1-R2-mHKK mutant (Figure 5N). Collectively, these data demonstrate that PA targets the LATS1-MOB1 complex formation through its association with the LATS1-R2 region.
PA inhibits the NF2-mediatedLATS membrane translocation and activation
In concordance with the previous study (Plouffe et al., 2016), we found that MOB1 is dispensable for the LATS1-hydrophobic motif (HM) phosphorylation (Figure 3C). If the sole function of PA is to disrupt the LATS1-MOB1 complex formation, one might predict that PA should not affect LATS1-HM phosphorylation. However, LATS1-HM phosphorylation was significantly decreased upon PA treatment (Figure 3A) and PA was still able to inhibit YAP phosphorylation in the MOB1A/B DKO cells (Figure 3C). This discrepancy indicates that PA may employ additional mechanism(s) to inhibit LATS phosphorylation.
To address this issue, we examined whether PA could directly interfere with the upstream kinases-mediated LATS phosphorylation. As shown in Figure S4A, PA treatment did not affect the association between LATS and MST. Moreover, in vitro kinase assay showed that PA incubation did not affect the LATS1-HM phosphorylation as catalyzed by the tested LATS upstream kinases (e.g. MST1, MST2, MAP4K2, MAP4K4, MAP4K6, TAOK3) (Figure S4B). In addition, the LATS1-R2-mHKK mutant can be similarly phosphorylated at S909 and T1079 as compared with wild-type LATS1 under serum starvation (Figure S4C). These data suggest that PA is not directly involved in the upstream kinases-mediated LATS phosphorylation.
Notably, in addition to LATS1/2, PA also directly interacted with NF2 among the tested Hippo pathway components (Figures 4D–4F). Since NF2 is required for LATS phosphorylation (Figure 3D), next, we examined whether PA could regulate LATS phosphorylation through NF2. Consistently with a previous study (Mani et al., 2011), PA directly bound to NF2-FERM domain but not its C-terminal region (Figures S5A–S5C). Notably, PA treatment dramatically inhibited the association between LATS1 and NF2 (Figure S5D). It is known that NF2 binds LATS1/2 to facilitate their cell membrane translocation, where LATS1/2 are phosphorylated by their upstream kinases (Yin et al., 2013). Interestingly, PA treatment deceased the membrane- associated LATS1 without affecting NF2’s membrane association (Figure S5E) and localization (Figure S5F). Actually, NF2 was co-localized with PA on the cell membrane (Figure S5G). Taken together, these findings suggest that PA can target the LATS1-NF2 complex formation and inhibit the NF2-mediated LATS membrane translocation and activation.
PA inhibits LATS through two independent mechanisms
To further validate the role of PA in LATS regulation, we generated a LATS1-R2-mHKK mutant that was resistant to PA-mediated inhibition of LATS1-MOB1 complex (Figure 5N), and a LATS1-S909D/T1079D phosphorylation mimic mutant based on the PA-mediated inhibition of LATS1 phosphorylation via NF2 (Figures 3A and S5A–S5E). Like the wild-type LATS1, both mutants were capable of rescuing YAP cytoplasmic localization in serum-starved LATS1/2 DKO cells (Figure 6A). Addition of PA strongly counteracted the kinase activity of wild-type LATS1 and translocated YAP into the nucleus (Figure 6A). However, in the LATS1/2 DKO cells that were transfected with either LATS1-R2-mHKK mutant or LATS1-S909D/T1079D mutant, PA treatment was still able to partially translocate YAP into the nucleus (Figure 6A), suggesting that restoring either MOB1 binding or LATS1 phosphorylation cannot fully rescue LATS1 activity upon PA treatment. Next, we tested whether MOB1 binding and LATS1 phosphorylation are both required for it. Indeed, PA treatment failed to induce YAP nuclear translocation in the LATS1/2 DKO cells that were transfected with a combined LATS1-R2- mHKK-S909D/T1079D mutant (Figure 6A). Moreover, PA treatment significantly decreased YAP phosphorylation in the wild-type LATS1-reconstituted cells, partially decreased it in the LATS1/2 DKO cells expressing either LATS 1 -R2-mHKK mutant or LATS1-S909D/T1079D mutant, but failed to reduce YAP phosphorylation in the LATS1-R2-mHKK-S909D/T1079D mutant-reconstituted cells (Figure 6B). Functionally, expression of wild-type LATS1 but not its kinase-dead mutant suppressed the LATS1/2 DKO cell proliferation (Figures 6C and 6D). LATS1-R2-mHKK and LATS1-S909D/T1079D mutants were more potent than the wild-type LATS1 to inhibit LATS1/2 DKO cell proliferation, while the LATS1-R2-mHKK- S909D/T1079D mutant displayed the strongest inhibitory effect (Figures 6C and 6D). Taken together, these data demonstrate that PA targets both the MOB1 association and the LATS phosphorylation to achieve a full inhibition of LATS.
Figure 6. PA inhibits LATS by targeting both LATS-MOB1 complex formation and NF2- mediated LATS phosphorylation.
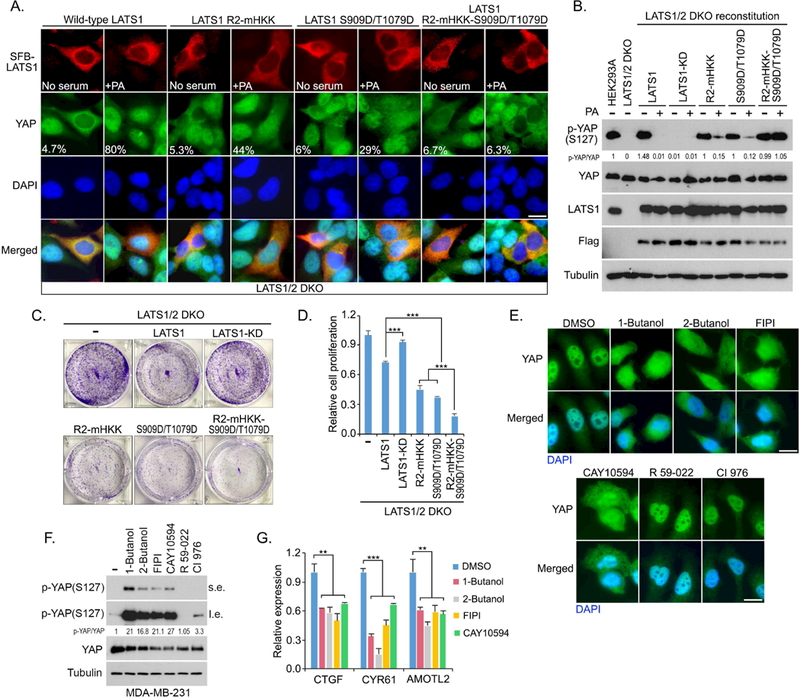
(A) PA-induced YAP nuclear translocation is blocked by LATS1-R2-mHKK-S909D/T1079D mutant. LATS1/2 DKO cells were transfected with indicated SFB-tagged LATS1 mutants, serum starved for 24 hours and subjected to PA (100 μM) treatment for 30 min. Flag-positive cells from ~30 different views (~200 cells in total) were randomly selected and quantified for YAP localization. Percentage of Flag-positive cells with nuclear YAP enrichment was shown. Scale bar, 20 μm.
(B) PA-induced YAP dephosphorylation is inhibited by expressing LATS1-R2-mHKK- S909D/T1079D mutant. LATS1/2 DKO cells were reconstituted with indicated SFB-tagged LATS1 mutants, serum starved for 24 hours and subjected to PA (100 mM) treatment for 30 min.
(C and D) LATS1/2 DKO cell proliferation is dramatically suppressed by reconstituting LATS1- R2-mHKK-S909D/T1079D mutant. The represented crystal violet staining pictures were shown (C) and cell proliferation was normalized (mean ± s.d., n = 3 biological replicates) (D). *** p < 0.001
(E-G) Inhibition of PLD-mediated PA production suppresses YAP in MDA-MB-231 cells. MDA-MB-231 cells were treated with indicated inhibitors (0.3% 1-Butanol, 0.3% 2-Butanol, 30 μM FIPI, 20 μM CAY10594, 20 μM R 59–022, and 20 μM CI 976), where YAP cellular localization (E) and phosphorylation (F) were examined after 2 hour-treatment. YAP downstream gene transcription (mean ± s.d., n = 3 biological replicates) were examined after 4 hour-treatment by quantitative PCR (G). s.e., short exposure. l.e., long exposure. ** p < 0.01. *** p < 0.001. Scale bar, 20 μm.
See also Figures S4 and S5.
To further confirm these findings, we took advantage of MDA-MB-231 cell line that is deficient in NF2 gene expression (Dupont et al., 2011) to assess the role of PA in LATS regulation. In MDA-MB-231 cells, inhibition of the PLD-mediated PA production induced YAP cytoplasmic translocation (Figure 6E), increased YAP phosphorylation (Figure 6F), and suppressed YAP downstream gene transcription (Figure 6G). Moreover, PA treatment was still able to disrupt the LATS1-MOB1 complex formation in the NF2 KO cells (Figure S5H). These data further confirm that PA can suppress LATS activation through two independent mechanisms.
The PLD-PA-YAP axis is a potential therapeutic target for cancer treatment
Given the role of PLD-PA lipid signaling in promoting cell proliferation, survival and migration (Bruntz et al., 2014), next, we examined the LATS dependence for the PLD-PA lipid signaling-mediated oncogenic functions. As shown in Figure S6A, loss of LATS1/2 significantly rescued HEK293A cell viability upon the treatment of PLD inhibitors. Similar finding was observed in the 4T1 Lats1/2 DKO cells (Figure S6B). Moreover, loss of Lats1/2 dramatically rescued 4T1 cell migration under the PLD inhibitors-treated conditions (Figure S6C). PLD inhibition also strongly induced Yap phosphorylation (Figure S6D), promoted Yap cytoplasmic translocation (Figures S6E and S6F) and suppressed Yap downstream gene Ctgf transcription (Figure S6G) in wild-type 4T1 cells but not in the Lats1/2 DKO cells. Treatment of PLD inhibitor FIPI dramatically suppressed 4T1 xenograft tumor growth, while loss of Lats1/2 significantly rescued tumor growth (Figures S6H and S6I). These results suggest that LATS is at least one of the major cellular targets of PLD-PA lipid signaling.
Elevated YAP expression and nuclear enrichment have been observed in many types of cancer (Yu et al., 2015a). To determine whether YAP activation contributes to the PLD-PA axis- dependent oncogenic activities, PLD inhibitors CAY10594 and FIPI were used to treat the MDA-MB-231 cells stably expressing vector control and YAP-5SA active mutant (Zhao et al., 2007). As shown in Figure 7A, overexpression of YAP-5SA mutant significantly rescued cell viability under the PLD inhibitors-treated conditions. Expression of YAP-5SA mutant dramatically reversed the CAY10594-induced inhibition of MDA-MB-231 cell migration (Figures 7B and7CC). Moreover, treatment of PLD inhibitor FIPI suppressed MDA-MB-231 xenograft tumor growth, while expression of YAP-5SA mutant significantly rescued the tumor growth (Figures 7C and 7D). These data suggest a crucial role of YAP, at least in part, in mediating the oncogenic functions of PLD-PA lipid signaling.
Figure 7. The PLD1-PA-YAP axis is a potential therapeutic target for cancer treatment.
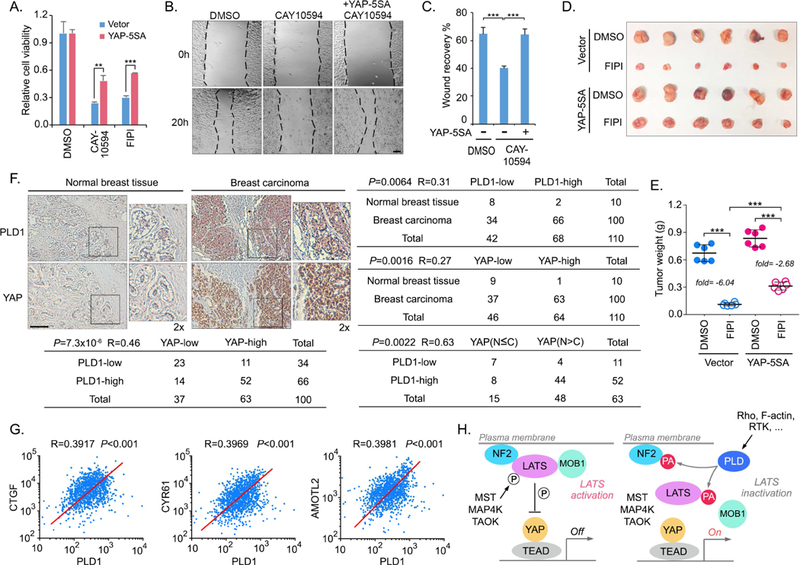
(A) Overexpression of YAP-5SA mutant rescues the cell viability under the PLD inhibitors- treated conditions. MDA-MB-231 cells were subjected to PLD inhibitors CAY10594 (10 μM) and FIPI (10 μM) treatment for 1 week. Cell viability was normalized (mean ± s.d., n = 3 biological replicates). ** p < 0.01. *** p < 0.001.
(B and C) Overexpression of YAP-5SA mutant rescues the cell migration under the PLD inhibitor-treated condition. MDA-MB-231 cells were subjected to PLD inhibitor CAY10594 (10 μM) treatment. Cell migration was examined by wound healing assay (B) and quantified (C). *** p < 0.001. Scale bar, 40 μm.
(D and E) Overexpression of YAP-5SA mutant rescues tumor growth under the PLD inhibitor- treated condition. MDA-MB-231 cells were subjected to xenograft tumor assay and treated with PLD inhibitor FIPI. Xenograft tumors are shown in (D), and the tumor weight was quantified in (E) (n = 6 mice, mean ± s.d.). *** p < 0.001. The FIPI-induced tumor suppression was indicated as the fold change of average tumor weight.
(F) Immunohistochemical staining of PLD1 and YAP were performed in a breast cancer tissue microarray. The indicated regions in the box are shown twice enlarged. Correlation analyses between PLD1 and YAP in normal breast and breast carcinoma samples are shown as tables. Statistical significance was determined by chi-square test. R, correlation coefficient. N, nuclear localization. C, cytoplasmic localization. Scale bar, 100 μm.
(G) Breast cancer TCGA database analyses of the mRNA expression correlation between PLD1 and YAP downstream target genes (CTGF, CYR61 and AMOTL2).
(H) A proposed model of PA-mediated inhibition of LATS kinase.
See also Figures S6 and S7.
YAP is highly activated in many cancers but genetic mutations of the Hippo pathway components in major human cancer types are rare (Yu et al., 2015a), indicating that additional oncogenic alterations could result in YAP activation and subsequent tumorigenesis. To determine the pathological relevance between PLD-PA lipid signaling and YAP, we performed an immunohistochemical staining of PLD1 and YAP using a breast cancer tissue microarray (Figure 7F). Notably, upregulation of PLD1 and YAP was observed in 66% (66 of 100) and 63% (63 of 100) of breast tumors, whereas only 20% (2 of 10) and 10% (1 of 10) of normal mammary tissues exhibited high expression of PLD1 and YAP, respectively (Figure 7F). Interestingly, a significant correlation between PLD1 and YAP protein levels was observed in the tested breast carcinomas (R=0.46, P=7.3×10⁻⁶), where 78.8% (52 of 66) of the breast tumors with high PLD1 expression showed high YAP level (Figure 7F). Moreover, we also noticed a significant correlation between PLD1 level and YAP nuclear enrichment in the breast carcinomas with high YAP expression (R=0.63, P=0.0022), where 84.6% (44 of 52) of the breast tumors with high PLD1 expression showed high nuclear enrichment of YAP (Figure 7F). However, it should be noticed that 11% (11 of 100) of total tested breast carcinoma specimens had low PLD1 expression but high YAP expression (Figure 7F). These data suggest that PLD1 elevation may contribute to the activation of YAP in a substantial fraction of human breast tumors, while in other tumors YAP can be activated through different mechanisms.
Consistently, our breast cancer TCGA database analysis revealed a positive correlation in gene expression between PLD1 and YAP downstream genes CTGF, CYR61 and AMOTL2 (Figure 7G). High level of PLD1 indicated a poor survival rate for several subtypes of breast cancer patients, for whom high levels of YAP and its downstream gene CTGF, CYR61 and AMOTL2 similarly indicated a poor survival rate (Figure S7). Collectively, these analyses not only demonstrate a pathological relevance between PLD-PA lipid signaling and YAP, but also indicate a potential mechanism underlying the elevated YAP activation in breast cancer.
Discussion
In this study, we revealed an unexpected mechanism by which PA modulates the Hippo pathway, where PA directly interacts with Hippo components LATS and NF2 to fully inhibit LATS kinase activity and activate YAP (Figure 7H).
NF2, MOB1 and Rho are key regulators of LATS. Our current study proposes a mechanistic connection between these regulators and LATS. First, PA controls the LATS-MOB1 and LATS-NF2 complex formation via its physical interaction with LATS and NF2, respectively, suggesting a regulatory mechanism for MOB1 and NF2. Second, the PLD-PA lipid signaling is involved in the Rho-mediated YAP activation, providing a mechanistic insight into many Rho- related Hippo upstream signaling events. Future investigation will reveal whether PLD-PA lipid signaling relays other Hippo upstream stimuli to regulate YAP and help to uncover additional upstream regulators for the Hippo pathway.
Since the Hippo pathway plays a crucial role in tissue/organ size control by restricting its downstream effector YAP, it is possible that PLD-PA lipid signaling could involve in organ/tissue size control through the Hippo pathway. Notably, PA is known to regulate muscle size through mTOR signaling (Fang et al., 2001; Joy et al., 2014; You et al., 2014). PLD also positively regulates mTOR signaling and promotes skeletal muscle growth (Jaafar et al., 2013; Yoon and Chen, 2008, 2013). YAP is shown to positively regulate skeletal muscle size independently of mTOR signaling (Goodman et al., 2015; Watt et al., 2015). Together with these evidences, our current study highlights the possibility that both YAP and mTOR could be concomitantly regulated by PLD-PA lipid signaling in this process.
Our findings also indicate YAP as a key downstream effector in the PLD-related tumorigenesis (Figure 7). Although extensive studies support YAP as a therapeutic target for cancer treatment, development of compounds to target YAP has been slow and challenging. Interestingly, the PLD inhibitors have shown efficacy in targeting tumor growth, invasion and metastasis in several types of cancers (Scott et al., 2009; Su et al., 2009) and showed no side effect on body weight in animal studies (Figure S6J) (Chen et al., 2012), highlighting their therapeutic potentials in YAP-related cancer therapy. Notably, PLD1/2 inhibition is expected to have more utility in an acute pharmacological setting than a chronic one, given the fact that long-term inhibition of PLD could result in the activation of compensatory pathways to facilitate the PA production (Frohman, 2015).
STAR Methods
CONTACT FOR REAGENT AND RESOURCE SHARING
Further information and requests for resources and reagents should be directed to and will be fulfilled by the Lead Contact, Wenqi Wang (wenqiw6@uci.edu)
EXPERIMENTAL MODEL AND SUBJECT DETAILS
Cell lines
HEK293T cells (a female cell line, ATCC: CRL-3216) were kindly provided by Dr. Junjie Chen (MD Anderson Cancer Center). HEK293A cells (a female cell line, ThermoFisher: R70507) were kindly provided by Dr. Jae-Il Park (MD Anderson Cancer Center). The MDA- MB-231 cells (a female cell line, ATCC: HTB-26) were kindly provided by Dr. Mien-Chie Hung (MD Anderson Cancer Center). The SKOV3 (a female cell line, ATCC: HTB-77) and HEY (a female cell line, ATCC: CRL-3252) cells were kindly provided by Dr. Jinsong Liu (MD Anderson Cancer Center). The wild-type 4T1 (a female mouse cell line) and Lats1/2 DKO 4T1 cells were described previously (Moroishi et al., 2016).
HEK293T, HEK293A, MDA-MB-231 and SKOV3 cells are maintained in Dulbecco’s modified essential medium (DMEM) supplemented with 10% fetal bovine serum at 37°C in 5% CO2 (v/v). HEY and 4T1 cells are cultured in RPMI-1640 medium supplemented with 10% fetal bovine serum at 37°C in 5% CO2 (v/v). As for glucose starvation, cells were washed once and cultured in glucose-free DMEM (Invitrogen) with 10% dialyzed FBS (Gemini Bio-Products) for 24 hours. Plasmid transfection was performed using a polyethylenimine reagent.
Animals
Athymic nude (nu/nu) mouse strain was used for the xenograft tumor assay in this study. Four-week-old female nude mice were purchased from Jackson Laboratory (002019) and kept in a pathogen-free environment. The xenograft tumor experiments were followed institutional guidelines, approved by the Institutional Animal Care and Use Committee of the University of California, Irvine, and performed under veterinary supervision. The indicated MDA-MB-231 cells (2×10⁶) and 4T1 cells (2×10⁶) were injected into the inguinal mammary fat pad of nude mice. When tumors are approximately 50mm3 in size, 12 mice for each cell line will be randomly assigned into two groups (6 mice per group) and subjected to the treatment (vehicle control or 5 mg/kg/day FIPI) delivered via intraperitoneal administration every other day. After 15 days for adaptation, mice were euthanized and tumor weights were analyzed.
Patient tissues
The breast tissue array was purchased from US Biomax, Inc. According to the Declaration of Specimen Collection provided by US Biomax, each specimen collected from any clinic was consented by both hospital and individual.
METHOD DETAILS
Antibodies and chemicals
For Western blotting, anti-a-tubulin (T6199–200UL, 1:5000 dilution) and anti-Flag (M2) (F3165–5MG, 1:5000 dilution) monoclonal antibodies were obtained from Sigma-Aldrich. An anti-hemagglutinin (HA) monoclonal antibody (MMS-101P, 1:3000 dilution) was obtained from Covance. Anti-phospho-YAP (S127) (4911S, 1:1000 dilution), anti-phospho-ACC (Ser79) (3661S, 1:1000 dilution), anti-RhoA (2117S, 1:2000 dilution), anti-phospho-LATS1 (Thr1079) (8654S, 1:1000 dilution), anti-phospho-LATS1 (Ser909) (9157S, 1:1000 dilution), anti- LATS1(3477S, 1:1000 dilution, 1:100 dilution for immunoprecipitation), anti-phospho-MST1 (Thr183) (3681S, 1:1000 dilution), anti-MST1(3682S, 1:1000 dilution), anti-phospho-MOB1 (Thr35) (8699S, 1:1000 dilution), anti-MOB1 (3863S, 1:2000 dilution), anti-NF2 (12896S, 1:2000 dilution), anti-SAV1 (3507S, 1:500 dilution)), anti-KIBRA (8774S, 1:1000 dilution), anti-YAP/TAZ (8418S, 1:2000 dilution) and anti-Caveolin-1 (3238S, 1:1000 dilution) antibodies were purchased from Cell Signaling Technology. Anti-LATS2 (A300–479A, 1:2000 dilution) polyclonal antibody was obtained from Bethyl Laboratories. Anti-GST (sc-138, 1:1000 dilution), anti-Myc (sc-40, 1:1000 dilution) and anti-PLD1 (sc-28314, 1:500 dilution) was purchased from Santa Cruz Biotechnology. Anti-YAP antibody (1:1000 dilution) was raised by immunizing rabbits with bacterially expressed and purified GST-fused human full-length YAP protein. Anti- MBP antibody (1:10000 dilution) was raised by immunizing rabbits with bacterially expressed and purified MBP protein. Antisera were affinity-purified using an AminoLink Plus Immobilization and Purification Kit (Pierce).
For immunostaining, an anti-Flag polyclonal antibody (F7425-.2MG, 1:5000 dilution) was obtained from Sigma-Aldrich. An anti-YAP (sc-101199, 1:200 dilution) monoclonal antibody was purchased from Santa Cruz Biotechnology. TRITC-conjugated phalloidin (P1951) was obtained from Sigma-Aldrich.
For immunohistochemical staining, an anti-PLDl monoclonal antibody (sc-28314, 1:200 dilution) was obtained from Santa Cruz Biotechnology. An anti-YAP (14074S, 1:15 dilution) monoclonal antibody was purchased from Cell Signaling Technology.
1-Butanol (AC167691000) and 2-Butanol (AC610261000) were purchased from Fisher Scientific. FIPI hydrochloride hydrate (F5807–5MG) and latrunculin B (L5288–1MG) were obtained from Sigma-Aldrich. CAY10594 (13207) was purchased from Cayman Chemical. R 59–022 (2194) and CI 976 (2227) were obtained from Tocris. Rho activator II (CN03-A) and Rho inhibitor C3 (CT04-A) were purchased from Cytoskeleton.
For the lipids, PA (phosphatidic acid) (830855P), PC (phosphatidylcholine) (850355P), PE (phosphatidylethanolamine) (850705), PS (phosphatidylserine) (840037), LysoPC (lysophosphocholine) (110687), LPA (lysophosphatidic acid) (857228), and S1P (sphingosine-1- phosphate) (860641) were purchased from Avanti Polar Lipids. PtdIns (phosphatidylinositol) diC16 (P-0016–100 mg), PtdIns(3)P (phosphatidylinositol [3] phosphate) diC16 (P-3016–100 mg), PtdIns(4)P, (phosphatidylinositol [4] phosphate) diC16 (P-4016–100 mg), PtdIns(5)P (phosphatidylinositol [5] phosphate) diC16 (P-5016–100 mg), PtdIns(3,4)P2 (phosphatidylinositol [3,4] bisphosphate) diC16 (P-3416–100 mg), PtdIns(3,5)P2 (phosphatidylinositol [3,5] bisphosphate) diC16 (P-3516–100 mg), PtdIns(4,5)P2 (phosphatidylinositol [4,5] bisphosphate) diC16 (P-4516–100 mg), PtdIns(3,4,5)P3 (phosphatidylinositol [3,4,5] trisphosphate) diC16 (P3916–100 mg), and DAG (diacylglycerol) (L-0016–100 mg) were purchased from Echelon Biosciences.
Immunofluorescent staining
Immunofluorescent staining was performed as described previously (Wang et al., 2008). Briefly, cells cultured on coverslips were fixed with 4% paraformaldehyde at room temperature for 10 minutes and then extracted with 0.5% Triton X-100 solution for 5 minutes. After blocking with Tris-buffered saline with Tween 20 (TBST) containing 1% bovine serum albumin, the cells were incubated with the indicated primary antibodies at room temperature for 1 hour. After that, the cells were washed and incubated with fluorescein isothiocyanate- and rhodamine-conjugated secondary antibodies for 1 hour. Cells were counterstained with 100 ng/mL 4’,6-diamidino-2- phenylindole (DAPI) for 2 minutes to visualize nuclear DNA. The cover slips were mounted onto glass slides with an anti-fade solution and visualized under a Nikon ECLIPSE TE2000-S fluorescence microscope or a Nikon Eclipse Ti spinning-disk confocal microscope.
Lipid preparation
LPA was prepared in PBS containing 10% fatty acid-free BSA by vortexing to yield a final concentration of 10 mM. PA and other lipid stock solutions were prepared by water bath sonication as described previously (Yoon et al., 2011). Briefly, lipids were suspended in 250 pL vesicle buffer (containing 150 mM NaCl and 10mM Tris-Cl, pH 8.0) by vortexing to yield a final concentration of 10 mM. After that, the lipid suspension was prepared by water bath sonication for 10 min. The lipid vesicles (with a diameter in the range of 15–50 nm) were made freshly before use.
Constructs and viruses
Plasmids encoding the indicated genes were obtained from the Human ORFeome V5.1 library or purchased from Open Biosystems. All constructs were generated via polymerase chain reaction (PCR) and subcloned into a pDONOR201 vector using Gateway Technology (Invitrogen) as the entry clones. Gateway-compatible destination vectors with the indicated SFB tag, HA tag, Myc tag, MBP tag and GST tag were used to express various fusion proteins. PCR- mediated site-directed mutagenesis was used to generate positively charged amino acid mutants for LATS1-C1 fragment (mR1, mutating residues 617~622 VRKNKK to VAANAA; mR2, mutating residues 657~662 RLHRKK to ALAAAA; mR3, mutating residues 694~699 RLKRAK to ALAAAA; mR4, mutating residues 734~739 KTLRKK to ATLAAA); R2-mHKK, mutating residues 657~662 RLHRKK to RLARAA). In addition, the above mutations were also generated in a combination (R1-mR234, mutating all the R2, R3 and R4 regions without changing R1 region; R2-mR134, mutating all the R1, R3 and R4 regions without changing R2 region; R3- mR124, mutating all the R1, R2 and R4 regions without changing R3 region; R4-mR123, mutating all the R1, R2 and R3 regions without changing R4 region; mR1234, mutating all the R1, R2, R3 and R4 regions).
The SFB-LATS1 lentiviral expression vector was generated by inserting the gateway response fragment (attR1 -ccdB-attR2)-fused SFB tag into the Xbal and SwaI multi-clonal sites of the pCDH-CMV-EF1-GFP vector (kindly provided by Dr. M. James You, MD Anderson Cancer Center). Wild-type LATS1 and its mutants were cloned into this vector through a gateway-based LR reaction.
All lentiviral supernatants were generated by transient transfection of HEK293T cells with the helper plasmids pSPAX2 and pMD2G (kindly provided by Dr. Zhou Songyang, Baylor College of Medicine) and harvested 48 hours later. Supernatants were passed through a 0.45-mm filter and used to infect cells with the addition of 8 mg/mL hexadimethrine bromide (Polybrene) (Sigma-Aldrich).
Gene inactivation by CRISPR/Cas9 system
For each Hippo pathway component (MOB1A, MOB1B, LATS1, LATS2 and RhoA) and PLD1, five distinct single-guide RNAs (sgRNA) were designed by CHOPCHOP website (https://chopchop.rc.fas.harvard.edu). cloned into lentiGuide-Puro vector (Addgene plasmid # 52963). As for NF2, sgRNA sequence was designed based on a previous study (Wang et al., 2014a). sgRNAs were transfected into HEK293A cells with lentiCas9-Blast construct (Addgene plasmid # 52962). The next day, cells were selected with puromycin (2 mg/ml) for two days and subcloned to form single colonies. Knockout cell clones were screened by Western blotting to verify the loss of MOB1, NF2, LATS1, LATS2, RhoA, and PLD1 expression. MST1/2 DKO HEK293A cell was generated as described previously (Plouffe et al., 2016). The oligo sequence information of sgRNAs used for knockout cell generation is listed in the Table S1.
RNA extraction, reverse transcription and real-time PCR
RNA samples were extracted with TRIzol reagent (Invitrogen). Reverse transcription assay was performed using the Script Reverse Transcription Supermix Kit (Bio-Rad) according to the manufacturer’s instructions. Real-time PCR was performed using Power SYBR Green PCR master mix (Applied Biosystems). For quantification of gene expression, the 2-AACt method was used. GAPDH expression was used for normalization. The sequence information of q-PCR primers used for gene expression analysis is listed in the Table S1.
Detection of cellular phosphatidic acid
Cellular PA level was measured using Total Phosphatidic Acid Assay Kit (MET-5019, Cell Biolabs) according to the manufacturer’s instruction. Briefly, ~107 HEK293A cells were collected in 1 mL ice-cold PBS for sonication. Cells were then sonicated again by adding 1.5 mL methanol. After that, 2.25 mL 1 M NaCl and 2.5 mL chloroform were added into the sample and mixed thoroughly. Samples were centrifuged at 1,500 g at 4 0C for 10 min, and the lower organic phase was transferred to a glass vial, dried in a speedvac and dissolved in the provided Assay Buffer. PA samples together with the provided PA standards were transferred into a 96-well plate, where the provided Lipase Solution was added. After that, the plate was incubated at 37 0C for 30 min. The same amount of Detection Enzyme Mixture solution was added into each well and the fluorescent signal was detected using a microplate reader (excitation in the 530–560 nm range and emission in the 585–595 nm range). The PA concentration was determined by subjecting the fluorescent intensity value to the standard curve and the relative PA level was normalized.
Recombinant protein production
The MBP proteins expressed in Escherichia coli were purified by amylose resin (New England Biolabs) and according to the manufacturer’s protocol and eluted by maltose buffer (10 mM maltose; 20 mM Tris-HCl, pH 7.5; 200 mM NaCl; 1 mM EDTA; 10 mM β- mercaptoethanol). The GST proteins expressed in Escherichia coli were purified by Glutathione Sepharose 4B beads (GE Healthcare) according to the manufacturer’s protocol and eluted by glutathione buffer (20 mM L-gluthathione; 150 mM Tris-HCl, pH 8.8).
Cell fractionation assay
Cell fractionation assay was performed as described previously (Wang et al., 2012). Briefly, cells were harvested in ice-cold low salt buffer (10 mM HEPES buffer pH 7.4, 10 mM KCl, 0.1 mM EDTA, 0.1 mM EGTA, 50 mM NaF, 1.5 mM sodium vanadate, 1 mM DTT, 1 mM phenylmethylsulfonyl fluoride, 1 mg/mL pepstatin and 1mg/mL aprotinin) and passed through 25G needle for 15 times. 40 pL lysate was kept as the total cell lysate. Cell lysates were centrifuged at 4 0C, 3000 rpm for 10 min. The supernatants were centrifuged again at 4 0C, 100,000 rpm for 30 min. The pellets were collected as membrane fractions and the remaining supernatants were used as cytoplasmic fractions. Each fraction was boiled in 2x SDS loading buffer in equal volume and analyzed by SDS-PAGE.
Protein-lipid binding assay
The PIP Stripes (P-6001) and Membrane Lipid Array (P-6003) were purchased from Echelon Biosciences. As for the PA/PC lipid membrane, PA and PC were dissolved in chloroform at different concentrations and dotted on the nitrocellulose membrane. Lipid membrane was blocked in TBST buffer containing 3% fatty acid-free BSA at 4 0C overnight. 0.5 mg/mL purified protein was incubated with the lipid membrane at room temperature for 2 hours with gentle agitation. After that, the lipid membrane was washed three times in TBST buffer and subjected to primary antibody incubation. Western blotting was performed to detect the lipid- associated protein with indicated antibodies.
Liposome pulldown assay
A liposome pulldown assay was used to determine the binding between PA and purified proteins as described previously (Tay et al., 2017) with some modifications. Briefly, PC, PE and lipids of interest (e.g. PA, PI) were mixed at a mole ratio 6:3:1 to 8 μΜ total amount of lipids in chloroform. After evaporated under a gentle stream of nitrogen, lipids were re-suspended in inside buffer (176 mM sucrose in 20 mM Tris-HCl, pH 7.6) and vortexed to form a milky and uniform suspension. The lipid solution was then subjected to 10 cycles of freeze-thaw using liquid nitrogen and a 37°C water bath. The uni-lamellar liposomes were generated using the mini-extruder (Avanti Polar Lipids) according to the manufacturer’s instruction. The liposomes were prepared at indicated concentrations and incubated with 1 mg purified protein at 4 0C for 30 min. Liposome-protein mixture was then pelleted by centrifuging at 4 0C, 100, 000 g for 30 min, suspended in 1 x SDS loading buffer and subjected to SDS-PAGE.
In vitro kinase assay
SFB-LATS1 or its kinase-dead mutant (K734R), SFB-MST1, SFB-MST2, SFB- MAP4K2, SFB-MAP4K4, SFB-MAP4K6 and SFB-TAOK3 were expressed in HEK293T cells for 48 hours. The indicated kinases were then pulled down by S protein beads, washed three times in washing buffer (40 mM HEPES, 250 mM NaCl), suspended in NETN buffer, incubated with 300 mM PA or PC at 4 0C overnight, and subjected to the kinase assay in the presence of cold ATP (500 μM) and 2 μg bacterially-purified GST-YAP or MBP-LATS1-C3. The reaction mixture was incubated at 30 °C for 30 min, terminated with 2x SDS loading buffer and subjected to SDS-PAGE. Phosphorylation of YAP and LATS1-HM were determined by YAP S127 and LATS1 T1079 phospho-antibodies, respectively.
Cell proliferation/viability assay
To examine the cell proliferation, ~2,000 cells were seeded as triplicates in 6-well plates and cultured for 3 days. As for the compound treatment, cells were cultured for 7 days. At the endpoint, cells were fixed with 4% paraformaldehyde for 10 min and stained with 0.1% crystal violet. After that, cells were washed three times and detained with acetic acid. The absorbance of the crystal violet solution was measured at O.D. 595 nm and normalized to the control or vehicle-treated cells to determine the relative cell proliferation or viability.
PA Docking and Molecular Dynamics Simulation
The docking study was performed using AutoDock Vina (Trott and Olson, 2010), which is implemented in the UCSF Chimera package (Pettersen et al., 2004). LATS1-MBD/p-MOB1 crystal structure (PDB: 5BRK) (Ni et al., 2015) was prepared for PA docking using the DockPrep tool in the UCSF Chimera (Pettersen et al., 2004). The docking box was defined by the size of 37 Å x 63 Å x 30 Å that is centered on the LATS1-MBD/p-MOB1 complex interface and includes the entire LATS1-MBD. The exhaustiveness of search was set as 8 and the maximum energy difference was set as 3 kcal/mol between binding modes. Total 10 binding modes with the best scores were generated.
The docking-generated PA/LATS1-MBD/p-MOB1 modes were used as starting structures to perform MD study. All the MD simulations were performed using Amber17 package (http://ambermd.org/#AmberTools). The missing residues in the crystal structure of LATS1-MBD/p-MOB1 complex except those in termini were fixed by the Modeller package (Sali and Blundell, 1993). The termini of each protein chain were capped with ACE and NHE groups at N- and C-terminus, respectively. Amber FF14SB force field was used for protein parameters (Maier et al., 2015) and Amber Lipid17 v1.1 force field was used for PA molecule (Dickson et al., 2014). The 4-coordinated zinc metal center in MOB1 molecule was parameterized using the Zinc AMBER force field (ZAFF) (Peters et al., 2010). The final system was neutralized with sodium ions. All simulations were performed at 300 K under NVT ensemble with the integration step at 2 fs. The cutoff was set as 9.0 Ä. For each simulation, a 40 ns trajectory was generated. The molecular structure graphics were prepared using the UCSF Chimera package (Pettersen et al., 2004).
Immunohistochemical analysis
The breast tissue array was purchased from US Biomax (BC081120a), deparaffinized and rehydrated. The antigens were retrieved by applying Unmask Solution (Vector Laboratories) in a steamer for 40 min. To block endogenous peroxidase activity, the sections were treated with 3% hydrogen peroxide for 30 min. After 1 hour of pre-incubation in 10% goat serum to prevent nonspecific staining, the samples were incubated with an antibody at 4 0C overnight. The sections were incubated with SignalStain Boost detection reagent at room temperature for 30 min. Color was developed with SignalStain 3,3’-diaminobenzidine chromogen-diluted solution (all reagents were obtained from Cell Signaling Technology). Sections were counterstained with Mayer hematoxylin. To quantify the results, a total score of protein expression was calculated from both the percentage of immunopositive cells and immunostaining intensity. High and low protein expressions were defined using the mean score of all samples as a cutoff point. Pearson chi- square analysis test was used for statistical analysis of the correlation of PLD1 with tissue type (normal versus cancer) and the correlation between PLD1 and YAP.
TCGA database analysis
Datasets for CTGF, CYR61, AMOTL2 and PLD1 were downloaded from the Cancer Genome Atlas (TCGA) data portal (http://tcga-data.nci.nih.gov). mRNA expression of each gene was evaluated in human breast cancer TCGA database. mRNA expression correlation between PLD1 and YAP downstream genes (CTGF, CYR61 and AMOTL2) were analyzed using GraphPad spearman correlation. Total 1,210 patient samples were analyzed. R, correlation coefficient.
QUANTIFICATION AND STATISTICAL ANALYSIS
Each experiment was repeated twice or more, unless otherwise noted. There were no samples or animals excluded for the analyses in this study. As for the mouse experiments, there was no statistical method used to predetermine sample size. We assigned the samples or animals randomly to different groups. A laboratory technician was blinded to the group allocation and tumor collections during the animal experiments as well as the data analyses. The Student ¿-test was used to analyze the differences between groups. Data were analyzed by Student’s t test or Pearson chi-square analysis. SD was used for error estimation. A P value < 0.05 was considered statistically significant.
Supplementary Material
Highlights.
PLD-PA lipid signaling positively regulates YAP
PA directly binds LATS and NF2 in the Hippo pathway
PA targets LATS-MOB1 complex formation and NF2-mediated LATS membrane translocation
The PLD-PA-YAP axis is a potential therapeutic target for cancer treatment
Acknowledgments
We thank Drs. Jie Chen (University of Illinois Urbana-Champaign), Aifu Lin (Zhejiang University), Aimee Edinger (University of California, Irvine), Guangwei Du (University of Texas Health Science Center at Houston), Steven Gross (University of California, Irvine), Gregory Weiss (University of California, Irvine), Robert Spitale (University of California, Irvine) and Fa-Xing Yu (Fudan University) for reagents and technical help. This work was supported by a NIH grant (GM126048) and a Research Scholar Grant (RSG-18–009-01-CCG) from the American Cancer Society to W.W. and also supported in part by NIH grants to K.L.G. (CA196878 and GM51586) and R. L. (GM093040 and GM0793830). W.W. is a recipient of an American Association for Cancer Research Career Development Award for Translational Breast Cancer Research supported by the Breast Cancer Research Foundation (16–20-26-WANG) and a member of the Chao Family Comprehensive Cancer Center (P30 CA062203) at UC Irvine.
Footnotes
DATA AND SOFTWARE AVAILABILITY
Sequence information about all the oligos used in this study can be found in Table S1. Original imaging data have been deposited to Mendeley Data at: doi:10.17632/532yhgbphf.1
Conflict of interest
K.L.G. is a co-founder and has equity interest in Vivace Therapeutics, Inc., and OncoImmune, Inc. The terms of this arrangement have been reviewed and approved by the University of California, San Diego in accordance with its conflict of interest policies.
Publisher's Disclaimer: This is a PDF file of an unedited manuscript that has been accepted for publication. As a service to our customers we are providing this early version of the manuscript. The manuscript will undergo copyediting, typesetting, and review of the resulting proof before it is published in its final citable form. Please note that during the production process errors may be discovered which could affect the content, and all legal disclaimers that apply to the journal pertain.
References
- Bruntz RC, Lindsley CW, and Brown HA (2014). Phospholipase D signaling pathways and phosphatidic acid as therapeutic targets in cancer. Pharmacol Rev 66, 1033–1079. [DOI] [PMC free article] [PubMed] [Google Scholar]
- Chen Q, Hongu T, Sato T, Zhang Y, Ali W, Cavallo JA, van der Velden A, Tian H, Di Paolo G, Nieswandt B, et al. (2012). Key roles for the lipid signaling enzyme phospholipase d1 in the tumor microenvironment during tumor angiogenesis and metastasis. Sci Signal 5, ra79. [DOI] [PMC free article] [PubMed] [Google Scholar]
- Dickson CJ, Madej BD, Skjevik AA, Betz RM, Teigen K, Gould IR, and Walker RC (2014). Lipid14: The Amber Lipid Force Field. J Chem Theory Comput 10, 865–879. [DOI] [PMC free article] [PubMed] [Google Scholar]
- Dupont S, Morsut L, Aragona M, Enzo E, Giulitti S, Cordenonsi M, Zanconato F, Le Digabel J, Forcato M, Bicciato S, et al. (2011). Role of YAP/TAZ in mechanotransduction. Nature 474, 179–183. [DOI] [PubMed] [Google Scholar]
- Fang Y, Vilella-Bach M, Bachmann R, Flanigan A, and Chen J (2001). Phosphatidic acid- mediated mitogenic activation of mTOR signaling. Science 294, 1942–1945. [DOI] [PubMed] [Google Scholar]
- Frohman MA (2015). The phospholipase D superfamily as therapeutic targets. Trends Pharmacol Sci 36, 137–144. [DOI] [PMC free article] [PubMed] [Google Scholar]
- Gong R, Hong AW, Plouffe SW, Zhao B, Liu G, Yu FX, Xu Y, and Guan KL(2014). Opposing roles of conventional and novel PKC isoforms in Hippo-YAP pathway regulation. Cell Res 25, 985–988. [DOI] [PMC free article] [PubMed] [Google Scholar]
- Goodman CA, Dietz JM, Jacobs BL, McNally RM, You JS, and Hornberger TA (2015). Yes-Associated Protein is up-regulated by mechanical overload and is sufficient to induce skeletal muscle hypertrophy. FEBS Lett 589, 1491–1497. [DOI] [PMC free article] [PubMed] [Google Scholar]
- Halder G, and Johnson RL (2011). Hippo signaling: growth control and beyond. Development 138, 9–22. [DOI] [PMC free article] [PubMed] [Google Scholar]
- Hammond SM, Jenco JM, Nakashima S, Cadwallader K, Gu Q, Cook S, Nozawa Y, Prestwich GD, Frohman MA, and Morris AJ (1997). Characterization of two alternately spliced forms of phospholipase D1. Activation of the purified enzymes by phosphatidylinositol 4,5-bisphosphate, ADP-ribosylation factor, and Rho family monomeric GTP-binding proteins and protein kinase C-alpha. J Biol Chem 272, 3860–3868. [DOI] [PubMed] [Google Scholar]
- Hess JA, Ross AH, Qiu RG, Symons M, and Exton JH (1997). Role of Rho family proteins in phospholipase D activation by growth factors. J Biol Chem 272, 1615–1620. [DOI] [PubMed] [Google Scholar]
- Jaafar R, De Larichaudy J, Chanon S, Euthine V, Durand C, Naro F, Bertolino P, Vidal H, Lefai E, and Nemoz G (2013). Phospholipase D regulates the size of skeletal muscle cells through the activation of mTOR signaling. Cell Commun Signal 11, 55. [DOI] [PMC free article] [PubMed] [Google Scholar]
- Joy JM, Gundermann DM, Lowery RP, Jager R, McCleary SA, Purpura M, Roberts MD, Wilson SM, Hornberger TA, and Wilson JM (2014). Phosphatidic acid enhances mTOR signaling and resistance exercise induced hypertrophy. Nutr Metab (Lond) 11, 29. [DOI] [PMC free article] [PubMed] [Google Scholar]
- Kuribara H, Tago K, Yokozeki T, Sasaki T, Takai Y, Morii N, Narumiya S, Katada T, and Kanaho Y (1995). Synergistic activation of rat brain phospholipase D by ADP-ribosylation factor and rhoA p21, and its inhibition by Clostridium botulinum C3 exoenzyme. J Biol Chem 270, 25667–25671. [DOI] [PubMed] [Google Scholar]
- Lemmon MA (2008). Membrane recognition by phospholipid-binding domains. Nat Rev Mol Cell Biol 9, 99–111. [DOI] [PubMed] [Google Scholar]
- Li S, Cho YS, Yue T, Ip YT, and Jiang J (2015). Overlapping functions of the MAP4K family kinases Hppy and Msn in Hippo signaling. Cell Discov 1, 15038. [DOI] [PMC free article] [PubMed] [Google Scholar]
- Maier JA, Martinez C, Kasavajhala K, Wickstrom L, Hauser KE, and Simmerling C (2015). ff14SB: Improving the Accuracy of Protein Side Chain and Backbone Parameters from ff99SB. J Chem Theory Comput 11, 3696–3713. [DOI] [PMC free article] [PubMed] [Google Scholar]
- Malcolm KC, Elliott CM, and Exton JH (1996). Evidence for Rho-mediated agonist stimulation of phospholipase D in rat1 fibroblasts. Effects of Clostridium botulinum C3 exoenzyme. J Biol Chem 271, 13135–13139. [DOI] [PubMed] [Google Scholar]
- Malcolm KC, Ross AH, Qiu RG, Symons M, and Exton JH (1994). Activation of rat liver phospholipase D by the small GTP-binding protein RhoA. J Biol Chem 269, 25951–25954. [PubMed] [Google Scholar]
- Mani T, Hennigan RF, Foster LA, Conrady DG, Herr AB, and Ip W (2011). FERM domain phosphoinositide binding targets merlin to the membrane and is essential for its growth- suppressive function. Mol Cell Biol 31, 1983–1996. [DOI] [PMC free article] [PubMed] [Google Scholar]
- Meng Z, Moroishi T, Mottier-Pavie V, Plouffe SW, Hansen CG, Hong AW, Park HW, Mo JS, Lu W, Lu S, et al. (2015). MAP4K family kinases act in parallel to MST1/2 to activate LATS1/2 in the Hippo pathway. Nat Commun 6, 8357. [DOI] [PMC free article] [PubMed] [Google Scholar]
- Miller E, Yang J, DeRan M, Wu C, Su AI, Bonamy GM, Liu J, Peters EC, and Wu X (2012). Identification of serum-derived sphingosine-1-phosphate as a small molecule regulator of YAP. Chem Biol 19, 955–962. [DOI] [PubMed] [Google Scholar]
- Moroishi T, Hayashi T, Pan WW, Fujita Y, Holt MV, Qin J, Carson DA, and Guan KL (2016). The Hippo Pathway Kinases LATS1/2 Suppress Cancer Immunity. Cell 167, 15251539 e1517. [DOI] [PMC free article] [PubMed] [Google Scholar]
- Ni L, Zheng Y, Hara M, Pan D, and Luo X (2015). Structural basis for Mob1-dependent activation of the core Mst-Lats kinase cascade in Hippo signaling. Genes Dev 29, 1416–1431. [DOI] [PMC free article] [PubMed] [Google Scholar]
- Ohta H, Sato K, Murata N, Damirin A, Malchinkhuu E, Kon J, Kimura T, Tobo M, Yamazaki Y, Watanabe T, et al. (2003). Ki16425, a subtype-selective antagonist for EDG- family lysophosphatidic acid receptors. Mol Pharmacol 64, 994–1005. [DOI] [PubMed] [Google Scholar]
- Pan D (2010). The hippo signaling pathway in development and cancer. Dev Cell 19, 491–505. [DOI] [PMC free article] [PubMed] [Google Scholar]
- Peng X, and Frohman MA (2012). Mammalian phospholipase D physiological and pathological roles. Acta Physiol (Oxf) 204, 219–226. [DOI] [PMC free article] [PubMed] [Google Scholar]
- Peters MB, Yang Y, Wang B, Fusti-Molnar L, Weaver MN, and Merz KM Jr. (2010). Structural Survey of Zinc Containing Proteins and the Development of the Zinc AMBER Force Field (ZAFF). J Chem Theory Comput 6, 2935–2947. [DOI] [PMC free article] [PubMed] [Google Scholar]
- Pettersen EF, Goddard TD, Huang CC, Couch GS, Greenblatt DM, Meng EC, and Ferrin TE (2004). UCSF Chimera--a visualization system for exploratory research and analysis. J Comput Chem 25, 1605–1612. [DOI] [PubMed] [Google Scholar]
- Piccolo S, Dupont S, and Cordenonsi M (2014). The biology of YAP/TAZ: hippo signaling and beyond. Physiol Rev 94, 1287–1312. [DOI] [PubMed] [Google Scholar]
- Plouffe SW, Meng Z, Lin KC, Lin B, Hong AW, Chun JV, and Guan KL (2016). Characterization of Hippo Pathway Components by Gene Inactivation. Mol Cell 64, 993–1008. [DOI] [PMC free article] [PubMed] [Google Scholar]
- Sali A, and Blundell TL (1993). Comparative protein modelling by satisfaction of spatial restraints. J Mol Biol 234, 779–815. [DOI] [PubMed] [Google Scholar]
- Sanjana NE, Shalem O, and Zhang F (2014). Improved vectors and genome-wide libraries for CRISPR screening. Nat Methods 11, 783–784. [DOI] [PMC free article] [PubMed] [Google Scholar]
- Scott SA, Selvy PE, Buck JR, Cho HP, Criswell TL, Thomas AL, Armstrong MD, Arteaga CL, Lindsley CW, and Brown HA (2009). Design of isoform-selective phospholipase D inhibitors that modulate cancer cell invasiveness. Nat Chem Biol 5, 108–117. [DOI] [PMC free article] [PubMed] [Google Scholar]
- Shin JJ, and Loewen CJ (2011). Putting the pH into phosphatidic acid signaling. BMC Biol 9, 85. [DOI] [PMC free article] [PubMed] [Google Scholar]
- Sonoda H, Aoki J, Hiramatsu T, Ishida M, Bandoh K, Nagai Y, Taguchi R, Inoue K, and Arai H (2002). A novel phosphatidic acid-selective phospholipase A1 that produces lysophosphatidic acid. J Biol Chem 277, 34254–34263. [DOI] [PubMed] [Google Scholar]
- Sorrentino G, Ruggeri N, Specchia V, Cordenonsi M, Mano M, Dupont S, Manfrin A, Ingallina E, Sommaggio R, Piazza S, et al. (2014). Metabolic control of YAP and TAZ by the mevalonate pathway. Nat Cell Biol 16, 357–366. [DOI] [PubMed] [Google Scholar]
- Stace CL, and Ktistakis NT (2006). Phosphatidic acid- and phosphatidylserine-binding proteins. Biochim Biophys Acta 1761, 913–926. [DOI] [PubMed] [Google Scholar]
- Su W, Yeku O, Olepu S, Genna A, Park JS, Ren H, Du G, Gelb MH, Morris AJ, and Frohman MA (2009). 5-Fluoro-2-indolyl des-chlorohalopemide (FIPI), a phospholipase D pharmacological inhibitor that alters cell spreading and inhibits chemotaxis. Mol Pharmacol 75, 437–446. [DOI] [PMC free article] [PubMed] [Google Scholar]
- Sung TC, Roper RL, Zhang Y, Rudge SA, Temel R, Hammond SM, Morris AJ, Moss B, Engebrecht J, and Frohman MA (1997). Mutagenesis of phospholipase D defines a superfamily including a trans-Golgi viral protein required for poxvirus pathogenicity. EMBO J 16, 4519–4530. [DOI] [PMC free article] [PubMed] [Google Scholar]
- Tay LW, Wang Z, and Du G (2017). Analysis of Phosphatidic Acid Binding and Regulation of PIPKI In Vitro and in Intact Cells. Methods Enzymol 583, 359–374. [DOI] [PubMed] [Google Scholar]
- Trott O, and Olson AJ (2010). AutoDock Vina: improving the speed and accuracy of docking with a new scoring function, efficient optimization, and multithreading. J Comput Chem 31, 455461. [DOI] [PMC free article] [PubMed] [Google Scholar]
- Walker SJ, and Brown HA (2002). Specificity of Rho insert-mediated activation of phospholipase D1. J Biol Chem 277, 26260–26267. [DOI] [PubMed] [Google Scholar]
- Wang T, Wei JJ, Sabatini DM, and Lander ES (2014a). Genetic screens in human cells using the CRISPR-Cas9 system. Science 343, 80–84. [DOI] [PMC free article] [PubMed] [Google Scholar]
- Wang W, Chen L, Ding Y, Jin J, and Liao K (2008). Centrosome separation driven by actin-microfilaments during mitosis is mediated by centrosome-associated tyrosine- phosphorylated cortactin. J Cell Sci 121, 1334–1343. [DOI] [PubMed] [Google Scholar]
- Wang W, Huang J, and Chen J (2011). Angiomotin-like proteins associate with and negatively regulate YAP1. J Biol Chem 286, 4364–4370. [DOI] [PMC free article] [PubMed] [Google Scholar]
- Wang W, Huang J, Wang X, Yuan J, Li X, Feng L, Park JI, and Chen J (2012). PTPN14 is required for the density-dependent control of YAP1. Genes Dev 26, 1959–1971. [DOI] [PMC free article] [PubMed] [Google Scholar]
- Wang W, Li X, Huang J, Feng L, Dolinta KG, and Chen J (2014b). Defining the proteinprotein interaction network of the human hippo pathway. Mol Cell Proteomics 13, 119–131. [DOI] [PMC free article] [PubMed] [Google Scholar]
- Wang W, Xiao ZD, Li X, Aziz KE, Gan B, Johnson RL, and Chen J (2015). AMPK modulates Hippo pathway activity to regulate energy homeostasis. Nat Cell Biol 17, 490–499. [DOI] [PMC free article] [PubMed] [Google Scholar]
- Wang Z, Wu Y, Wang H, Zhang Y, Mei L, Fang X, Zhang X, Zhang F, Chen H, Liu Y, et al. (2014c). Interplay of mevalonate and Hippo pathways regulates RHAMM transcription via YAP to modulate breast cancer cell motility. Proc Natl Acad Sci U S A 111, E89–98. [DOI] [PMC free article] [PubMed] [Google Scholar]
- Watt KI, Turner BJ, Hagg A, Zhang X, Davey JR, Qian H, Beyer C, Winbanks CE, Harvey KF, and Gregorevic P (2015). The Hippo pathway effector YAP is a critical regulator of skeletal muscle fibre size. Nat Commun 6, 6048. [DOI] [PubMed] [Google Scholar]
- Wei X, Shimizu T, and Lai ZC (2007). Mob as tumor suppressor is activated by Hippo kinase for growth inhibition in Drosophila. EMBO J 26, 1772–1781. [DOI] [PMC free article] [PubMed] [Google Scholar]
- Yamazaki M, Zhang Y, Watanabe H, Yokozeki T, Ohno S, Kaibuchi K, Shibata H, Mukai H, Ono Y, Frohman MA, et al. (1999). Interaction of the small G protein RhoA with the C terminus of human phospholipase D1. J Biol Chem 274, 6035–6038. [DOI] [PubMed] [Google Scholar]
- Yang SF, Freer S, and Benson AA (1967). Transphosphatidylation by phospholipase D. J Biol Chem 242, 477–484. [PubMed] [Google Scholar]
- Yi J, Lu L, Yanger K, Wang W, Sohn BH, Stanger BZ, Zhang M, Martin JF, Ajani JA, Chen J, et al. (2016). Large tumor suppressor homologs 1 and 2 regulate mouse liver progenitor cell proliferation and maturation through antagonism of the coactivators YAP and TAZ. Hepatology 64, 1757–1772. [DOI] [PMC free article] [PubMed] [Google Scholar]
- Yin F, Yu J, Zheng Y, Chen Q, Zhang N, and Pan D (2013). Spatial organization of Hippo signaling at the plasma membrane mediated by the tumor suppressor Merlin/NF2. Cell 154, 1342–1355. [DOI] [PMC free article] [PubMed] [Google Scholar]
- Yoon MS, and Chen J (2008). PLD regulates myoblast differentiation through the mTOR- IGF2 pathway. J Cell Sci 121, 282–289. [DOI] [PubMed] [Google Scholar]
- Yoon MS, and Chen J (2013). Distinct amino acid-sensing mTOR pathways regulate skeletal myogenesis. Mol Biol Cell 24, 3754–3763. [DOI] [PMC free article] [PubMed] [Google Scholar]
- Yoon MS, Sun Y, Arauz E, Jiang Y, and Chen J (2011). Phosphatidic acid activates mammalian target of rapamycin complex 1 (mTORC1) kinase by displacing FK506 binding protein 38 (FKBP38) and exerting an allosteric effect. J Biol Chem 286, 29568–29574. [DOI] [PMC free article] [PubMed] [Google Scholar]
- You JS, Lincoln HC, Kim CR, Frey JW, Goodman CA, Zhong XP, and Hornberger TA (2014). The role of diacylglycerol kinase zeta and phosphatidic acid in the mechanical activation of mammalian target of rapamycin (mTOR) signaling and skeletal muscle hypertrophy. J Biol Chem 289, 1551–1563. [DOI] [PMC free article] [PubMed] [Google Scholar]
- Yu FX, and Guan KL (2013). The Hippo pathway: regulators and regulations. Genes Dev 27, 355–371. [DOI] [PMC free article] [PubMed] [Google Scholar]
- Yu FX, Zhao B, and Guan KL (2015a). Hippo Pathway in Organ Size Control, Tissue Homeostasis, and Cancer. Cell 163, 811–828. [DOI] [PMC free article] [PubMed] [Google Scholar]
- Yu FX, Zhao B, Panupinthu N, Jewell JL, Lian I, Wang LH, Zhao J, Yuan H, Tumaneng K, Li H, et al. (2012). Regulation of the Hippo-YAP pathway by G-protein- coupled receptor signaling. Cell 150, 780–791. [DOI] [PMC free article] [PubMed] [Google Scholar]
- Yu T, Bachman J, and Lai ZC (2015b). Mutation analysis of large tumor suppressor genes LATS1 and LATS2 supports a tumor suppressor role in human cancer. Protein Cell 6, 6–11. [DOI] [PMC free article] [PubMed] [Google Scholar]
- Zanconato F, Cordenonsi M, and Piccolo S (2016). YAP/TAZ at the Roots of Cancer. Cancer Cell 29, 783–803. [DOI] [PMC free article] [PubMed] [Google Scholar]
- Zhang F, Wang Z, Lu M, Yonekubo Y, Liang X, Zhang Y, Wu P, Zhou Y, Grinstein S, Hancock JF, et al. (2014). Temporal production of the signaling lipid phosphatidic acid by phospholipase D2 determines the output of extracellular signal-regulated kinase signaling in cancer cells. Mol Cell Biol 34, 84–95. [DOI] [PMC free article] [PubMed] [Google Scholar]
- Zhao B, Li L, Wang L, Wang CY, Yu J, and Guan KL (2012). Cell detachment activates the Hippo pathway via cytoskeleton reorganization to induce anoikis. Genes Dev 26, 54–68. [DOI] [PMC free article] [PubMed] [Google Scholar]
- Zhao B, Wei X, Li W, Udan RS, Yang Q, Kim J, Xie J, Ikenoue T, Yu J, Li L, et al. (2007). Inactivation of YAP oncoprotein by the Hippo pathway is involved in cell contact inhibition and tissue growth control. Genes Dev 21, 2747–2761. [DOI] [PMC free article] [PubMed] [Google Scholar]
- Zheng Y, Wang W, Liu B, Deng H, Uster E, and Pan D (2015). Identification of Happyhour/MAP4K as Alternative Hpo/Mst-like Kinases in the Hippo Kinase Cascade. Dev Cell 34, 642–655. [DOI] [PMC free article] [PubMed] [Google Scholar]
Associated Data
This section collects any data citations, data availability statements, or supplementary materials included in this article.