

Abstract
Purpose
To estimate diagnostic yield and genotype-phenotype correlations in a cohort of 811 patients with lissencephaly or subcortical band heterotopia.
Methods
We collected DNA from 756 children with lissencephaly over 30 years. Many were tested for deletion 17p13.3 and mutations of LIS1, DCX and ARX, but few other genes. Among those tested, 216 remained unsolved and were tested by a targeted panel of 17 genes (ACTB, ACTG1, ARX, CRADD, DCX, LIS1, TUBA1A, TUBA8, TUBB2B, TUBB, TUBB3, TUBG1, KIF2A, KIF5C, DYNC1H1, RELN and VLDLR) or by whole exome sequencing. 55 patients studied in another institution were added as a validation cohort.
Results
The overall mutation frequency in the entire cohort was 81%. LIS1 accounted for 40% of patients, followed by DCX (23%), TUBA1A (5%), and DYNC1H1 (3%). Other genes accounted for 1% or less of patients. 19% remained unsolved, which suggests that several additional genes remain to be discovered. The majority of unsolved patients had posterior pachygyria, subcortical band heterotopia or mild frontal pachygyria.
Conclusions
The brain-imaging pattern correlates with mutations in single lissencephaly-associated genes, as well as in biological pathways. We propose the first LIS classification system based on the underlying molecular mechanisms.
Keywords: lissencephaly, subcortical band heterotopia, tubulinopathy, actinopathy, reelinopathy
INTRODUCTION
Lissencephaly (LIS) comprises a spectrum of malformations of cortical development caused by deficient neuronal migration with one notable exception related to deficient apoptosis. The LIS spectrum includes agyria defined as cortical regions with sulci >3 cm apart, pachygyria defined as abnormally wide gyri with sulci 1.5-3 cm apart, and subcortical band heterotopia (SBH) defined as longitudinal bands of gray matter located deep to the cerebral cortex and separated from it by a thin layer of white matter.1 The cerebral cortex in agyria and pachygyria can be either very thick (10-20 mm in thick or classic LIS), or less often only mildly thick (5-10 mm in “thin” LIS). We recently revised our LIS classification system to allow more reliable prediction of the most likely causative genes using brain-imaging patterns.1
All patients with LIS have intellectual disability, but the severity differs significantly based on the subtype of LIS from profound disability and limited survival with diffuse agyria to mild intellectual or learning disability in patients with partial SBH. Seizures occur in most patients with LIS.1,2
LIS has a strong genetic basis.2 To date 20 genes have been associated with LIS (Figure 1, and Supplementary Table 1 with references). Several studies have examined mutation frequency and genotype-phenotype correlation for LIS1, DCX and TUBA1A.3-7 However, 11 of 20 LIS-associated genes have been discovered during the past six years, so little data is available regarding the prevalence of mutations and genotype-phenotype correlations. An accurate estimation of the contributions of different genes to LIS has proven difficult,2 with most data coming from studies of specific subtypes of LIS or all malformations of cortical development combined.8-10
Figure 1.
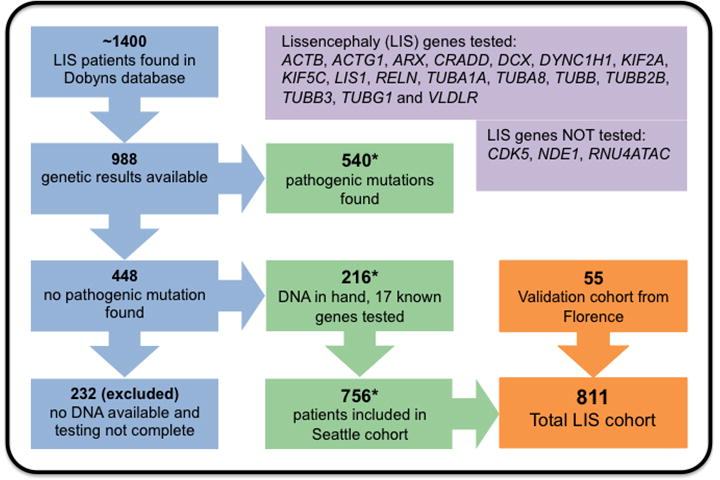
Flow chart describing subject selection for the primary study cohort (blue-green-orange panels), and lissencephaly genes tested and not tested (purple panels).
Here we report results of targeted sequencing of 17 LIS causative genes in 216 children with unexplained LIS, and integrate these with prior results from our 30-year cohort of 988 LIS patients with any testing data available. These results are compared with the specific imaging patterns observed using an expanded imaging classification system.1
MATERIALS AND METHODS
Subjects
Our Seattle-based research database contains information on ~1400 individuals with LIS. We excluded another ~60 patients with MLIS defined as birth OFC more than 3 SD below the mean, as this group is much less well characterized with only rare causative genes known (i.e. KATNB1, NDE1, RNU4ATAC). Results of previous genetic testing were available for 988 patients, including 540 positive and 448 negative results (Figure 1). Most unsolved patients were tested for mutations in LIS1 and DCX, and some for mutations in ARX, TUBA1A, ACTB or ACTG1. We had in hand DNA samples from 216 unsolved patients including 193 sporadic subjects and 10 multiplex families. From this group, testing was negative for LIS1 including deletion 17p13.3 in 109, DCX in 101, and TUBA1A in 67 patients, while 72 (33%) had no prior genetic testing. The remaining 232 patients with incomplete testing and no DNA sample were excluded, leaving us with a primary LIS study cohort of 756 patients. We included another 55 patients studied at A. Meyer Children’s Hospital in Florence, Italy as a validation cohort. Institutional review boards at The University of Chicago, Seattle Children’s Hospital, and Meyer Children’s Hospital approved this study.
Historical Results
About 75% of positive tests were performed in the Ledbetter (prior to 2004) or Dobyns (2004 onward) labs, and about 25% at outside labs. The tests included chromosome analysis, fluorescence in situ hybridization for deletion 17p13.3, chromosome microarrays, MLPA for LIS1, DCX and RELN, Sanger sequencing of single genes (LIS1, DCX, ARX, TUBA1A, TUBB2B, RELN, VLDLR, ACTB and ACTG1), and whole exome sequencing (WES).
Sequencing
We designed a targeted sequencing panel of 17 genes (Figure 1), using single molecule molecular inversion probes (smMIPs).11 We excluded CDK5 as this report appeared after our study was underway,12 and excluded microlissencephaly genes (KATNB1, NDE1, RNU4ATAC) as our cohort did not include patients with matching phenotypes.13-15 Massively parallel sequencing was performed on Illumina HiSeq and MiSeq platforms. Seven patients were studied using WES alone or with smMIPs (Supplementary Methods). Our Florence cohort was studied using a custom designed targeted panel that included all 17 genes.
Assessment of pathogenicity
Variant interpretation was done using American College of Medical Genetics and Genomics (ACMG) and Association for Molecular Pathology (AMP) guidelines, except that we analyzed only variants with allele frequencies <1% in public databases.16
Confirmation
Constitutional and mosaic point mutations were confirmed by Sanger sequencing. Copy number variants were validated using qPCR. Parental samples were available for 70 patients and used for segregation analysis with Sanger sequencing and qPCR. We also used Sanger sequencing for regions with low coverage in the ACTB and ACTG1 genes in patients with frontal-predominant pachygyria. We did not test other low coverage genes in this cohort.
RESULTS
Targeted sequencing and WES identified (likely) pathogenic variants in 74 of 216 (34%) patients (Supplementary Table 1). The total number of mutations and patterns of LIS associated with each gene are shown in Table 2. Detailed molecular and clinical data for mutation positive patients are shown in Supplementary Tables 2 and 3. Mutations of LIS1 or DCX were found in 23 patients in whom prior testing had not been completed. We considered 12 variants to be causative even though ACMG-AMP criteria for pathogenicity classify them as variants of unknown significance (VOUS), mostly due to lack of parental samples. However, consistent imaging phenotypes argue strongly for causality of the variants detected, and we believe that all are in fact pathogenic.
Table 2.
Classification of lissencephaly based on biological networks and brain imaging.
| MRI - cortex: gradient and appearance | MRI - non-cortical brain malformations | ||||||||||
|---|---|---|---|---|---|---|---|---|---|---|---|
| Protein networks | Genes | P>A dysgyria | P>A thick LIS or SBH | Diffuse LIS or SBH | A>P thick LIS or SBH | A>P thin LIS |
TL>P>A thin LIS |
ACC | BG dysplasia | Large tectum | BS-CBLH |
| Tubulins | TUBA1A | ++ | ++ | ++ | ++ | ++ | ++ | ++ | |||
| TUBB2B | ++ | ++ | + | ++ | ++ | ++ | ++ | ||||
| TUBA8 | ++ | + | + | + | |||||||
| TUBB | ++ | + | + | + | ++ | ||||||
| TUBB3 | ++ | + | + | + | ++ | ||||||
| Centrosome-expressed MAPs | LIS1-YWHAE* | ++ | ± | ||||||||
| LIS1 | ++ | ± | |||||||||
| TUBG1 | ++ | ||||||||||
| NDE1 | ++ | ++ | ++ | ||||||||
| Microtubule motor MAPs | DYNC1H1 | ++ | ++ | – | + | (+) | + | + | + | ||
| KIF5C | + | – | + | (+) | + | ||||||
| KIF2A | + | – | + | ||||||||
| Actin and actin-associated MAPs | ACTB | ++ | – | ||||||||
| ACTG1 | ++ | + | – | ||||||||
| DCX | ++ | ++ | ± | ||||||||
| Complex MAPs | CDK5** | + | + | ? | + | + | |||||
| Reelin signaling | RELN | ++ | ++ | ||||||||
| VLDLR | ++ | ++ | |||||||||
| Forebrain | ARX | ++ | ++ | ++ | – | ||||||
| Neuronal apoptosis | CRADD | ++ | – | – | – | – | |||||
Number of “+” represents the frequency of the gradient within each group: ++ frequent, + less frequent, ± rare and mild involvement, (+) mimics phenotype.
ACC, agenesis of the corpus callosum; Actin-AAP, actin and actin associated proteins; AP, anterior predominant gradient indicates lissencephaly most severe in frontal poles and anterior frontal lobes but includes also lissencephaly extended through the posterior frontal lobes; BG, basal ganglia; BS-CBLH, brain stem and cerebellar hypoplasia; Forebrain, forebrain transcriptional regulator; LIS, lissencephaly; MAPs, microtubules associated proteins; PA, posterior predominant gradient indicates lissencephaly most severe in the parietal and occipital lobes including occipital poles; this group includes also perisylvian lissencephaly; TL, temporal predominant gradient indicates lissencephaly most severe in the temporal lobes and next most severe in parietal and occipital lobes: SBH, subcortical band heterotopia;
LIS1-YWHAE indicated deletion 17p13.3 (400kb Miller-Dicker critical region);
provisionally classified as a complex MAP due functional links with LIS1, NDE1, DYNC1H1, DCX, and TUBG1, and imaging features (CBLH, ACC and severe tectal hyperplasia) that cross groups.
Mutation distribution in our entire cohort and validation cohort
We next collated data on mutations detected in 540 subjects prior to this study, and combined them with results of our smMIP sequencing panel to show mutations in 614 of 756 (81%) patients (Figure 2). Given the long accrual time and different testing methods used, these results could reflect ascertainment and testing bias. To address this question, we compared data in the full cohort with more recent data from Seattle (Dobyns lab) and from the A Meyer Children’s Hospital in Florence, Italy (Guerrini lab), finding mutations in 59 of 70 (84%) and 41 of 55 (76%) patients, respectively (Figure 2B). Notably, the mutation frequencies closely overlap across all three cohorts, including the fraction of patients with no mutations detected. The most commonly mutated genes across all three cohorts were LIS1, DCX, DYNC1H1 and TUBA1A. We found a higher proportion of more severe phenotypes (i.e. mutations in TUBA1A) and more multiple congenital anomaly syndromes (i.e. mutations in ARX, ACTB or ACTG1) in the Dobyns cohort.
Figure 2.
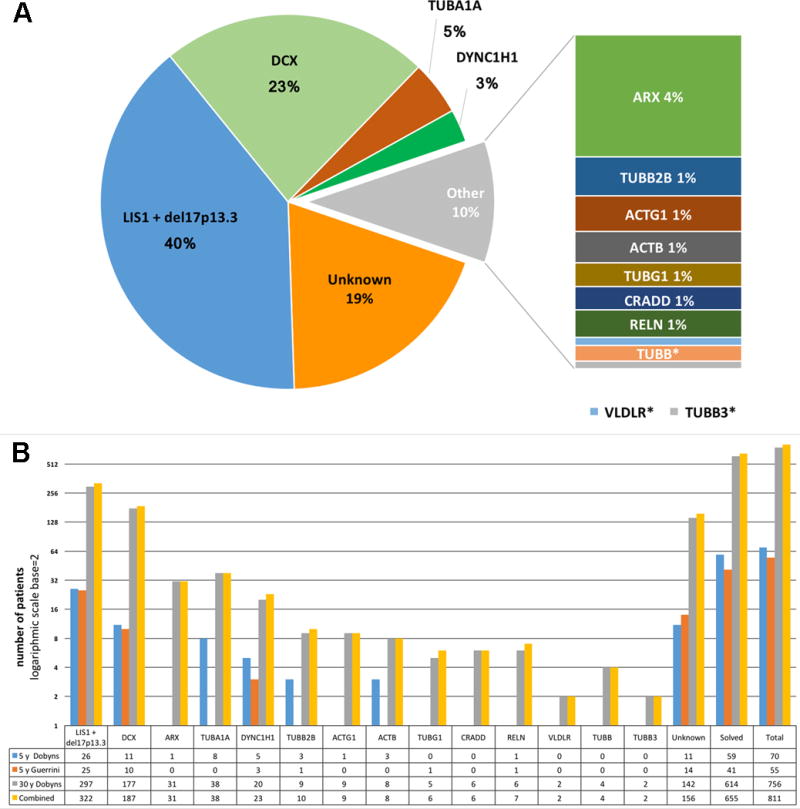
Number and frequency of mutations detected in lissencephaly (LIS) cohorts. The upper panel (A) shows the number and relative proportion (on a log base 2 scale) of mutations in our LIS cohorts: 5-year Dobyns cohort represents the subset of subjects with LIS recruited in Seattle between 2010 and 2015, 5-year Guerrini cohort represents an independent cohort ascertained at A. Meyer Children’s Hospital in Florence; 30-year Dobyns cohort includes all patients with LIS ascertained in the Ledbetter or Dobyns labs since 1982; the Combined cohort sums the 30-year Dobyns and 5-year Guerrini cohorts. The table below the graph shows the exact number of patients carrying mutations in each gene. The lower panel (B) is a pie chart showing the diagnostic yield per gene in the Combined cohort. *Mutations in TUBB, TUBB3 and VLDLR each accounted for less than one percent of subjects.
Diagnostic yield
We detected causative mutations in 655 of 811 (81%) patients in our combined LIS cohort, and found that mutations of four genes – LIS1, DCX, TUBA1A and DYNC1H1 in this order – account for 571 of 811 (70.5%) individuals with LIS. The number of children with severe ARX mutations is also high, likely the result of active recruitment. All other LIS genes had frequencies of ~1% or less. Even with testing of 17 LIS genes, about 20% of patients remain unsolved. While some may have undetected mutations of known LIS genes, we expect that most have mutations of as yet unknown genes.
Unsolved phenotypes
As expected, the rate of detecting mutations differed significantly between phenotype groups. We found pathogenic mutations in 97% of children with diffuse agyria, 95% with diffuse SBH, 92% with posterior-predominant mixed agyria-pachygyria (mostly LIS1), 72-75% with diffuse pachygyria (anterior- or posterior-predominant), and 65% with imaging findings suggestive of tubulinopathies (Table 1). Thus, several and possibly many more classic LIS and SBH genes have yet to be identified. For example, a homozygous truncating mutation of CDK5 was just reported in 4 children with severe LIS and cerebellar hypoplasia from a large consanguineous family.12
Table 1.
Genotype-phenotype correlation in the combined cohort of 811 LIS patients tested for known LIS-associated genes.
| Protein network | CEN | TUB | MOTOR | AAP | Reelin | FORE | APOP | Solved | Unk | Total | ||||||||||||
|---|---|---|---|---|---|---|---|---|---|---|---|---|---|---|---|---|---|---|---|---|---|---|
| Gene | LIS1- YWHAE |
LIS1 | TUBG1 | TUBA1A | TUBB2B | TUBB | TUBB3 | TUBA8 | KIF5C | KIF2A | DYNC1H1 | DCX (m) |
DCX (f) |
ACTB | ACTG1 | RELN | VLDLR | ARX | CRADD | - | - | - |
| Total # | 75 | 247 | 6 | 38 | 10 | 4 | 2 | 0 | 0 | 0 | 23 | 73 | 114 | 8 | 9 | 7 | 2 | 31 | 6 | 655 (81%) | 156 (19%) | 811 |
| Lissencephaly with cerebellar hypoplasia, Agyria diffuse (thick or thin cortex) | 9 | 1 | 10 (67%) | 5 (33%) | 15 | |||||||||||||||||
| Classic thick lissencephaly | ||||||||||||||||||||||
| Agyria diffuse | 75 | 17 | 25 | 1 | 1 | 119 (97%) | 4 (3%) | 123 | ||||||||||||||
| Agyria-pachygyria p>a | 130 | 5 | 135 (92%) | 11 (8%) | 146 | |||||||||||||||||
| Pachygyria p>a | 48 | 6 | 8 | 62 (75%) | 21 (25%) | 83 | ||||||||||||||||
| Pachygyria p>a with non‐cortical malformations | 1 | 5 | 1 | 2 | 9 (90%) | 1 (10%) | 10 | |||||||||||||||
| Agyria-pachygyria a>p | 1 | 4 | 5 (83%) | 1 (17%) | 6 | |||||||||||||||||
| Pachygyria a>p | 6 | 17 | 4 | 3 | 3 | 33 (72%) | 13 (28%) | 46 | ||||||||||||||
| Pachygyria a>p with non‐cortical malformations | 1 | 1 (100%) | 0 | 1 | ||||||||||||||||||
| Pachygyria-band a>p (mixed) | 9 | 4 | 4 | 6 | 23 (88%) | 3 (12%) | 26 | |||||||||||||||
| Tubulinopathy-related dysgyria | 11 | 8 | 2 | 1 | 7 | 29 (66%) | 15 (34%) | 44 | ||||||||||||||
| Subcortical band heterotopia | ||||||||||||||||||||||
| SBH diffuse thick | 5 | 57 | 62 (95%) | 3 (5%) | 65 | |||||||||||||||||
| SBH diffuse thin | 2 | 8 | 10 (71%) | 4 (29%) | 14 | |||||||||||||||||
| SBH partial p>a | 10 | 10 (38%) | 16 (62%) | 26 | ||||||||||||||||||
| SBH partial a>p | 3 | 8 | 11 (85%) | 2 (15%) | 13 | |||||||||||||||||
| SBH unspecified | 30 | 30 (81%) | 7 (19%) | 37 | ||||||||||||||||||
| Thin undulating lissencephaly | ||||||||||||||||||||||
| Pachygyria a>p thin with cerebellar hypoplasia2 | 7 | 2 | 9 (75%) | 3 (25%) | 12 | |||||||||||||||||
| Pachygyria a>p thin with normal cerebellum | 6 | 6 (30%) | 14 (70%) | 20 | ||||||||||||||||||
| Pachygyria t>p>a thin with ACC, abnormal WM | 31 | 31 (97%) | 1 (3%) | 32 | ||||||||||||||||||
| Microlissencephaly (MLIS) | ||||||||||||||||||||||
| MLIS with cerebellar hypoplasia (TUB features) | 4 | 2 | 1 | 7 (100%) | 0 | 7 | ||||||||||||||||
| MLIS with MOPD1 | 0 | |||||||||||||||||||||
| MLIS Barth type3 | 0 | |||||||||||||||||||||
| LIS unspecified | 41 | 3 | 8 | 2 | 54 (64%) | 31 (36%) | 85 | |||||||||||||||
gene was not tested.
Abbreviations: a>p, anterior predominant gradient; AAP, actin and actin-associated MAPs; ACC, agenesis of the corpus callosum; CEN, centrosome expressed MAPs; CMX - complex MAPs; FORE, forebrain expressed transcription factors; MLIS, microlissencephaly; MOPD, microcephalic osteodysplastic primordial dwarfism; MOTOR, microtubule motor proteins; p>a, posterior predominant gradient; Reelin, Reelin signaling pathway; SBH, subcortical band heterotopia; t>p>a, temporal predominant gradient (pachygyria is most prominent over the temporal lobes); TUB, tubulin structural proteins (alpha and beta); Unk, unknown; WM, white matter.
We identified mutations in posterior predominant SBH in only 2 of 15 (13%) patients, both with mosaic LIS1 mutations. A recent report described both germline and mosaic mutations of STX7 in a family with three affected individuals.17 And we found CRADD mutations in 6 of 20 individuals with the newest subtype of LIS – anterior predominant thin (undulating) LIS with normal cerebellum.11
Biological network based classification
We next reversed the axes of Table 1 to organize LIS phenotypes based on their associated genes, and separated the 20 genes into 8 groups based on shared intracellular localization, protein function and, whenever possible, shared LIS pattern on brain imaging, a process that was facilitated by our recent analysis of LIS phenotypes (Table 2).1 For some groups, the shared function was obvious such as microtubule structural proteins (alpha and beta tubulins), and the Reelin signaling pathway (RELN, VLDLR).
The most difficult proved to be the 9 microtubule-associated proteins (MAPs), as several have multiple functions in the cell, especially LIS1 and DCX, and the imaging patterns differed. We placed TUBG1 and LIS1 (plus the LIS1 modifier YWHAE) in a centrosome-associated MAP group as both are highly expressed at the centrosome and share the same posterior predominant thick LIS pattern, especially at the mild end of the LIS1 spectrum. NDE1 is also expressed at the centrosome. The phenotype is more severe than LIS1 because of severe congenital microcephaly, but requires biallelic mutations. In mouse, biallelic Lis1 mutations with 35% residual Lis1 expression also result in microcephaly.18 We placed the two actin structural proteins in an actin-based group, and noted that both are associated with frontal predominant thick LIS. This same uncommon pattern occurs with mild mutations of DCX. However, we expanded this group to include DCX only after several reports showed that DCX, while also interacting with microtubules, functions to regulate the actin cytoskeleton.19,20 Of course, the placement of these genes will need to be re-visited as knowledge increases.
DISCUSSION
Our work represents the first systematic study of a nearly complete set of known causal genes in a large well-studied LIS cohort, finding mutations in 74 of 216 (35%) unexplained and partially pretested LIS patients (Table 1) by targeted or WES sequencing. Our genetic testing results allow detailed genotype-phenotype analysis for individual genes as well as gene groups. In the following sections we discuss the mutation frequency and imaging patterns seen with individual genes and groups, and provide further review of previous studies and comments regarding mosaicism in the Supplementary Discussion.
Centrosome-expressed microtubule associated proteins (MAPs)
This model group includes the LIS1, YWHAE, TUBG1 and NDE1 genes. Despite the diversity of LIS1 functions, we classified LIS1 here based on phenotypic overlap with TUBG1. With no exceptions, mutations in LIS1 and TUBG1 cause posterior predominant thick LIS. Deletions of both LIS1 and YWHAE cause near complete agyria with no clear gradient. Non-cortical malformations were uncommon and usually not severe, except for NDE1.
We found heterozygous deletions or mutations of LIS1 in 322 of 811 (40%) patients, making this gene by far the most frequent cause of LIS (Table 2). The most common class of LIS1 mutations all result in loss-of-function (n=21 of 23 found in panel sequencing). The phenotype almost always consists of mixed anterior pachygyria and posterior agyria.
Mutations of LIS1 have also been found in posterior-predominant (never diffuse) SBH. These are usually mosaic mutations with intermediate levels of mosaicism (allele frequency ~30%),6 although we have identified two patients with apparent germline mutations. Remarkably, one of the mosaic mutations associated with partial posterior SBH (Arg273*) was previously reported as a constitutional mutation in patients with severe LIS.21 This observation supports the expectation that mosaic mutations of LIS1 result in a less severe SBH phenotype.
Heterozygous mutations of TUBG1 were detected in only 6 of 811 (0.7%) patients, and consisted of two novel substitutions, Ile257Phe and Ser259Leu. The latter was recurrent, seen in 5 of 6 patients including two siblings. Sequencing in blood-derived DNA was negative in both parents, indicating germline mosaicism. Brain imaging in all 6 patients has shown the same posterior predominant pattern of LIS seen with LIS1 mutations, especially less severe LIS1 missense mutations. None of the patients in our cohort demonstrated the severe microcephaly previously reported with TUBG1 mutations.8
Tubulinopathies (TUBs)
To date genes encoding two alpha protein isoforms (TUBA1A and TUBA8) and three beta-tubulin isoforms (TUBB2B, TUBB and TUBB3) have been associated with malformations of cortical development, variously classified as LIS, polymicrogyria, polymicrogyria-like or most recently as tubulinopathy-associated dysgyria.1,4,10,22 We identified mutations in all LIS-associated tubulin genes except for TUBA8, which to date have been reported in only two distantly related consanguineous families.23
Mutations of TUBA1A accounted for ~5% of LIS patients, making it the third most frequent gene in the Dobyns cohort. Among 38 patients with LIS and TUBA1A mutations, we found lissencephaly with cerebellar hypoplasia (LCH) associated with congenital microcephaly and usually thin cortex (14%), LCH with borderline microcephaly or normal head size (35%), and striking TUB-dysgyria (29%). All of these groups have the non-cortical malformations noted above, which are usually severe. Another important subgroup had mixed agyria-pachygyria without non-cortical malformations except mildly small cerebellum similar to the common LIS1 pattern (14%). The latter patients all had mutations of a single codon: Arg402Cys or Arg402His.4
Mutations of TUBB2B were found in 10 of 811 (1.2%) patients, predominantly in those with tubulinopathy-associated dysgyria although one (LR00-059) had severe LCH with thin cortex similar to the most severe TUBA1A pattern. The Glu421Lys mutation was first reported in a family with polymicrogyria and congenital fibrosis of the extraocular muscles (CFEOM).24 We observed the same mutation in a patient (LR03-060) with posterior predominant TUB-dysgyria, enlarged tectum and cerebellar vermis hypoplasia with no evidence for CFEOM. The mutation arose de novo, raising the possibility that the CFEOM phenotype may not be due solely to the TUBB2B mutation. Mutations in TUBB (previously designated TUBB5) and TUBB3 were rare causes in our cohort (<1%), both associated with TUB-dysgyria with either nearly normal head size (n=3) or microcephaly (n=3). While each of the above LIS patterns with non-cortical malformations are recognizable as tubulinopathies, the most likely tubulin gene is usually difficult to predict.
Microtubule motor proteins
To date three genes encoding molecular motors have been associated with LIS: DYNC1H1, KIF2A and KIF5C.8,25-27 We found no mutations in either kinesin, although all reported patients presented with LIS or dysgyria.8,26,27
Mutations of DYNC1H1 were detected in 23 of 811 (3%) patients, making this the fifth most frequently mutated gene in our entire LIS cohort (but likely the fourth most common if we attribute our large number of ARX mutations to active ascertainment). We found 22 missense and one potential splice site mutations. Both parental samples were available for 13 patients, all confirmed to be de novo. Mutations were distributed throughout the entire gene with most comprising novel private mutations (n=14). Two previously reported mutations (Arg309His and Arg3344Gln) were recurrent in our cohort,8,9 and another was a different substitution at one of the same amino acids (Arg3344Trp). The mutations we found were located in tail as well as in motor domains, and were found in each of the six AAA domains as well as the microtubule-binding locus.
Following our initial reports of consistent differences in the gyral pattern between patients with DCX and LIS1 mutations (anterior or posterior predominant, respectively),28 every new LIS gene discovered has also had a consistent gradient. The motor proteins are the first group in which we have seen both posterior‐ and anterior-predominant gradients (Supplementary Figures 1 and 2). Most patients with mutations of DYNC1H1 have a typical posterior-predominant gradient (n=16), but a few have had perisylvian-predominant (posterior variant, n=3) or even anterior-predominant (n=5) LIS. We found no differences in mutations between patients with different LIS gradients.
Two unrelated patients with the same KIF5C mutation (Glu237Lys) had mild frontal LIS or dysgyria,8,26,27 while another with a different mutation (Arg268Ser) had posterior-predominant pachygyria.9 The two patients with KIF2A mutations had posterior-predominant pachygyria.8
Actins and actin associated MAPs (AAPs)
The critical role of the actin cytoskeleton became obvious when mutations of genes encoding for both non-muscle actins – ACTB and ACTG1 – were linked to LIS,29 and was reinforced with recent data showing that DCX, an atypical MAP that enhances microtubule polymerization, stabilizes the microtubule network and has several other functions, dynamically regulates formation of filamentous actin in developing neurons.20 Integrations between the microtubule network and actin cytoskeleton are essential for critical cell functions such as cell division, neuronal migration, and axonal growth.30 DCX binds directly to microtubules and, through interactions with actin-binding proteins such as sphinophilin, interacts with F-actin.19,31 Loss of DCX leads to re-distribution of actin from neuritis and growth cones to the cell body.20
The role of DCX as a cross-linker of microtubules and the actin cytoskeleton is also reflected in DCX-associated phenotypes. The same anterior-predominant thick LIS seen with mutations of ACTB and ACTG1 occurs with less severe mutations of DCX. Further, ACTB and DCX share the same striking histopathology. We previously described the neuropathological features in postmortem brain in both males and females with DCX mutations.32 At the cortical-white matter margin, the thick cortex transitions to multiple small nodules of subcortical heterotopia.32 Remarkably, the exact same pattern was observed in a girl in whom we subsequently detected a pathogenic mutation in ACTB (patient 1 in Forman is LP90-050 in Riviere29,32). Severe especially early truncating mutations of DCX result in severe LIS with near complete agyria, morphologically indistinguishable from the severe phenotypes caused by LIS1-YWHAE deletion or certain TUBA1A mutations. We hypothesize that mild mutations of DCX have a primary impact on the actin cytoskeleton, while more severe mutations disrupt multiple functions, resulting in a more severe LIS phenotype.
DCX was the second most frequently mutated gene, accounting for 23% of patients with LIS including many with SBH. Our targeted sequencing study detected only three additional patients, none of whom had prior genetic testing. All three mutations were previously reported in the literature or listed in the ClinVar database. In males, DCX mutations cause diffuse or frontal-predominant LIS (near complete agyria or frontal pachygyria), and rarely frontal pachygyria with a transition to posterior SBH, or thin SBH.6,28 In females, mutations of DCX cause diffuse or thin, frontal-predominant SBH.
Mutations in ACTB and ACTG1 each accounted for ~1% of patients in our LIS cohort. Both genes are associated with BWCFF. Most patients with ACTG1 mutations, and about 60% with ACTB mutations have mild frontal-predominant pachygyria, sometimes with transition to posterior SBH, an appearance identical to less severe DCX mutations in males. We recently reported that ACTG1 mutations can also cause frontal LIS with unspecific facial features not recognizable as BWCFF.33
Complex MAPs
We classified CKD5 separately because it has so many intracellular functions,34 and because we have data on only a single mutation, which was associated with diffuse LIS on selected images from a single patient.12 Based on the thick cortex, agenesis of the corpus callosum, large tectum, and severe CBLH, the imaging pattern resembles a tubulinopathy, suggesting disruption of multiple signaling pathways.
Reelin signaling
Homozygous or compound heterozygous mutations of the Reelin pathway genes RELN and VLDLR cause a unique pattern of malformations that consists of anterior-predominant “thin” LIS (Supplementary Discussion) with severe hippocampal and cerebellar hypoplasia. RELN mutations were a rare cause of LIS, accounting for only ~1% of patients (Table 1) including two children with compound heterozygous mutations in RELN – one missense mutation plus deletion of a single exon in one girl as well as two truncation mutations in another. At least two deletions of single exons in RELN are listed as rare CNVs in the control population (DGV, accessed January 2017), strongly suggesting that any molecular testing must be accompanied by copy number analysis. All children had anterior predominant thin LIS with diffuse severe cerebellar hypoplasia. However, one boy with a homozygous nonsense mutation (LP96-078, RELN:NM_173054.2:c.1249C>T:p.Gln417*) had a more severe phenotype than any previously reported, and died at home in the second decade (Supplementary Table 3).
Reelin (RELN) is an extracellular protein secreted by Cajal-Retzius cells in developing brain that controls neuronal migration and aggregation through multiple molecular mechanisms.20,35 One of these involves regulation of the actin cytoskeleton via Cofilin activation.20,35 This group and our actin and actin-associated MAP group share anterior predominant LIS patterns.
Forebrain transcription factors
The relatively high frequency of XLAG in our cohort most likely reflects very active recruitment for several years before and after gene discovery. The true frequency is likely to be closer to 1% or less. We provide additional genotype-phenotype analysis in the Supplementary Discussion.
Caspase-mediated apoptosis
We recently identified recessive mutations of CRADD in six individuals with thin LIS and normal cerebellum, and either true or relative megalencephaly.11 In contrast, the remaining 14 individuals with thin LIS had normal or small head size. We demonstrated that CRADD-associated LIS is caused by decreased neuronal apoptosis due to failure to activate caspase-2.11 Therefore, reduced apoptosis is a novel developmental mechanism for cortical malformations, although it accounts for less than 1% of LIS patients. However, mutations of CRADD explained a third of patients with thin LIS and normal cerebellum, and confirmed clinical reports that thin undulating LIS with and without cerebellar anomalies often has autosomal recessive inheritance.
Diagnostic testing and genetic counseling
We integrated all of these data to develop a diagnostic testing strategy for medical professionals with no special expertise in malformations of cortical development or MRI interpretation (Figure 3 upper panel). This approach requires only the recognition of a cortical malformation and its classification as a type of lissencephaly. For specialists with substantial expertise, the diagnostic pipeline can be modified based on the specific pattern of LIS recognized (Figure 3 lower panel and legend). Our results demonstrate a diagnostic yield above 80% for most morphological LIS groups, with lower yields for frontal predominate thick pachygyria, dysgyria, partial posterior SBH and frontal thin LIS with normal cerebellum.
Figure 3.
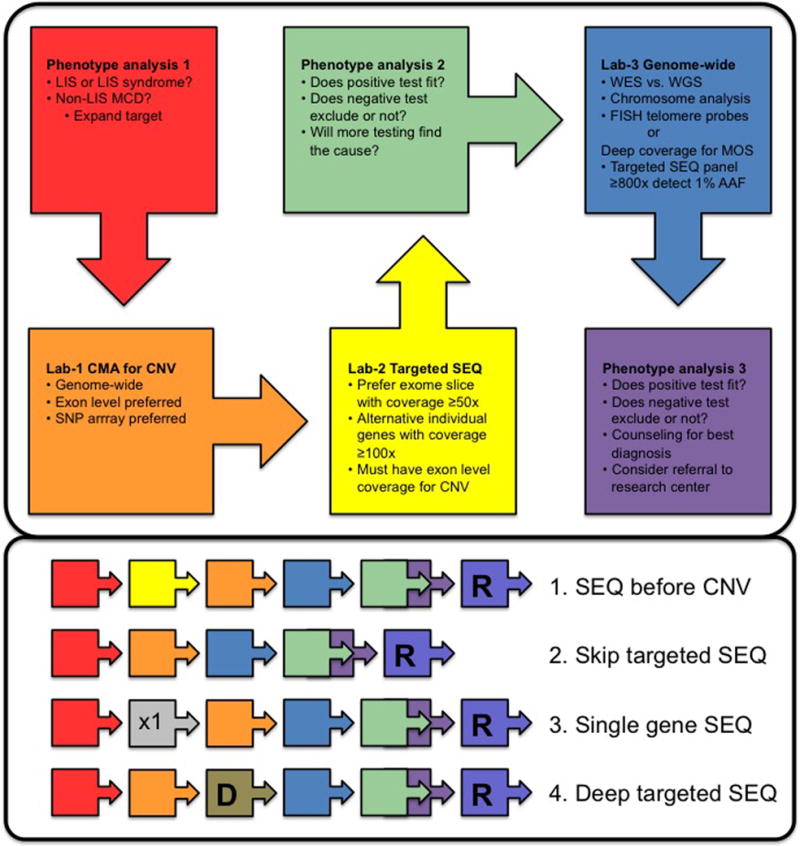
Diagnostic algorithm. The upper panel shows a standard algorithm for genetic testing in patients with lissencephaly (LIS). Following initial clinical assessment (red box), a genome-wide chromosome microarray should be ordered to detect CNV (orange box), preferably an array with exon level coverage of most LIS genes. The next step is a targeted sequencing panel (yellow box). We recommend an exome slice approach, as this allows re-analysis for additional genes as new genes are reported or the phenotype of the child evolves to suggest tests for other disorders. The coverage of a standard exome is currently ~50x, sufficient to detect mosaicism with alternate allele fractions down to 20% with high reliability, and down to 10% for some variants. The alternative approach of targeted individual gene sequencing at ~100x or greater will detect lower levels of mosaicism, although levels below 20% are rare with LIS-associated phenotypes. If not done in step 1, duplication-deletion analysis with exon level coverage of LIS genes should be done to detect small intragenic deletions and duplications missed by exome or individual gene sequencing (based on data to date, this is not needed for alpha and beta tubulin genes).
With these results in hand, phenotype re-review (green box) is useful to confirm that the phenotype matches any reported mutations, or if negative determine which type of LIS the phenotype best matches. When the child’s condition and/or family’s concerns support further testing, the next step is more complicated and involves either genome-wide testing such as whole exome sequencing, or deep targeted sequencing for low level mosaicism (blue box). A final phenotype review with all test results available is indicated for genotype-phenotype analysis and counseling (purple box). If the disorder appears to be rare or remains unsolved, referral to a research group for other approaches may be useful.
The lower panel shows several alternative approaches for testing that experts in LIS may choose to pursue. For example, sequencing may be performed before testing for CNV for tubulinopathies and disorders with autosomal recessive inheritance. For novel phenotypes, CNV testing could be followed directly by whole exome sequencing. Testing for X-linked LIS with abnormal genitalia (XLAG) could begin with single gene sequencing, while mild variants of LIS or subcortical band heterotopia might begin with deep targeted sequencing to be sure to detect mosaicism. Abbreviations: CNV, copy number variants; D, deep targeted sequencing; LIS, lissencephaly; MCD, malformation of cortical development; MOS, mosaicism; R, refer to research program; SEQ, sequencing.
As may be expected with such a high yield from genetic testing, our experience has shown that negative testing of the known LIS-associated genes significantly reduces heterogeneity. Even with negative testing, the parents of children with thin (undulating) LIS should be counseled for possible autosomal recessive inheritance.1 In contrast, autosomal recessive inheritance with thick LIS is possible, but very rare. Dysgyria with no molecular cause should be counseled for any inheritance patterns, as the available data is still insufficient to reliably predict the most common pattern of inheritance.
Summary
We provide a systematic analysis of the genetic basis of LIS-SBH using the largest cohort ever assembled. The total diagnostic yield from mutation analysis of 17 known LIS genes plus deletion 17p13.3 was 81%, with the four most frequent genes – LIS1, DCX, TUBA1A and DYNC1H1 – accounting for 69%. We demonstrate a consistent phenotypic spectrum, defined primarily by brain imaging features especially by the anterior to posterior gradient, for each pathway-defined group. From our experience, recognition of one of these imaging patterns can support analysis of the many variants of unknown significance associated with genetic testing. Further, the genetic testing results (even when negative) and brain-imaging pattern combine to robustly predict both the most likely patterns of inheritance as well as the most likely clinical outcome, making them important for clinical management of patients. For example, recognition of SBH (especially in females), frontal predominant classic (thick) LIS and the temporal predominant XLAG pattern of LIS all predict X-linked inheritance (either DCX or ARX mutations). Similarly, recognition of thin undulating LIS with or without cerebellar hypoplasia predicts autosomal recessive inheritance. Most other patterns are associated with de novo heterozygous mutations, although parental gonadal mosaicism has now been recognized with several of these genes. Finally, most – but not all – SBH phenotypes are associated with mosaicism, including both true mosaic mutations (LIS1; also DCX in males more often than females) and functional mosaicism related to X inactivation in females (for DCX).
Supplementary Material
Acknowledgments
We wish to thank the many patients and their families, as well as the physicians and genetic counselors who referred them, for their important contributions to this research over more than 30 years. Research reported in this publication was supported by the Deutsche Forschungsgemeinschaft (German Research Foundation, to N.DD), the National Institute of Neurological Disorders and Stroke (NINDS) of the National Institutes of Health under award numbers P01NS039404, R01NS050375, 1R01NS058721 and 1R01NS092772 (to W.B.D.), R01NS35515 (to M.E.R and W.B.D), and K08NS092898 (to G.M.M.), the National Institute of Child Health and Human Development under award number R01HD20619 (to D.H.L.), and by the EU Seventh Framework Program under the project DESIRE grant agreement N602531, and E‐RareJTC2011 (to R.G.). Exome sequencing in this study was partly provided by the University of Washington Center for Mendelian Genomics (UW-CMG) and was funded by the National Human Genome Research Institute and the National Heart, Lung and Blood Institute grant U54HG006493 to Drs. Debbie Nickerson, Jay Shendure, and Michael Bamshad.
Footnotes
Conflict of interest notification page
None of the authors have any competing interests. The content is solely the responsibility of the authors, and does not necessarily represent the official views of the National Institutes of Health. The funding sources had no role in the design and conduct of the study, collection, management, analysis and interpretation of the data, preparation, review or approval of the manuscript, or decision to submit the manuscript for publication.
Author Contributions
NDD, RG, and WBD designed the study, analyzed the data and drafted the manuscript; AET analyzed the data and drafted a portion of the manuscript; KAA, GMM, JTN, SC, CO, DM, SC, GG, CTM, JBR, MSZ, JGG, AR, VC, EP, DHL acquired and analyzed clinical, imaging and molecular data. All authors read, edited and approved the final draft.
References
- 1.Di Donato N, Chiari S, Mirzaa GM, et al. Lissencephaly: Expanded imaging and clinical classification. Am J Med Genet A. 2017 doi: 10.1002/ajmg.a.38245. in press. [DOI] [PMC free article] [PubMed] [Google Scholar]
- 2.Dobyns WB. The clinical patterns and molecular genetics of lissencephaly and subcortical band heterotopia. Epilepsia. 2010;51(Suppl 1):5–9. doi: 10.1111/j.1528-1167.2009.02433.x. [DOI] [PubMed] [Google Scholar]
- 3.Haverfield EV, Whited AJ, Petras KS, Dobyns WB, Das S. Intragenic deletions and duplications of the LIS1 and DCX genes: a major disease-causing mechanism in lissencephaly and subcortical band heterotopia. Eur J Hum Genet. 2009;17:911–918. doi: 10.1038/ejhg.2008.213. [DOI] [PMC free article] [PubMed] [Google Scholar]
- 4.Kumar RA, Pilz DT, Babatz TD, et al. TUBA1A mutations cause wide spectrum lissencephaly (smooth brain) and suggest that multiple neuronal migration pathways converge on alpha tubulins. Human molecular genetics. 2010;19:2817–2827. doi: 10.1093/hmg/ddq182. [DOI] [PMC free article] [PubMed] [Google Scholar]
- 5.Bahi-Buisson N, Poirier K, Boddaert N, et al. Refinement of cortical dysgeneses spectrum associated with TUBA1A mutations. J Med Genet. 2008;45:647–653. doi: 10.1136/jmg.2008.058073. [DOI] [PubMed] [Google Scholar]
- 6.D’Agostino MD, Bernasconi A, Das S, et al. Subcortical band heterotopia (SBH) in males: clinical, imaging and genetic findings in comparison with females. Brain. 2002;125:2507–2522. doi: 10.1093/brain/awf248. [DOI] [PubMed] [Google Scholar]
- 7.Jansen AC, Oostra A, Desprechins B, et al. TUBA1A mutations: from isolated lissencephaly to familial polymicrogyria. Neurology. 2011;76:988–992. doi: 10.1212/WNL.0b013e31821043f5. [DOI] [PubMed] [Google Scholar]
- 8.Poirier K, Lebrun N, Broix L, et al. Mutations in TUBG1, DYNC1H1, KIF5C and KIF2A cause malformations of cortical development and microcephaly. Nat Genet. 2013;45:639–647. doi: 10.1038/ng.2613. [DOI] [PMC free article] [PubMed] [Google Scholar]
- 9.Jamuar SS, Lam AT, Kircher M, et al. Somatic Mutations in Cerebral Cortical Malformations. N Engl J Med. 2014;371:733–743. doi: 10.1056/NEJMoa1314432. [DOI] [PMC free article] [PubMed] [Google Scholar]
- 10.Bahi-Buisson N, Poirier K, Fourniol F, et al. The wide spectrum of tubulinopathies: what are the key features for the diagnosis? Brain : a journal of neurology. 2014;137:1676–1700. doi: 10.1093/brain/awu082. [DOI] [PubMed] [Google Scholar]
- 11.Di Donato N, Jean YY, Maga AM, et al. Mutations in CRADD Result in Reduced Caspase-2-Mediated Neuronal Apoptosis and Cause Megalencephaly with a Rare Lissencephaly Variant. Am J Hum Genet. 2016;99:1117–1129. doi: 10.1016/j.ajhg.2016.09.010. [DOI] [PMC free article] [PubMed] [Google Scholar]
- 12.Magen D, Ofir A, Berger L, et al. Autosomal recessive lissencephaly with cerebellar hypoplasia is associated with a loss-of-function mutation in CDK5. Hum Genet. 2015;134:305–314. doi: 10.1007/s00439-014-1522-5. [DOI] [PubMed] [Google Scholar]
- 13.Mishra-Gorur K, Caglayan AO, Schaffer AE, et al. Mutations in KATNB1 cause complex cerebral malformations by disrupting asymmetrically dividing neural progenitors. Neuron. 2014;84:1226–1239. doi: 10.1016/j.neuron.2014.12.014. [DOI] [PMC free article] [PubMed] [Google Scholar]
- 14.Abdel-Salam GM, Abdel-Hamid MS, Hassan NA, et al. Further delineation of the clinical spectrum in RNU4ATAC related microcephalic osteodysplastic primordial dwarfism type I. Am J Med Genet A. 2013;161A:1875–1881. doi: 10.1002/ajmg.a.36009. [DOI] [PubMed] [Google Scholar]
- 15.Paciorkowski AR, Keppler-Noreuil K, Robinson L, et al. Deletion 16p13.11 uncovers NDE1 mutations on the non-deleted homolog and extends the spectrum of severe microcephaly to include fetal brain disruption. Am J Med Genet A. 2013;161A:1523–1530. doi: 10.1002/ajmg.a.35969. [DOI] [PMC free article] [PubMed] [Google Scholar]
- 16.Richards S, Aziz N, Bale S, et al. Standards and guidelines for the interpretation of sequence variants: a joint consensus recommendation of the American College of Medical Genetics and Genomics and the Association for Molecular Pathology. Genet Med. 2015;17:405–424. doi: 10.1038/gim.2015.30. [DOI] [PMC free article] [PubMed] [Google Scholar]
- 17.Zillhardt JL, Poirier K, Broix L, et al. Mosaic parental germline mutations causing recurrent forms of malformations of cortical development. Eur J Hum Genet. 2015 doi: 10.1038/ejhg.2015.192. [DOI] [PMC free article] [PubMed] [Google Scholar]
- 18.Gambello MJ, Darling DL, Yingling J, Tanaka T, Gleeson JG, Wynshaw-Boris A. Multiple dose-dependent effects of Lis1 on cerebral cortical development. J Neurosci. 2003;23:1719–1729. doi: 10.1523/JNEUROSCI.23-05-01719.2003. [DOI] [PMC free article] [PubMed] [Google Scholar]
- 19.Fu X, Brown KJ, Yap CC, Winckler B, Jaiswal JK, Liu JS. Doublecortin (Dcx) family proteins regulate filamentous actin structure in developing neurons. J Neurosci. 2013;33:709–721. doi: 10.1523/JNEUROSCI.4603-12.2013. [DOI] [PMC free article] [PubMed] [Google Scholar]
- 20.Moon HM, Wynshaw-Boris A. Cytoskeleton in action: lissencephaly, a neuronal migration disorder. Wiley Interdiscip Rev Dev Biol. 2013;2:229–245. doi: 10.1002/wdev.67. [DOI] [PMC free article] [PubMed] [Google Scholar]
- 21.Lo Nigro C, Chong CS, Smith AC, Dobyns WB, Carrozzo R, Ledbetter DH. Point mutations and an intragenic deletion in LIS1, the lissencephaly causative gene in isolated lissencephaly sequence and Miller-Dieker syndrome. Hum Mol Genet. 1997;6:157–164. doi: 10.1093/hmg/6.2.157. [DOI] [PubMed] [Google Scholar]
- 22.Oegema R, Cushion TD, Phelps IG, et al. Recognizable cerebellar dysplasia associated with mutations in multiple tubulin genes. Hum Mol Genet. 2015;24:5313–5325. doi: 10.1093/hmg/ddv250. [DOI] [PMC free article] [PubMed] [Google Scholar]
- 23.Abdollahi MR, Morrison E, Sirey T, et al. Mutation of the variant alpha-tubulin TUBA8 results in polymicrogyria with optic nerve hypoplasia. Am J Hum Genet. 2009;85:737–744. doi: 10.1016/j.ajhg.2009.10.007. [DOI] [PMC free article] [PubMed] [Google Scholar]
- 24.Cederquist GY, Luchniak A, Tischfield MA, et al. An inherited TUBB2B mutation alters a kinesin-binding site and causes polymicrogyria, CFEOM and axon dysinnervation. Hum Mol Genet. 2012;21:5484–5499. doi: 10.1093/hmg/dds393. [DOI] [PMC free article] [PubMed] [Google Scholar]
- 25.Willemsen MH, Vissers LE, Willemsen MA, et al. Mutations in DYNC1H1 cause severe intellectual disability with neuronal migration defects. J Med Genet. 2012;49:179–183. doi: 10.1136/jmedgenet-2011-100542. [DOI] [PubMed] [Google Scholar]
- 26.Willemsen MH, Ba W, Wissink-Lindhout WM, et al. Involvement of the kinesin family members KIF4A and KIF5C in intellectual disability and synaptic function. J Med Genet. 2014;51:487–494. doi: 10.1136/jmedgenet-2013-102182. [DOI] [PubMed] [Google Scholar]
- 27.Cavallin M, Hubert L, Cantagrel V, et al. Recurrent KIF5C mutation leading to frontal pachygyria without microcephaly. Neurogenetics. 2016;17:79–82. doi: 10.1007/s10048-015-0459-8. [DOI] [PubMed] [Google Scholar]
- 28.Dobyns WB, Truwit CL, Ross ME, et al. Differences in the gyral pattern distinguish chromosome 17-linked and X-linked lissencephaly. Neurology. 1999;53:270–277. doi: 10.1212/wnl.53.2.270. [DOI] [PubMed] [Google Scholar]
- 29.Riviere JB, van Bon BW, Hoischen A, et al. De novo mutations in the actin genes ACTB and ACTG1 cause Baraitser-Winter syndrome. Nat Genet. 2012;44:440–444. S441–442. doi: 10.1038/ng.1091. [DOI] [PMC free article] [PubMed] [Google Scholar]
- 30.Mohan R, John A. Microtubule-associated proteins as direct crosslinkers of actin filaments and microtubules. IUBMB Life. 2015;67:395–403. doi: 10.1002/iub.1384. [DOI] [PubMed] [Google Scholar]
- 31.Tsukada M, Prokscha A, Ungewickell E, Eichele G. Doublecortin association with actin filaments is regulated by neurabin II. J Biol Chem. 2005;280:11361–11368. doi: 10.1074/jbc.M405525200. [DOI] [PubMed] [Google Scholar]
- 32.Forman MS, Squier W, Dobyns WB, Golden JA. Genotypically defined lissencephalies show distinct pathologies. Journal of neuropathology and experimental neurology. 2005;64:847–857. doi: 10.1097/01.jnen.0000182978.56612.41. [DOI] [PubMed] [Google Scholar]
- 33.Di Donato N, Kuechler A, Vergano S, et al. Update on the ACTG1-associated Baraitser-Winter cerebrofrontofacial syndrome. Am J Med Genet A. 2016;170:2644–2651. doi: 10.1002/ajmg.a.37771. [DOI] [PubMed] [Google Scholar]
- 34.Xie Z, Sanada K, Samuels BA, Shih H, Tsai LH. Serine 732 phosphorylation of FAK by Cdk5 is important for microtubule organization, nuclear movement, and neuronal migration. Cell. 2003;114:469–482. doi: 10.1016/s0092-8674(03)00605-6. [DOI] [PubMed] [Google Scholar]
- 35.Hirota Y, Nakajima K. Control of Neuronal Migration and Aggregation by Reelin Signaling in the Developing Cerebral Cortex. Front Cell Dev Biol. 2017;5:40. doi: 10.3389/fcell.2017.00040. [DOI] [PMC free article] [PubMed] [Google Scholar]
Associated Data
This section collects any data citations, data availability statements, or supplementary materials included in this article.