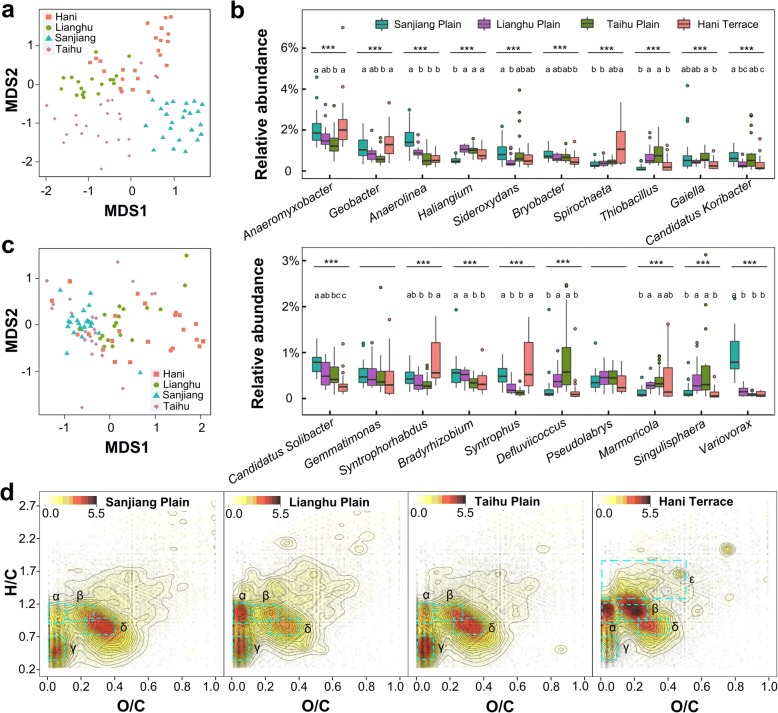
Fig. 2.
Distributions of DOM molecules and bacteria across 88 paddy soils from four regions. a Non-metric multidimensional scaling of bacterial OTUs (matrix: variance adjusted weighted UniFrac, stress = 0.1918). b Boxplots showing regional differences of top 20 genera. Genera with significant differences (Kruskal-Wallis test) were labeled with "*" (P < 0.05), "**" (P < 0.01), and "***" (P < 0.001). For each genus, paired boxes containing no same letter are considered to be significantly different (P < 0.05, Dunn’s test). c Non-metric multidimensional scaling of DOM molecules (matrix: Bray-Curtis, stress = 0.1479). d Kernel density plots of DOM formula in van Krevelen diagrams. Darker color indicates a higher molecular density. Accumulated areas α, β, ɣ, δ, and ε are considered to be clusters of highly unsaturated/aromatic hydrocarbon, phenolics, polycyclic aromatics, polyphenols, and unsaturated aliphatics or peptides, respectively

