

Abstract
Detyrosinated microtubules (MTs) provide mechanical resistance that can impede the motion of contracting cardiomyocytes. However, the functional effects of MT detyrosination in heart failure or in human hearts have not previously been studied. Here we utilize mass spectrometry and single-myocyte mechanical assays to characterize changes to the cardiomyocyte cytoskeleton and their functional consequences in human heart failure. Proteomic analysis of left ventricle tissue reveals a consistent upregulation and stabilization of intermediate filaments and MTs in failing human hearts. As revealed by super-resolution imaging, failing cardiomyocytes are characterized by a dense, heavily detyrosinated MT network, which is associated with increased myocyte stiffness and impaired contractility. Pharmacological suppression of detyrosinated MTs lowers the viscoelasticity of failing myocytes and restores 40–50% of lost contractile function; reduction of MT detyrosination using a genetic approach also softens cardiomyocytes and improves contractile kinetics. Together, these data demonstrate that a modified cytoskeletal network impedes contractile function in cardiomyocytes from failing human hearts and that targeting detyrosinated MTs could represent a new inotropic strategy for improving cardiac function.
INTRODUCTION
During the transition from cardiac hypertrophy to failure, structural changes to the ventricular myocyte impair systolic and diastolic function. A proliferated MT network has been proposed1, and subsequently refuted2, as a possible contributor to impaired performance. Certain studies in animal models of pressure-overload induced cardiomyopathy indicate a substantial impairment of myocyte contraction by proliferated MTs1,3,4, while others show no such role2,5. Inconsistencies have been attributed to the severity of the disease stimulus required to cause MT proliferation, raising the question of relevance in human heart failure. To circumvent discrepancies between model systems, we utilized human myocardium and myocytes from heart failure patients, where the role of MTs is unexplored.
Our previous work in murine myocytes indicates that the mechanical contribution of MTs depends not only on the proliferation of the network, but also on its post-translational modification6,7. MTs undergo a switch in mechanical behavior between low-resistance sliding and high-resistance buckling due to interactions with the sarcomere mediated at least partly by desmin intermediate filaments (IFs). This switch is governed by post-translational detyrosination (dTyr) of MTs, which promotes the buckling behavior and crosslinking of cytoskeletal networks, increasing viscoelastic resistance to sarcomere shortening and stretch7,8. While previous work suggests both desmin9 and detyrosination7 may be elevated in heart failure, the extent of these changes and their functional ramifications are untested.
Thus, there were two major goals of this study. First, to broadly characterize how the cardiac cytoskeleton is changed in human heart disease of various etiology and severity. Second, to directly test whether detyrosinated MTs regulate the mechanics of human cardiomyocytes from non-failing and failing hearts. Together, our results support the attractiveness of detyrosinated MTs as a target for therapeutic intervention.
RESULTS
This study utilized left ventricular (LV) myocardium from 105 non-failing (NF) and failing human hearts. NF hearts are subdivided into normal or compensated hypertrophy (cHyp), while failing hearts are subdivided into ischemic cardiomyopathy (ICM), dilated cardiomyopathy (DCM), and hypertrophic cardiomyopathy with preserved or reduced ejection fraction (HCMpEF and HCMrEF, respectively). Western blot was performed on 102 hearts; 34 of these were also used for mass spectrometry, while 22 were used for primary isolation of cardiomyocytes for functional studies. For further details on patient classification, in vivo parameters and the experiments performed on each heart, see Methods and Supplementary Table 1.
Conserved upregulation and stabilization of MTs and IFs across human heart failure
First we sought to globally characterize changes to the cytoskeletal proteome that occur in human heart disease. Tandem mass spectrometry (MS) analysis detected 3,764 proteins in LV tissue, and there was a distinct proteomic distribution based on patient etiology (Fig. 1a, Supplementary Fig. 1b-e and Spreadsheet for MS data). Principal component analysis (PCA) was used to examine and display the variance in protein distribution among groups, and demonstrates that NF hearts are well separated from failing hearts. Among failing hearts, the proteomic profiles of non-ischemic heart disease (HCM and DCM) cluster tightly together, while those from ischemic hearts demonstrate a distinct proteomic profile. Non-myocyte populations will contribute to these proteomic profiles, but given their small contribution to tissue mass and modest change in this contribution observed in failing hearts (Supplementary Fig. 2d)10, the dominant shifts in myocyte proteins likely arise from within that population.
Fig. 1. Proteomic analysis of human left ventricular tissues of varying disease severity and etiology.
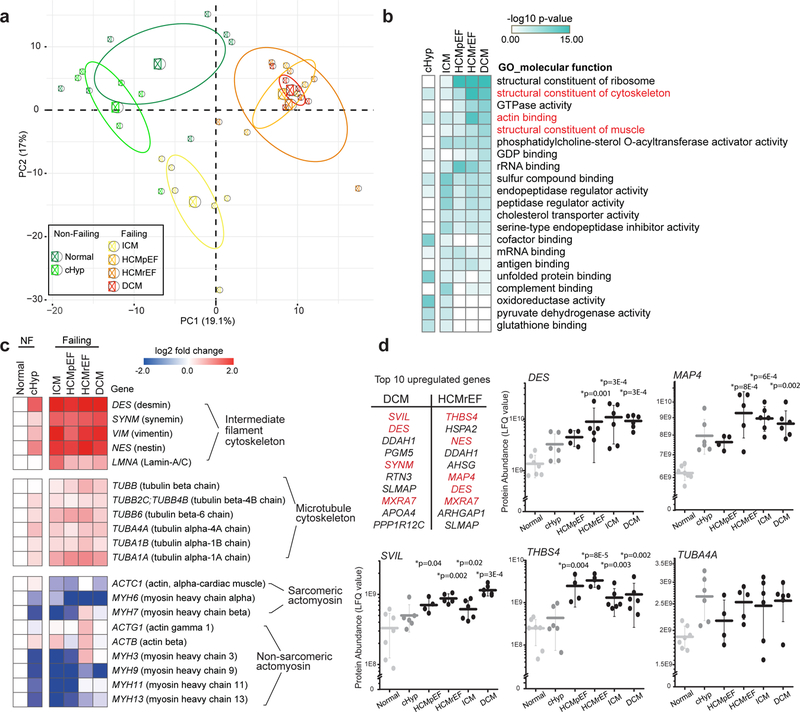
(a) Principal component analysis (PCA) of tandem MS data (500 most variable proteins) to visualize similarities and differences among samples. Small circles represent the projections of individual hearts onto principal component (PC) 1 and 2, with the percentage of total variance listed in parentheses; large circles and ellipses represent the group mean and 95% confidence intervals, respectively. For a-d, Normal N=7, cHyp N=6, ICM N=6, HCMpEF N=4, HCMrEF N=5, DCM N=6 biologically independent hearts. (b) Heat map displaying the molecular function GO groups enriched in each group when compared to normal, color-coded by significance (determined by Toppfun analysis, see Statistics and Reproducibility) and sorted by most increased in DCM. Cytoskeleton-related GO groups are highlighted in red. Statistical details of GO group and protein domain enrichment analysis are available in Supplementary Tables 3, 4. (c) Heat map depicting the expression levels (log2 fold change) of individual proteins in the major cytoskeletal sub-groups. NF, Non-failing. (d) Table, top 10 upregulated genes as obtained from differential gene expression analysis in HCMrEF and DCM (compared to normal). Cytoskeletal genes are highlighted in red. Dot plots, abundance of specific proteins of interest measured as LFQ value from MS data. Each data point represents one heart, with mean line and whiskers representing standard deviation (SD). Statistical significance was determined via differential gene expression analysis compared to normal hearts, in which a linear model adjusting for age and sex in the R package LIMMA was used. P values were adjusted for multiple testing using the Benjamini-Hochberg procedure.
We ranked the protein list for each patient group based on the significance of the change in protein expression compared to normal hearts. The top 25 up- and down-regulated proteins from each patient group are displayed in Supplementary Table 2. Gene Ontology (GO) analysis11 was used to determine the most robustly changed molecular functions in each patient population relative to normal hearts (Fig. 1b). In cHyp, the most prominent increases were in GO groups related to mitochondrial function or redox balance. In ICM, significant upregulation in endopeptidases and proteins involved in immune and inflammatory responses were observed. Yet in non-ischemic heart failure, particularly in HCMrEF and DCM, 3 of the 5 most significantly upregulated GO groups encoded cytoskeletal proteins (Fig. 1b, Supplementary Table 3). This pattern is also evident in protein domain analysis, where tubulin, spectrin, and CH-type domains are the most prominently increased in non-ischemic (but not ischemic) heart failure (Supplementary Table 4).
We further examined the expression profiles of the individual proteins driving these cytoskeletal changes. Fig. 1c demonstrates protein expression of the major cytoskeletal sub-groups – IF proteins, tubulin, and actin/myosin. IF proteins show a pronounced and progressive upregulation from cHyp to end-stage heart failure. The major tubulin isotypes are also progressively, but more modestly, increased. Conversely, most actin and myosin isoforms, including sarcomeric actomyosin, tend to decrease in relative abundance in disease.
In Fig. 1d we highlight several specific proteins of interest. In end-stage failing hearts, many of the most upregulated proteins are cytoskeletal in nature. Thrombospondin-4 (gene:THBS4) and supervilin (gene: SVIL) are involved in linking the plasma membrane to the external matrix and to the internal cytoskeleton12,13. Microtubule associated protein 4 (gene: MAP4) is the predominantly expressed MAP in the heart. It can bind and stabilize cardiac MTs, as well as promote dTyr and resistance to myocyte contraction14,15. MAP4 is increased in every patient sample compared to any normal control, suggesting a highly-conserved upregulation of this MT stabilizer in human heart disease. Finally, while most tubulin isoforms are synthesized with a C-terminal tyrosine, α-tubulin A4A (gene: TUBA4A) is synthesized in its detyrosinated form16. Thus, increases in both MAP4 and TUBA4A protein are predicted to increase the amount of stable, detyrosinated MTs in failing human hearts.
Together, this proteomic analysis suggests that the upregulation and stabilization of the cytoskeleton – specifically MTs, IFs, and proteins associated with linking the cytoskeleton to the external environment – is a prominent feature of end-stage heart failure in humans.
Proliferation and modification of MTs and IFs in diseased human myocytes
To validate and extend our proteomic results, we performed quantitative western blot and immunofluorescence analysis of cytoskeletal targets in human myocardium and myocytes. As MTs tend to fragment during fixation of myocardial tissue (See Methods, Supplementary Fig. 2b), we examined the network organization in isolated LV myocytes using super-resolution imaging. Just under the membrane, cortical MTs are chaotically organized and show frequent transverse elements, while deeper into the cell the network becomes quite dense, with interior MTs predominantly aligned along the long axis of the myocyte (Fig. 2a, Supplementary Video 1). This organization is mostly conserved between failing and NF myocytes (Supplementary Fig. 3), in contrast to the network disorganization seen in myopathies that arise from the loss of costameric proteins7,17. Structured illumination microscopy (SIM) of the interior MTs in a normal human myocyte reveals an intricate network, predominantly formed by single or paired MTs running tens of microns in the cell, forming a lattice like structure with transverse desmin filaments (Fig. 2b). As recently observed in murine myocytes7, these longitudinal MTs buckle predominantly between sarcomeric Z-disks during contraction, suggesting that they bear compressive load. This periodic buckling was observed in both non-failing and failing cardiomyocytes (Supplementary Videos 2 and 3).
Fig. 2. Characterization of MTs and desmin in NF and failing human myocytes.
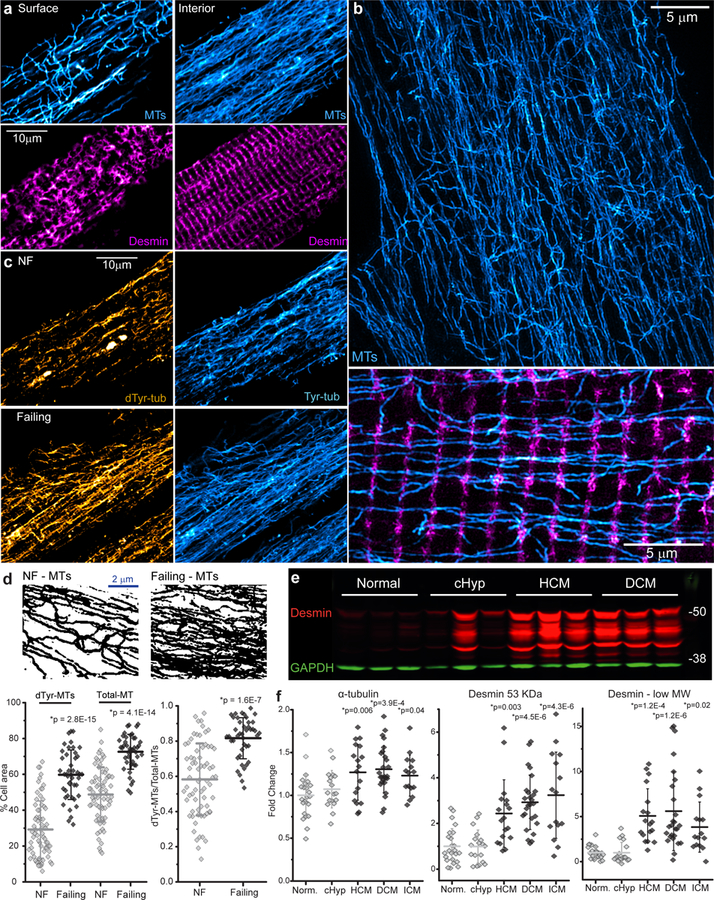
(a) Immunofluorescent imaging of surface and interior MTs (cyan) and desmin (magenta) in a failing human myocyte. (b) Structured illumination microscopy (SIM) of NF human myocyte. Top, MTs (cyan). Bottom, a higher magnification image of transverse desmin elements (magenta) and longitudinal MTs (cyan). (c) Representative dTyr- and Tyr-MT networks in NF and failing myocytes. (d) Top, immunofluorescent images were converted to binary images to quantify MT network density. Bottom, the percentage of cell area covered by polymerized MTs (left) and the ratio of dTyr-MT/total MT (right). The total MT network density was calculated from the overlay of dTyr-MT and Tyr-MT binary images. For a, c, d - NF, n=68 images from 68 myocytes from N=3 biologically independent hearts; failing, n=42 images from 42 myocytes from N=2 biologically independent hearts. Each dot represents an individual myocyte with mean line and SD. Statistical significance in d determined via two-sided T-test with post-hoc Bonferroni correction, *p vs. NF. (e, f) Representative western blot of desmin (e) and quantification of the levels of α-tubulin and the 53 kD and low MW forms of desmin (f). GAPDH was used as a loading control. Each dot represents individual heart with mean line and SD (Normal N=24, cHyp N=18, HCM N=19, DCM N=26, ICM N=15 biologically independent hearts). Statistical significance in f determined via two-sided T-test with post-hoc Bonferroni correction, *p vs. normal. A representative α-tubulin blot and additional image quantification of MTs and desmin in myocytes and myocardium are presented in Supplementary Figs. 2, 3. Full-length western blots are presented in Supplementary Fig. 6.
The MT network is highly proliferated and detyrosinated in failing vs. NF myocytes (Fig. 2c, d). Quantitative image analysis reveals that the fraction of cell area covered by all MTs or dTyr-MTs increases by 1.5 and 2-fold respectively in failing myocytes (Fig. 2d bottom left), with a significant increase in the ratio of dTyr to total MTs (Fig. 2d bottom right). This increase in MT density is concomitant with an increase in total tubulin protein, as western blotting of LV tissue shows a significant upregulation of α-tubulin in HCM, DCM, and ICM hearts (Fig. 2f, Supplementary Fig. 2a).
In addition, failing myocytes demonstrate a distorted arrangement of desmin and misaligned myofibrils (Supplementary Fig. 2b, c and e). Quantification of desmin organization shows reduced periodicity in failing LV myocardium, but not in cHyp hearts (Supplementary Fig. 2c). Western blot analysis demonstrates a marked upregulation of desmin in human heart failure (Fig. 2e, f). Interestingly, we observed multiple bands below desmin’s predicted molecular weight (MW); some of these low MW bands were previously identified as post-translationally modified desmin products that are prone to misfolding, aggregation, and cleavage9. These low MW products were increased above the mean level of NF hearts in 57 out of 60 failing hearts (Fig. 2e, f).
MTs increase viscoelasticity in failing myocytes
Next we sought to test whether detyrosinated MTs differentially affect the mechanical properties of failing vs. NF myocytes. To assess passive mechanics, viscoelasticity was measured via transverse nano-indentation and variable indentation-rate viscoelastic analysis (VIVA)18. Briefly, myocytes were indented at progressively increasing rates to evaluate elastic as well as viscoelastic contributions to myocyte stiffness. As seen in Fig. 3a, stiffness increases as a function of indentation rate, demonstrating that human myocytes are indeed viscoelastic. The Elastic modulus (E) at the lowest velocity arises primarily from elastic components within the myocyte (Emin), while high velocity stiffness reflects both elastic and viscous contributions (Emax). The change in modulus with rate is a useful indicator of viscoelasticity (Ε∆). Failing myocytes showed no difference in Emin (Fig. 3a, b left Emin, DMSO-treated cells), but were significantly more viscoelastic than NF myocytes (Fig. 3a, b Emax and E∆, DMSO-treated cells). Next we tested the contribution of MTs and MT detyrosination to this increased viscoelasticity. Parthenolide (PTL) inhibits the detyrosinating enzyme tubulin carboxypeptidase (TCP), which catalyzes the removal of the C-terminal tyrosine from α-tubulin. Ten μΜ PTL suppresses detyrosination in cardiac and skeletal muscle without grossly disrupting MT density6,7, while 10 μM colchicine (colch) broadly depolymerizes MTs1. No differences in elasticity were observed between NF and failing myocytes in any treatment condition (Fig. 3a, b left, Emin). While MT destabilization had a modest effect on normal myocytes, both colch and PTL treatment robustly reduced viscoelasticity in failing myocytes (Fig. 3b, Emax and E∆), indicating that the proliferation of dTyr-MTs increases transverse stiffness in human heart failure. Fig. 3c provides a summary of these studies, plotting the drug-induced decrease in viscoelasticity relative to the initial stiffness of each heart tested. In general, stiffer myocytes show larger reductions in viscoelasticity after destabilizing MTs or suppressing detyrosination.
Fig. 3. MT-dependent viscoelasticity of human myocytes measured via nanoindentation.
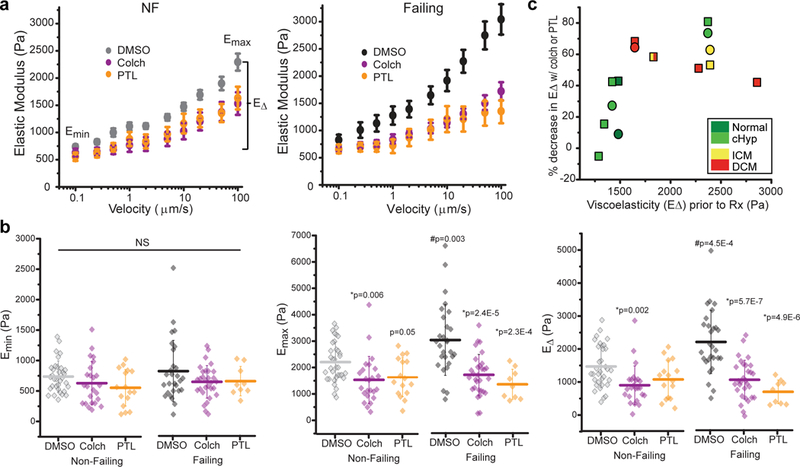
(a) Viscoelasticity data are plotted as stiffness (elastic modulus) vs. velocity of indentation and is pooled from cardiomyocytes from NF and failing hearts treated with DMSO, colchicine (colch, a MT depolymerizer) or PTL (inhibits detyrosination) (NF hearts: DMSO, N =6 hearts, n =34 cardiomyocytes; colch, N=5, n=26; PTL, N=3, n=16; Failing hearts: DMSO, N=5, n=26; colch, N=5, n=30; PTL, N=2, n=9). Data are presented as myocyte mean ± standard error. (b) Quantification of viscoelasticity measurements Emin (minimum stiffness at low rate), Emax (maximum stiffness at high rate), and EΔ (difference between Emin and Emax, an indicator of viscoelasticity). Each data point represents a single myocyte with mean line and whiskers as SD. Detailed measurements from each heart are available in Supplementary Table 5. Statistical significance determined via One-Way ANOVA with post-hoc Tukey test, *p vs. DMSO; #p vs. NF. (c) Correlation between the initial viscoelasticity (E∆) of each heart and the percentage decreases in viscoelasticity after colch (square) and PTL (circle) treatment. Each data point represents the mean E∆ from all cells in a particular heart, which are color coded by group.
dTyr-MTs impede contractility in failing myocytes
If dTyr-MTs provide viscoelastic resistance, removing them should reduce this resistance, improving contractility. Thus we assessed sarcomere length (SL) and contractile velocities during electrical stimulation of 785 freshly isolated myocytes from 12 human hearts, 7 failing and 5 NF (for patient characteristics, please see Supplementary Table 1). Prior to treatment, failing myocytes demonstrated markedly reduced sarcomere shortening, with slower contraction and relaxation velocities compared to NF cells (Fig. 4a, e). Fig. 4b and c depict average traces of myocyte shortening with and without MT destabilization from 5 representative NF and failing hearts of different etiology. On average, NF myocytes treated with colchicine showed modest (yet significant) increases in shortening amplitude and contractile velocities (Fig. 4b left), as quantified in Fig. 4f. PTL had even less of an effect on NF myocytes, actually slightly prolonging the late phase of relaxation (Fig. 4b right, g). Yet in failing myocytes, both colch and PTL robustly improved shortening amplitude and velocity, and increased the speed of relaxation (Fig. 4c, f and g). The average velocity traces from all cells are shown in Fig. 4d – neither colch nor PTL fully rescued contractile velocities of failing myocytes back to the NF benchmark, but restored ~40–50% of lost function. Notably, the treatment-induced improvement in contractile kinetics from a given heart was inversely correlated with the initial contractile kinetics prior to treatment (Fig. 4e). Put differently, hearts with slowly contracting myocytes benefitted most from MT destabilization, raising the possibility of predicting therapeutic efficacy based on initial functional assessment. Of interest, myocytes from a failing heart with preserved ejection fraction (HFpEF) showed the slowest contractile duration and largest improvement in relaxation time upon suppression of detyrosinated MTs (Fig. 4c right).
Fig. 4. Suppression of detyrosinated MTs improves contractility in failing human cardiomyocytes.
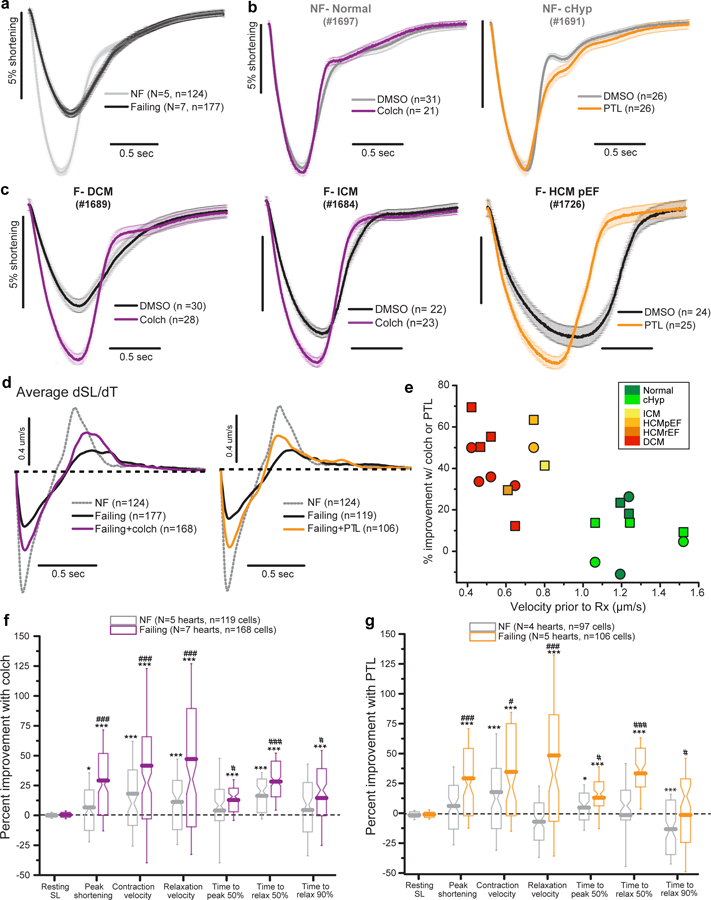
(a) Average sarcomere shortening from DMSO-treated myocytes from failing (black) and non-failing (gray) hearts. Shortening is shown normalized to resting length; the negative deflection represents contraction in response to electrical stimulation followed by relaxation back to the resting length. (b, c) Effects of colchicine or PTL on the contractility of myocytes from representative NF (b) and failing (c) hearts. (d) Average velocity traces from all NF, failing, and treated failing myocytes. (e) Correlation between initial velocity in untreated myocytes and percentage improvement in velocity after treatment with colch (square) or PTL (circle). Each data point represents the mean contraction and relaxation velocity from all cells in a particular heart color coded by group. (f, g) Pooled data showing percentage improvement in the indicated contractile parameters following treatment of NF or failing hearts with colch (f) or PTL (g), as compared to vehicle-treated cells. For colchicine treatment, NF n = 119 myocytes from N = 5 biologically independent hearts, failing n = 168 myocytes from N = 7 biologically independent hearts. For PTL, NF n = 97 myocytes from N = 4 biologically independent hearts, failing n = 106 myocytes from N = 5 biologically independent hearts. Boxes show 25th-75th percentile, whiskers are SD, with median notch and mean line calculated from n myocytes. Relax, relaxation; SL, sarcomere length. Detailed contractility measurements from each heart are available in Supplementary Table 6. Statistical significance determined via two-sided T tests, *p<0.05, **p < 0.01, ***p < 0.001 vs. DMSO; #p<0.05, ##p<0.01, ###p<0.001 vs. NF.
Upstream changes in excitation-contraction (EC) coupling could also contribute to the contractile alterations observed upon MT destabilization, for which there is precedent in the literature19. We thus measured electrically stimulated [Ca2+]i transients in failing and NF myocytes with colch and PTL treatment (Supplementary Fig. 4). [Ca2+]i transients exhibited reduced amplitudes and slowed kinetics in failing myocytes, suggesting that defects in EC coupling likely contribute to their observed contractile dysfunction (Fig. 4a). However neither colch nor PTL treatment improved this impaired [Ca2+]i cycling (Supplementary Fig. 4e), suggesting that the MT-dependent augmentation in contractility is primarily mechanical in origin. Colch had no significant effect on Ca2+ cycling in any group, while PTL treatment actually prolonged the [Ca2+]i transient decay phase in NF myocytes (Supplementary Fig. 4c, g). As discussed further below, this slowed [Ca2+]i removal may explain the prolonged late relaxation in PTL treated NF myocytes (Compare Supplementary Fig. 4c and Fig. 4b). Regardless, from these studies we conclude that any improvement in contractility by colch or PTL treatment is not likely due to improved [Ca2+]i cycling.
Genetic modification of tubulin tyrosination lowers stiffness and improves contractility
We next aimed to validate these pharmacologic findings with a genetic approach, particularly given potential off-target effects of PTL. While the aforementioned TCP detyrosinates MTs, this process can be readily reversed by tubulin tyrosine ligase (TTL), which catalyzes the re-addition of the tyrosine residue to α-tubulin tails (for review see 20). Adenoviral overexpression of TTL (AdV-TTL) for 48hrs in cultured human cardiomyocytes decreased the density of dTyr-MTs and the proportion of total MTs that were detyrosinated, while also producing a slight drop in overall MT density compared to myocytes infected with a null encoding adenovirus (AdV-null) (Fig. 5a). TTL overexpression led to a significant increase in shortening amplitude and velocity in these myocytes, and increased relaxation velocities ~2 fold (Fig. 5b-d). Stiffness measurements confirmed a large reduction in viscoelasticity in AdV-TTL myocytes compared to AdV-null (Fig. 5e, f), suggesting that contractile improvements are at least partly attributable to reduced internal resistance. While contractility experiments were typically performed at 0.5Hz stimulation at room temperature, we also tested whether similar improvements were observed at physiological temperature and pacing frequency. At 37°C all contractile parameters were similarly improved by TTL overexpression, and the magnitude of improvement was unchanged with either 0.5 or 1Hz stimulation (Supplementary Fig. 5). Of note, the late phase of relaxation was significantly faster with TTL overexpression (Fig. 5b, d right, Supplementary Fig. 5), in contrast to the prolongation of this component with PTL treatment. This suggests an off-target effect of PTL, as opposed to an on-target consequence of suppressing detyrosination. Together these results suggest that genetic manipulation of dTyr/Tyr balance represents a potent and specific tool to modulate contractility in human myocytes.
Fig. 5. Genetic modification of tubulin tyrosination reduces stiffness and improves contractility.
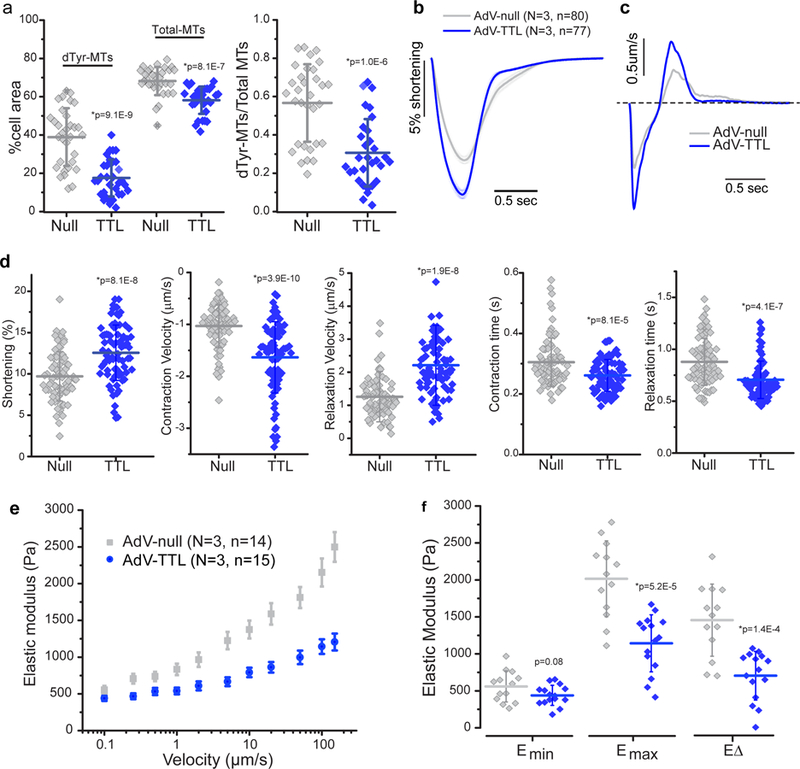
(a) Quantification of MT network density and dTyr-MT/total MT ratio (as described in Fig. 2d) following adenoviral-mediated overexpression of TTL (TTL) in cultured human cardiomyocytes, compared to myocytes infected with a null encoding adenovirus (Null). Null, n = 32 myocytes from N = 2 biologically independent hearts; TTL, n = 31 myocytes from N = 2 biologically independent hearts. (b) Average traces of sarcomere shortening in AdV-Null and AdV-TTL overexpressing cardiomyocytes. (c) Average contractile velocities of AdV-Null and AdV-TTL overexpressing cardiomyocytes (first derivative of (c)). (d) Quantification of contractile parameters. Each data point represents a single cardiomyocyte infected with AdV-null (n=80) or AdV-TTL (n=77) from N = 3 biologically independent hearts. (e) Viscoelasticity data (presented as mean +/− SE) and (f) quantification of viscoelasticity measurements on AdV-TTL and AdV-null expressing myocytes, presented as and quantified as described in Fig. 3. For a, b, d, and f, each data point represents a single myocyte, with mean line and whiskers as SD. Statistical significance determined via two-sided T-test with post-hoc Bonferroni correction, *p vs. AdV-null.
DISCUSSION
From the above we arrive at three major conclusions. First, the increased expression and stabilization of the non-sarcomeric cytoskeleton is a consistent feature of end stage heart failure. Second, an endogenously proliferated and modified MT network contributes viscoelastic resistance that impedes myocyte motion in heart failure. And third, destabilizing dTyr-MTs significantly lowers stiffness, enhances contractility and increases relaxation velocity in failing, human LV myocytes.
Our data suggest that whether dilated or hypertrophic in morphology, end-stage failing hearts share a surprisingly overlapping proteome. A dominant feature is the increased expression of cytoskeletal proteins, particularly IFs and MTs. We speculate that like other aspects of cardiac remodeling these changes may initially be adaptive, perhaps to protect a heart under high mechanical stress, but become maladaptive when sufficiently progressed.
Our results in diverse cases of heart failure complement previous correlative studies in patients with aortic stenosis21and in animal models that show MT proliferation following a variety of disease stimuli, including (but not limited to) LV pressure overload (dog3; mouse22), RV pressure overload (cats1), drug induced pulmonary hypertension (rats23,24; calf 25), dystrophic cardiomyopathy (mouse26,27) and diabetic cardiomyopathy (rats28). However, replication studies in LV overload models have also failed to show tubulin upregulation (guinea pig2,29; cats5), and contractility rescue via colchicine is far from consistent2,5,23. Here, functional tests on human myocytes provide clinically relevant evidence to revitalize and refine the pursuit of modified MTs as a therapeutic target in heart disease.
In aggregate, our data suggests that proliferated, detyrosinated MTs act as compression resistance elements to impair contraction in the failing heart. The efficacy of PTL treatment on stiffness and contractility – independent of an improvement in [Ca2+]i cycling or gross reduction in network density6,7 – is best explained by a disruption in the interaction between dTyr-MTs and the sarcomere, which lowers the compression resistance provided by a cross-linked cytoskeletal network7. In this light, the lesser effect of colch and PTL treatment on NF myocytes suggests that, in these cells, cytoskeletal resistance was insufficient to markedly impede contractility. This may be explained by a simple lack of MT density or detyrosination beyond a critical level, or resistance may be limited by the availability of MT interacting partners like desmin. In support of this hypothesis, myocytes lacking desmin appear insensitive to PTL, presumably due to the loss of a MT-IF crosslink7. Thus, the efficacy of MT destabilization may depend on the proliferation of IFs that support the formation of a dense, cross-linked cytoskeletal network. Of note, both full-length desmin and lower MW products linked to aggregation were markedly upregulated in heart failure samples here and in a previous examination of dyssynchronous heart failure9. The contribution of modified desmins to viscoelasticity and proteotoxicity demands further investigation.
We observed the largest improvements in contractile velocities with the tyrosination of MTs by AdV-TTL in cultured myocytes. Given the reduced MT network density and viscoelasticity in these cells, this improvement is likely attributable to reduced internal resistance. However, additional mechanisms may be at play, and warrant discussion when considering chronic effects of suppressing dTyr-MTs. Prolonged destabilization of MTs can prevent some of the adverse remodeling of the T-tubule system and subsequent disruption of E-C coupling that occurs in both heart failure and cell culture22,24. Further, suppressing dTyr has specifically been shown to reduce the generation of mechanical-stress induced reactive oxygen species, which could also benefit cell function by minimizing oxidative stress6,26. MTs also regulate mitochondrial positioning in cardiomyocytes30, and broadly regulate vesicular transport, although any role of detyrosination in these processes remains to be explored.
Regardless of these confounding factors, the genetic modification of Tyr/dTyr balance represents a targeted approach with significant potential to sustainably improve both systolic and diastolic function. Our results suggest the improvement in myocyte function will likely correlate with the degree of myocyte stiffening and the slowing of contractile velocities, which will vary with disease etiology and severity. Further, while myocyte mechanics regulate whole organ function, this relationship is complex and will depend on numerous contributing factors. For example, in an ischemic, heavily fibrotic heart, tissue stiffness may be largely determined by the infiltrative extracellular matrix, potentially rendering a MT contribution nominal; yet in idiopathic or congenital myopathy with minimal fibrosis, myocyte specific changes, like those contributed by MTs and/or titin, would be predicted to play a more dominant role.
Given its potential as a novel inotrope, the clinical value of targeting MTs for the treatment of heart failure should be re-evaluated. The daily dose of oral colchicine for patients with gout is typically 1 mg, which gives rise to mean peak plasma concentrations of ~10–30 nM31. While tissue levels may differ from that in serum, this concentration is at least an order of magnitude lower than the dosage required to depolymerize cardiac MTs. The ratio of benefit to adverse effects is already poor with this dosage32, suggesting that sufficiently high concentrations of colchicine may be difficult to achieve in patients. Manipulating Tyr/dTyr balance represents a more refined therapeutic approach that largely spares the integrity of the MT network. PTL is an existing, FDA-approved option for the treatment of certain cancers, but shows undesirable effects on the prolongation of the [Ca2+]i transient and contractile relaxation that may prove problematic. This prolonged Ca2+ transient is seen in human, but not mouse myocytes6, a finding that would be explained by an off-target effect of PTL on Na2+/Ca2+ exchanger (NCX) activity, as human myocytes rely more heavily on NCX for the removal of cytosolic Ca2+ during relaxation. Promisingly, this prolonged relaxation is absent in TTL over-expressing human myocytes, suggesting that more specific pharmacologic or genetic approaches to manipulate Tyr/dTyr balance should be pursued.
Finally, there is reason for optimism on the success of a MT-based inotropic strategy where others have failed. Currently available inotropes, such as dobutamine and milrinone, are endorsed for stabilization of patients with cardiogenic shock, as a bridge to transplant or long-term mechanical circulatory support, or as palliative therapy33, because their long-term use may actually worsen patient outcomes34. This is at least partly attributed to the increased metabolic cost and arrhythmia risk associated with chronically augmenting Ca2+ cycling or force production. Destabilizers of a dense cytoskeletal network would theoretically represent a new class of energetically neutral inotropes, which do not force the cell to burn more ATP, but simply lower the resistance the myocyte must work against to improve both systolic and diastolic performance.
ONLINE METHODS
Human myocardial tissue
Procurement of human myocardial tissue was performed under protocols ethical regulations approved by Institutional Review Boards at the University of Pennsylvania and the Gift-of-Life Donor Program (Pennsylvania, USA). Failing human hearts were procured at the time of orthotropic heart transplantation at the Hospital of University of Pennsylvania following informed consent from all participants. Non-failing (NF) hearts were obtained at the time of organ donation from cadaveric donors. In all cases, hearts were arrested in situ using ice-cold cardioplegia solution and transported on wet ice. Whole hearts and dissected left ventricle (LV) cavity were weighed to determine levels of hypertrophy. Transmural myocardial samples were dissected from the mid LV free wall below the papillary muscle. LV tissues for mass spectrometry and western blot were flash frozen in liquid nitrogen within 4 hours of explantation. Contractile parameters, including left ventricle ejection fraction (LVEF), were determined by echocardiography in patients.
Classification standard: NF donor hearts (with an LVEF greater than 50%) are further divided into normal and compensated hypertrophy (cHyp). cHyp is defined by an indexed LV mass (LV mass/body surface area) above 115g/m2 in men and 95g/m2 in women35. Failing hearts are etiologically defined by clinical diagnosis of hypertrophic cardiomyopathy (HCM), which is subdivided into HCM with preserved EF (HCMpEF EF>50%) and HCM with reduced EF (HCMrEF EF<50%). Failing hearts with dilated LV chamber size are classified as dilated cardiomyopathy (DCM), and failing hearts with ischemic injury are grouped as ischemic cardiomyopathy (ICM). A proportion of the failing hearts manifest a combination of mixed ischemic and dilated etiology.
34 hearts in total were used in mass spectrometry (see method details below), including 7 normal, 6 cHyp, 4 HCMpEF, 5 HCMrEF, 6 DCM, 6 ICM. Myocytes were isolated from 22 hearts (see method details below) for functional studies, including 6 normal and 7 cHyp, 9 failing transplants (all hearts with EF<50%, including 6 DCM, 1HCMpEF, 1 HCMrEF, 1 ICM). All data collected from these patients are included in this study. For further details on classification, descriptive statistics and experiments performed on each heart and a summary see Supplementary Table 1.
Human left ventricular myocyte isolation
Hearts received cold, blood-containing, high-potassium cardioplegic solution in vivo. Explanted hearts were transported from the operating suite to the laboratory in cold Krebs-Henseleit buffer (KHB) solution (12.5 mM glucose, 5.4 mM KCl, 1 mM lactic acid, 1.2 mM MgSO4, 130 mM NaCl, 1.2 mM NaH2PO4, 25 mM NaHCO3, and 2 mM Na pyruvate, pH 7.4). Myocytes were disaggregated by use of a modification of isolation techniques described previously36. Briefly, hearts were weighed and rinsed in KHB. A non-infarcted free wall region of the LV apex was dissected and a small catheter was placed into the lumen of the left ventricular descending (LAD) artery. Major large vessels on the tissue piece were identified by injecting KHB via the cannula and tied by suture knots to improve perfusion via small vessels. Once the tissue was ready for perfusion, it was covered by plastic wrap with pores for outflow, in order to maintain tissue temperature at 37˚C. The cannulated LV tissue was perfused with a non-recirculating Ca2+-free solution (KHB containing 20 mM BDM and 10 mM taurine) for 10–15 minutes until the outflow temperature reached around 37˚C. Then, 200 mL of KHB containing 294 U/mL collagenase, 20 mM BDM and 10 mM taurine was perfused for 3 mins without recirculation and followed by 22–32 mins with recirculation (depending on the cannulation and how fibrotic the tissue was). Ca2+ was introduced stepwise per minute by adding CaCl2 solution up to 1mM, i.e. 4 X 50μM, 4 X 100μM and 2 X 200μM into the recirculated collagenase solution. Then the tissue was perfused for 5 minutes with rinse solution (KHB containing 10 mM taurine, 20 mM BDM, 1 mM CaCl2 and 1% BSA). The tissue was then removed from the cannula, and myocardial tissue was minced in the rinse solution and triturated using glass pipets. The resulting cell suspension was filtered through 280μm nylon mesh (Component supply U-CMN-280), centrifuged (25g for 2 min), and resuspended in rinse solution. The temperature was maintained at 37°C throughout the isolation. Viable cells were enriched by gravity-sedimentation for 5 min, and the resulting loose pellet was transferred to a fresh tube and resuspended in proper amount of normal Tyrode’s (NT) solution for contractility, [Ca2+]i transients and nanoindentation. Cells were also fixed for immunofluorescence (see details below).
Mass Spectrometry of human left ventricular tissues
Sample preparation.
Human left ventricular tissues collected from a myocardial rich, minimally fibrotic region of the mid LV wall were used for mass spectrometry. Tissue was homogenized in ice-cold RIPA lysis buffer containing 0.1% SDS (Cayman 10010263) supplemented with protease inhibitor cocktail (Sigma). Protein concentration was determined by protein assay dye reagent (Bio-Rad 5000205). 100 μg protein from each sample was precipitated as previously described37. The pellet was resuspended with 8 M urea, 100 mM NH4HCO3, and pH 8.0. Denaturation/reduction was performed in 8 M urea/5 mM dithiothreitol/25 mM NH4HCO3 (pH 8.0) for over 60 min in 52°C. The solution was stored at room temperature in 25 mM iodoacetamide at the dark for 60 min. The urea was diluted to a concentration of 1 M with 25 mM NH4HCO3 and then digested with trypsin (1:50 ratio) at 37°C with shaking for 16 hrs. After tryptic digestion, peptide mixture was desalted with C18 micro spin column (C18, Harvard Apparatus, and Holliston, MA). The column was washed with 200 μL of 100 % acetonitrile and equilibrated with 200 μL of loading buffer (0.1 % formic acid). Peptides were loaded onto the column, washed with a loading buffer and eluted with 200 μL of 70 % acetonitrile/ 0.1 % formic acid. All steps for loading, washing, and elution were carried out with benchtop centrifugation (300 x g for 2 min). The eluted samples were dried in a centrifugal vacuum concentrator and reconstituted with 0.1% formic acid.
Nano liquid chromatography and mass spectrometry.
Desalted peptides were analyzed on a Q-Exactive (Thermo Scientific) attached to an EasyLC system run at 300 nL/min. Peptides were eluted with a 170 min gradient from 2% to 32% ACN and to 98% ACN over 10 min in 0.1% formic acid. Data dependent acquisition mode with a dynamic exclusion of 45 s was enabled. One full MS scan was collected with scan range of 350 to 1600 m/z, resolution of 70 K, maximum injection time of 50 ms and automatic gain control (AGC) of 1E6. Then, a series of MS2 scans were acquired for the most abundant ions from the MS1 scan (top 12). Ions were filtered with charge 2–4. An isolation window of 2.0 m/z was used with quadruple isolation mode. Ions were fragmented using higher-energy collisional dissociation (HCD) with collision energy of 27%. Orbitrap detection was used with scan range of 200 to 2000 m/z, resolution of 17.5 K, maximum injection time of 150 ms and automatic gain control of 5E6.
Proteomics MS data analysis including peptide identification and quantification.
MaxQuant version 1.5.3.30 was used to process the raw spectra38. The uniprot human database was used for database searching. Default search parameters were used, including precursor mass tolerance of 20 ppm, fragment mass tolerance of 20 ppm, trypsin cleavage and up to 2 mis-cleavages. Carbamidomethyl [C] was set as fixed modification, while Oxidation [M] was set as variable modifications. The target-decoy approach was used to filter the search results39, in which the false discovery rate was less than 1% at the peptide and protein level. LFQ (Label-free quantification) and iBAQ (intensity-based absolute-protein-quantification) were enabled.
For details on statistical analysis of proteomic data please see “Statistics and Reproducibility.”
Drug treatment
Viable myocytes were concentrated by gravity (5–7min) and supernatant was aspirated to remove dead cells. Myocytes were resuspended in NT solution containing 1mM Ca2+ and concentrated by gravity (5–7min) again. Cardiomyocytes used acutely were maintained in NT solution for up to 6 hours. Myocytes were treated with 10 μΜ parthenolide (Fisher Scientific NC9013142 or Sigma P0667) or 10μΜ colchicine (Sigma) at room temperature in NT solution for 2 hours. Experiments were performed within 6 hours of isolation, except for those involving viral transduction in cultured cells.
NT Solution: NaCl, 140 mM; MgCl2, 0.5 mM; NaH2PO4, 0.33 mM; HEPES, 5 mM; Glucose, 5.5 mM; CaCl2, 1 mM; KCl, 5 mM; NaOH, pH to 7.4.
Cell culture and viral transduction
MatTek glass bottom dish was coated with 5μl of 0.5mg/ml laminin and air dried for 10 min. Culture medium consisted of F-10 (1X) Nutrient Mixture (Ham) [+] L-Glutamine (Life Technologies, 11550–043) supplemented with insulin-transferrin selenium-X (Gibco, 51500–056), 20mM HEPES, 1 μg/μl primocin (Invivogen, ant-pm-1), 0.4mM extra CaCl2, 5% FBS, and 25μM cytochalasin D (Cayman, 11330). Viable myocytes were concentrated and the proper amount of medium was added in culture so that neighboring cells were not in direct contact. Viral constructs were permitted to express for 48 hours with MOI = 100–200. Adenoviral TTL-IRES-dsRed and EMTB-3x GFP7 were transduced in human myocytes as previously performed in rat myocytes7. To recover the maximal contractile function in cultured human myocytes, we found it important to replenish myocytes with fresh warm medium without cytochalasin D prior to calcium and contractility measurements.
Cell contractility
Experiments were performed as previously described7 with some modification. Contractility was measured in custom-fabricated cell chambers (Ionoptix) mounted on an LSM Zeiss 880 inverted confocal microscope using a 40x oil 1.4 NA objective and transmitted light camera (IonOptix MyoCam-S). Myocytes were maintained in NT solution (for freshly isolated myocytes) or culture medium (without cytochalasin D, for cultured myocytes) at room temperature and electrical field stimulation was provided at 0.5 Hz with a myopacer (IonOptix MYP100) through platinum electrodes lowered into the bath. Sarcomere length was measured optically by Fourier transform analysis (IonWizard, IonOptix). After 10–30s of 0.5 Hz pacing to achieve steady state, five traces were recorded and analyzed. If not specified, contractility data was obtained at room temperature. The number of myocytes and hearts used in each experiments and further details are listed in Supplementary Table 6.
To test whether the contractile improvement with MT destabilization remains under more physiological conditions, both 0.5 Hz and 1Hz contractions at 37˚C were recorded and analyzed in a small subset of isolated human myocytes (1 NF and 1 failing heart, Supplementary Fig. 5c).
Calcium Measurements
Calcium measurements were carried out as previously described7 with the following modifications. Myocytes were loaded with 1μM Fluo-3-acetoxymethyl ester (Invitrogen) and 15% Pluronic F127 (a poloxamer made by BASF, Florham Park, NJ, USA) for 15 minutes. Cells were scanned using a 488-nm argon ion laser in confocal line-scan mode at 0.909 ms/line. Cells were electrically paced at 0.5 Hz at room temperature for 30 s to achieve steady state; five steady-state transients of each myocyte were averaged, pooled in groups and analyzed for calcium transient properties. The measured fluorescence (F) throughout the transient was normalized to the resting fluorescence prior to stimulation (F0) to normalize for heterogeneity in dye loading.
Immunofluorescence (IF)
Cells were fixed in pre-chilled methanol at −20 °C for 7 min. After washing with phosphate buffered saline (PBS) for four times, cells were placed in blocking buffer (Seablock, Abcam ab166951) for 1 hour, then labeled with primary antibodies (below) for 48 hours at 4°C. Cells were then washed 4x in blocking buffer, labeled with secondary antibodies (below) at room temperature and washed 3x in blocking buffer. Stained cells were mounted on mouse laminin (Roche 11243217001) coated #1.5 coverslips (22mm x 22mm, Globe Scientific 1404–15) using Prolong Gold Antifade Mountant (Life Technologies P36934) for imaging.
Immunofluorescence on paraffin tissue section
Human left ventricle tissues were fixed in 4% paraformaldehyde (PFA) in PBS. Tissue dehydration (reagent alcohol 70% 60min, 95% 60min x 2, 100% 60min x 3, 37˚C), clearing (xylene 90min x 3, 37˚C), and wax infiltration (110 min and 80 min x 2, 62˚C) was automated in a tissue processor (ThermoScientific Excelsior AS). Tissues were then embedded in paraffin on the embedding station. Five-micron tissue sections were cut on a microtome (ThermoScientific Shandon Finesse 325) and mounted on positive charged glass slides (Globe Scientific 1358A).
Slides were placed in a slide rack and rinsed in xylene 2× 3min for deparaffinization. Tissue sections were re-hydrated in reagent alcohol, 100% 2min x 2, 95% 2min x 2, 70% 2min, ddH2O 2min. Slides were immersed in 1% Tween-20 solution for 5 minutes for permeabilization, then rinsed in diH2O very briefly, and immersed in 100°C antigen retrieval buffer (Tris-EDTA buffer, containing10 mM Tris base, 1 mM EDTA solution, 0.05% Tween 20, pH 9.0.) on a steamer for 40 minutes. Slide chambers with buffer and slides were removed from steamer and allowed to cool at room temperature for 20 minutes. After brief rinses in ddH20, slides were blocked in Seablock for 1 hr at room temperature. Primary antibodies (1:50 in blocking buffer) were incubated over 3 nights at 4°C. Sections were rinsed PBS x 3 and labeled with secondary antibodies (1:1000) for 1 hr at room temperature. Nuclei were labeled with Hoechst 33342 (1:1000) for 10 min. Slides were rinsed with PBS x 4, blot dry, and mounted using Prolong Diamond Antifade mounting medium (Thermo Fisher Scientific, #P36965) for imaging.
Western blotting
For analysis of protein expression levels quantitative western blots (WB) were performed using infrared fluorescence imaging on an Odyssey Imager (LI-COR). Human left ventricular tissue homogenates were prepared in ice-cold RIPA lysis buffer containing 0.1% SDS (Cayman 10010263) supplemented with protease inhibitor cocktail (Sigma). In some of the homogenates, lysis buffer also contained protease/phosphatase inhibitor cocktail (Cell signaling 5872). Protein concentration was determined by protein assay dye reagent (Bio-Rad). Aliquots of supernatants were mixed with 4x sample buffer (LI-COR, 928–40004) containing 10% BME, boiled for 10 min, and resolved on sodium dodecyl sulfate (SDS)-polyacrylamide gel electrophoresis Tris-glycine gels (Bio-Rad). Proteins were transferred to a membrane on Mini Trans-Blot Cell (Bio-Rad), blocked 1 hour in Odyssey Blocking Buffer (TBS) (LI-COR, 927–50000), and probed with the corresponding primary antibodies (see list below) overnight at 4˚C. Membranes were then rinsed with TBS containing 0.05% Tween (TBST) 20 4x for 5 min, and incubated with secondary antibodies (below) in TBS supplemented with 0.2% Tween20 for 1 hour at room temperature. Membranes were rinsed again with TBST and then imaged on Odyssey Imager. Image analysis was performed using Image Studio Lite software (LI-COR). GAPDH was used as loading control. We also controlled for variability of different experiments/blots by including 3 reference samples from normal group in every blot. Fluorescent band intensity was normalized to GAPDH. Before pooling data from different blots, the values were again normalized to the average of the 3 reference samples. Analysis was performed blinded to the experimental groups.
Antibodies and labels
Alpha tubulin; mouse monoclonal, clone DM1A (Cell Signaling #3873)- isolated myocyte IF 1:100, tissue section IF 1:50 (primary labeled Atto- or dylight-488, Innova Biosciences, 322–0010, 350–0010); WB 1:1000
Tyrosinated tubulin; mouse monoclonal, clone TUB-1A2 (Sigma T 9028); isolated myocyte IF 1:200, WB 1:1000
Detyrosinated tubulin; rabbit polyclonal (abcam ab48389); isolated myocyte IF 1:200; WB 1:1000
Tubulin tyrosine ligase; rabbit polyclonal (proteintech 13618–1-AP); WB 1:500
GAPDH; mouse monoclonal, clone 3B1E9 (GenScript A01622–40); WB 1:1000
Desmin; goat polyclonal (R&D AF3844); IF 1:100 (primary labeled Atto 565, Innova Biosciences); WB: 1:1000
Goat anti-mouse AF 647 (Life Technologies, A-21235); IF 1:500
Goat anti-rabbit AF 488 (Life Technologies, A-11034); IF 1:500
IRDye800CW Donkey anti-Mouse IgG (H + L) (LI-COR, # 925–32212); WB 1:10000
IRDye680RD Donkey anti-Rabbit IgG (H + L) (LI-COR, #925–68073); WB 1:10000
Lightning Link Rapid Atto565 (Innova Biosciences, 351–0030), Atto 488 (322–0010) and dylight 488 (350–0010)
Hoechst 33342 (1:1000) for labeling nuclei
Imaging equipment and analysis
Confocal imaging was carried out on a Zeiss 880 laser scanning confocal microscope operating on an Axiovert Z1 inverted microscope equipped with a 40x oil 1.4 NA objective. High-speed super resolution imaging was carried out on a Zeiss 880 Airyscan confocal with a 40× 1.4 oil NA objective. Image analysis was performed using ZEN Black software for Airyscan processing, which involves signal integration from the 32 separate sub-resolution detectors in the Airyscan detector and subsequent deconvolution of this integrated signal. Additional signal processing was performed in Image J (NIH). For calculating the microtubule (MT) fraction of cell area (Fig. 2d), image analysis was performed blinded to the experimental groups. A 2-μm max intensity projection was produced from four 0.5-μm confocal z-sections. The threshold to determine MT positive pixels was determined from the average fluorescence of three background regions that clearly demonstrated no MT staining within the cell. From the resulting binary images (Fig. 2d top), the MT positive fraction of the total cell area was calculated for dTyr-MT and Tyr-MT network (Fig. 2d bottom). Then binary images of both dTyr- and Tyr-MT channels were overlaid to generate a binary image of the total MT network of the cell, which enables the quantification of total-MT area and ratio of dTyr-MT/ total MT (Fig. 2d bottom).
Structured Illumination Microscopy (SIM) was performed on a Deltavison OMX microscope, equipped with a Front Illuminated sCMOS camera (2560 ×2160 pixels), 6 color solid state illuminator and 100× 1.4NA oil immersion lens powered by a OMX Master Workstation.
Nanoindentation – Stiffness measurements
Mechanical properties at the microscopic scale were measured using nanoindentation (Piuma Chiaro, Optics11, The Netherlands). Freshly isolated human myocytes were attached to glass bottom dishes coated with MyoTak26 in NT solution (1 mM Ca2+) at room temperature. A spherical nano-indentation probe with a radius of 3.05 µm and a stiffness of 0.026 N/m was used. Myocytes were indented to a depth of 1.5–3.5 µm with velocities of 0.1, 0.25, 0.5, 1.0, 2.0, 5.0, 10.0, 20.0, 50.0, 100.0, and 150.0 μm/s. The tip was held in this indentation depth for 1 s, and retracted over 2 s. The Young׳s moduli were calculated automatically by the software, by fitting the force vs. indentation curve to the Hertz equation. The Young׳s modulus E is derived from the fit of the initial 60% of the loading force-displacement curve (F(h)), the indenter tip radius (R) and indentation depth (h), according to the following formula, for which a Poisson׳s ratio (ν) of 0.5 was assumed.
Number of myocytes and hearts used in this experiment and further details are listed in Supplementary Table 5.
Statistics and Reproducibility
Proteomic analysis and statistics
Mass spectrometry (MS) was performed in multiple hearts (biologically independent samples) for each group (Figure 1 and Supplementary Figure 1a-e). Number of human hearts used (Normal N=7, cHyp N=6, ICM N=6, HCMpEF N=4, HCMrEF N=5, DCM N=6) is stated in figure legends.
LFQ values measured by MS were used to represent the expression levels of proteins. Box plots of sample variance indicate normal distributions in each sample (Supplementary Fig. 1a, box represents upper and lower quantiles, line median and whiskers 1.5 inter quantile range). Duplicated protein entries with lower LFQ values were removed. Also, protein entries with a median LFQ value of 0 were removed to exclude proteins expressed at very low levels or undetected by MS. This resulted in a trimmed list of 2676 proteins, and LFQ values from this list were used to perform principal component analysis (PCA). To obtain a general view of sample distribution among disease conditions and evaluate whether there is biased distribution toward certain gender or age groups, the 500 genes with the highest variance among all samples were input in PCA performed using the FactoMineR R software package. Samples in the PCA plots are color coded by disease groups, age or gender to illustrate any distribution pattern/cluster based on these factors (Fig. 1a, Supplementary Fig. 1b-e; source data file Supplementary Spreadsheet MS data). To concentrate on difference from the most variable proteins and discover the genes contributing to the difference, a 2D-PCA biplot was generated (Supplementary Fig. 1b). MS Raw data was deposited in PRIDE with dataset identifier PXD008934.
Differential gene expression analysis was used to assess prominent changes in disease groups, resulted in a protein list ranked by statistical significance obtained from LIMMA, an R package with a linear model adjusting for age and sex. P values were adjusted for multiple testing using the Benjamini-Hochberg procedure. Fig. 1d top left shows the top 10 upregulated genes in HCMrEF and DCM groups, which is ranked by the adjusted P values from LIMMA analysis. Supplementary Table 2 is a summary of the top 25 up- and down-regulated proteins from differential gene expression analysis. The ranked lists of top 500 upregulated genes in each group (compared to normal) were used for gene list functional enrichment analysis (Toppfun), performed on Toppgene website11. The top 20 upregulated molecular function GO groups in each comparison (see Supplementary Table 3) were summarized and then compiled into a list of functionally non-redundant GO groups (with more than 10% hit counts/input list in at least one of the comparisons). This list of GO groups was expressed in a heat map (Fig. 1b) color coded by -log10 q-value B+H (statistical significance obtained from Toppfun analysis). Color coded heat maps based on log2 fold change (Fig. 1c) and dot plots of LFQ values (Fig. 1d) were also made to visualize protein expression shifts in specific cytoskeletal groups/genes of interest among disease groups. Morpheus (https://software.broadinstitute.org/morpheus/) was used to generate heat maps. Results of the domain enrichment analysis are available in Supplementary Table 4.
Other data analysis and statistics
Statistical analysis and graphing were performed using Origin software (OriginLab, Northampton, MA). Values are presented as means ± standard error in line graphs; all dot plots are shown with mean line ± standard deviation with all data points shown; for box and whisker plots, box represents 25th to 75th percentiles, the whiskers 1SD, with median notch and mean line.
For Fig. 2–5 and Supplementary Fig. 1f, Fig.2–6, all experiments were replicated in multiple hearts (biologically independent samples/independent experiments) for each condition, indicated by the N number in each figure and figure legend. The exact n values used to calculate statistics and the statistical tests for significance are stated in individual figure legends. In summary, where comparisons between sets were both repetitive and restricted, the Bonferroni multiple comparisons correction was used to adjust the significance threshold of two-sided T-tests accordingly (Fig. 2d-f, 4f-g, 5a, 5d, 5f; Supplementary Fig. 5c). Multiple comparisons- ANOVA with post-hoc Tukey test was used when multiple data sets shared a single control condition (Fig. 3b; Supplementary Fig. 1f, 2c-d, 4e-g). Outlier exclusion was applied to immunofluorescence quantification data (Fig. 2d) exceeding 2 standard deviations from the mean. Degrees of freedom for all ANOVA is equal to number of groups minus one (Fig. 3b, Supplementary Fig. 1f, 2c-d, 4e-g). Degrees of freedom for all two-sample two-sided T-tests is equal to the combined number of data points (n) minus two (Fig. 2d-f, Fig. 5a,d,f), while degrees of freedom for all one-sample two-sided T-tests is equal to n minus one (Fig. 4f-g, Supplementary Fig. 5c).
Supplementary Material
ACKNOWLEDGMENTS
We would like thank the Quantitative Proteomics Resource core of Perelman School of Medicine and the Penn Center for Musculoskeletal Disorders (PCMD) histology core at University of Pennsylvania. This work was supported by funding from National Institute of Health (NIH) R01-HL133080 to B.L.P. and T32 R05346–09 to P.R., American Heart Association 17POST33440043 to M.A.C., and by the Center for Engineering MechanoBiology (CEMB) through a grant from the National Science Foundation’s Science and Technology Center program: 15–48571. The procurement of human heart tissue was enabled by grants from NIH (HL089847 and HL105993) to K.B.M.
Footnotes
DATA AVAILABILITY
The datasets generated or analyzed for the current study are available from the corresponding author upon reasonable request. The mass spectrometry proteomics data have been deposited to the ProteomeXchange Consortium via the PRIDE40 partner repository with the dataset identifier PXD008934. Figure 1 and Supplementary Figure 1 and Supplementary Tables 2 – 4 were generated from this associated source data.
COMPETING FINANCIAL INTERESTS
The authors declare no competing financial interests.
REFERENCES
- 1.Tsutsui H, Ishihara K & Cooper G Cytoskeletal role in the contractile dysfunction of hypertrophied myocardium. Science 260, 682–687 (1993). [DOI] [PubMed] [Google Scholar]
- 2.Collins JF et al. The role of the cytoskeleton in left ventricular pressure overload hypertrophy and failure. J. Mol. Cell. Cardiol 28, 1435–1443 (1996). [DOI] [PubMed] [Google Scholar]
- 3.Tagawa H et al. Cytoskeletal role in the transition from compensated to decompensated hypertrophy during adult canine left ventricular pressure overloading. Cir. Res 82, 751–761 (1998). [DOI] [PubMed] [Google Scholar]
- 4.Ishibashi Y et al. Role of microtubules in myocyte contractile dysfunction during cardiac hypertrophy in the rat. Am. J. Physiol 271, H1978–87 (1996). [DOI] [PubMed] [Google Scholar]
- 5.Bailey BA, Dipla K, Li S & Houser SR Cellular basis of contractile derangements of hypertrophied feline ventricular myocytes. J. Mol. Cell. Cardiol 29, 1823–1835 (1997). [DOI] [PubMed] [Google Scholar]
- 6.Kerr JP et al. Detyrosinated microtubules modulate mechanotransduction in heart and skeletal muscle. Nat. Commun 1–14 (2015). [DOI] [PMC free article] [PubMed] [Google Scholar]
- 7.Robison P et al. Detyrosinated microtubules buckle and bear load in contracting cardiomyocytes. Science 352, aaf0659 (2016). [DOI] [PMC free article] [PubMed] [Google Scholar]
- 8.Robison P & Prosser BL Microtubule mechanics in the working myocyte. J. Physiol. (Lond.) (2017). [DOI] [PMC free article] [PubMed] [Google Scholar]
- 9.Agnetti G et al. Desmin modifications associate with amyloid-like oligomers deposition in heart failure. Cardiovasc. Res 102, 24–34 (2014). [DOI] [PMC free article] [PubMed] [Google Scholar]
- 10.Burke MA et al. Molecular profiling of dilated cardiomyopathy that progresses to heart failure. JCI Insight 1, (2016). [DOI] [PMC free article] [PubMed] [Google Scholar]
- 11.Chen J, Bardes EE, Aronow BJ & Jegga AG ToppGene Suite for gene list enrichment analysis and candidate gene prioritization. Nucleic Acids Res 37, W305–11 (2009). [DOI] [PMC free article] [PubMed] [Google Scholar]
- 12.Frolova EG et al. Thrombospondin-4 regulates fibrosis and remodeling of the myocardium in response to pressure overload. FASEB J 26, 2363–2373 (2012). [DOI] [PMC free article] [PubMed] [Google Scholar]
- 13.Wulfkuhle JD et al. Domain analysis of supervillin, an F-actin bundling plasma membrane protein with functional nuclear localization signals. J. Cell Sci 112 (Pt 13), 2125–2136 (1999). [DOI] [PubMed] [Google Scholar]
- 14.Takahashi M et al. Phenotypic consequences of beta1-tubulin expression and MAP4 decoration of microtubules in adult cardiocytes. Am. J. Physiol. Heart Circ. Physiol 285, H2072–83 (2003). [DOI] [PubMed] [Google Scholar]
- 15.Cheng G et al. Basis for MAP4 dephosphorylation-related microtubule network densification in pressure overload cardiac hypertrophy. J. Biol. Chem 285, 38125–38140 (2010). [DOI] [PMC free article] [PubMed] [Google Scholar]
- 16.Prota AE et al. Structural basis of tubulin tyrosination by tubulin tyrosine ligase. J. Cell Biol 200, 259–270 (2013). [DOI] [PMC free article] [PubMed] [Google Scholar]
- 17.Prins KW et al. Dystrophin is a microtubule-associated protein. J. Cell Biol 186, 363–369 (2009). [DOI] [PMC free article] [PubMed] [Google Scholar]
- 18.Caporizzo MA et al. Strain-rate Dependence of Elastic Modulus Reveals Silver Nanoparticle Induced Cytotoxicity. Nanobiomedicine (Rij) (2015). [DOI] [PMC free article] [PubMed] [Google Scholar]
- 19.Gomez AM, Kerfant BG & Vassort G Microtubule disruption modulates Ca2+ signaling in rat cardiac myocytes. Circ. Res 86, 30–36 (2000). [DOI] [PubMed] [Google Scholar]
- 20.Janke C & Bulinski JC Post-translational regulation of the microtubule cytoskeleton: mechanisms and functions. Nat. Rev. Mol. Cell Biol 12, 773–786 (2011). [DOI] [PubMed] [Google Scholar]
- 21.Zile MR et al. Cardiocyte cytoskeleton in patients with left ventricular pressure overload hypertrophy. J. Am. Coll. Cardiol 37, 1080–1084 (2001). [DOI] [PubMed] [Google Scholar]
- 22.Zhang C et al. Microtubule-Mediated Defects in Junctophilin-2 Trafficking Contribute to Myocyte T-Tubule Remodeling and Ca2+ Handling Dysfunction in Heart Failure. Circulation (2014). [DOI] [PMC free article] [PubMed] [Google Scholar]
- 23.Stones R, Benoist D, Peckham M & White E Microtubule proliferation in right ventricular myocytes of rats with monocrotaline-induced pulmonary hypertension. J. Mol. Cell. Cardiol 56, 91–96 (2013). [DOI] [PMC free article] [PubMed] [Google Scholar]
- 24.Prins KW et al. Colchicine Depolymerizes Microtubules, Increases Junctophilin-2, and Improves Right Ventricular Function in Experimental Pulmonary Arterial Hypertension. J. Am. Heart Assoc 6, (2017). [DOI] [PMC free article] [PubMed] [Google Scholar]
- 25.Lemler MS et al. Myocyte cytoskeletal disorganization and right heart failure in hypoxia-induced neonatal pulmonary hypertension. Am. J. Physiol. Heart Circ. Physiol 279, H1365–76 (2000). [DOI] [PubMed] [Google Scholar]
- 26.Prosser BL, Ward CW & Lederer WJ X-ROS Signaling: Rapid Mechano-Chemo Transduction in Heart. Science 333, 1440–1445 (2011). [DOI] [PubMed] [Google Scholar]
- 27.Prins KW, Asp ML, Zhang H, Wang W, & Metzger JM Microtubule-Mediated Misregulation of Junctophilin-2 Underlies T-Tubule Disruptions and Calcium Mishandling in mdx Mice. JACC: Basic to Transl. Sci 1, 122–130 (2016). [DOI] [PMC free article] [PubMed] [Google Scholar]
- 28.Shiels H et al. Stable microtubules contribute to cardiac dysfunction in the streptozotocin-induced model of type 1 diabetes in the rat. Mol. Cell. Biochem 294, 173–180 (2007). [DOI] [PubMed] [Google Scholar]
- 29.Wang X, Li F, Campbell SE & Gerdes AM Chronic pressure overload cardiac hypertrophy and failure in guinea pigs: II. Cytoskeletal remodeling. J. Mol. Cell. Cardiol 31, 319–331 (1999). [DOI] [PubMed] [Google Scholar]
- 30.Miragoli M et al. Microtubule-Dependent Mitochondria Alignment Regulates Calcium Release in Response to Nanomechanical Stimulus in Heart Myocytes. Cell Rep 14, 140–151 (2016). [DOI] [PMC free article] [PubMed] [Google Scholar]
- 31.Rochdi M, Sabouraud A, Girre C, Venet R & Scherrmann JM Pharmacokinetics and absolute bioavailability of colchicine after i.v. and oral administration in healthy human volunteers and elderly subjects. Eur. J. Clin. Pharmacol 46, 351–354 (1994). [DOI] [PubMed] [Google Scholar]
- 32.Terkeltaub RA Clinical practice. Gout. N. Engl. J. Med 349, 1647–1655 (2003). [DOI] [PubMed] [Google Scholar]
- 33.Yancy CW et al. 2013 ACCF/AHA guideline for the management of heart failure: a report of the American College of Cardiology Foundation/American Heart Association Task Force on Practice Guidelines. J. Am. Coll. Cardiol 62, e147–239 (2013). [DOI] [PubMed] [Google Scholar]
- 34.Cuffe MS et al. Short-term intravenous milrinone for acute exacerbation of chronic heart failure: a randomized controlled trial. JAMA 287, 1541–1547 (2002). [DOI] [PubMed] [Google Scholar]
- 35.Lang RM et al. Recommendations for chamber quantification. Eur. J. Echocardiogr 7, 79–108 (2006). [DOI] [PubMed] [Google Scholar]
- 36.Dipla K, Mattiello JA, Jeevanandam V, Houser SR & Margulies KB Myocyte recovery after mechanical circulatory support in humans with end-stage heart failure. Circulation 97, 2316–2322 (1998). [DOI] [PubMed] [Google Scholar]
- 37.Simithy J et al. Characterization of histone acylations links chromatin modifications with metabolism. Nature Communications 8, 1141 (2017). [DOI] [PMC free article] [PubMed] [Google Scholar]
- 38.Cox J & Mann M MaxQuant enables high peptide identification rates, individualized p.p.b.-range mass accuracies and proteome-wide protein quantification. Nat. Biotechnol 26, 1367–1372 (2008). [DOI] [PubMed] [Google Scholar]
- 39.Elias JE & Gygi SP Target-decoy search strategy for increased confidence in large-scale protein identifications by mass spectrometry. Nat. Methods 4, 207–214 (2007). [DOI] [PubMed] [Google Scholar]
- 40.Vizcaíno JA et al. 2016 update of the PRIDE database and related tools. Nucleic Acids Res 44, 447–456 (2016). [Google Scholar]
Associated Data
This section collects any data citations, data availability statements, or supplementary materials included in this article.