

Abstract
While much is known about the demand for cigarettes, research on the demand for non- cigarette tobacco products and the cross-price impacts among those products is limited. This study aims to comprehensively examine the own- and cross-price elasticities of demand for tobacco and nicotine replacement products (NRPs) in the U.S. We analyzed market-level quarterly data on sales and prices of 15 different types of tobacco products and NRPs from 2007 to 2014, compiled from retail store scanner data. Fixed effects models with controls were used to estimate their own-price elasticities and cross-price elasticities between cigarettes and the other 14 products. Our results show that, except for cigars, the demand for combustible tobacco products was generally elastic, with the estimated own-price elasticity greater than 1(10% increase in prices reduces sales by more than 10%). The own-price elasticities for smokeless tobacco products were smaller than those for combustible tobacco, although not always significant. The demand for electronic cigarettes and NRPs was found to be elastic. The cross-price elasticities with respect to cigarettes were positive for cigarillos, little cigars, loose tobacco, pipe tobacco, electronic cigarettes and NRPs, but only results for little cigars, loose tobacco, pipe tobacco, and dissolvable lozenges were consistently significant. Our findings suggest demand for tobacco products and NRPs was responsive to changes in their own prices. Substitutions or positive cross-price impacts between cigarettes and certain other products exist. It is important that tobacco control policies take into account both own- and cross-price impacts among tobacco products and NRTs.
Keywords: price elasticity, nicotine product, combustible tobacco, smokeless tobacco, electronic cigarettes, e-cigarettes, nicotine replacement therapy, NRT, cigarette price, retail scanner data
1. Introduction
Cigarettes have been the most-used tobacco product in the U.S. since the early 20th century.(Brandt, 2007) They currently account for more than 80% of tobacco industry’s revenue.(Hoovers a D&B Company, 2014) Hundreds of studies have been conducted over the past few decades to examine the determinants of demand for cigarettes. Those studies consistently found that a 10% price increase reduces overall cigarette use among adults by 2.5% to 5% (4% on average) in high-income countries.(International Agency for Research on Cancer, 2011; National Cancer Institute and World Health Organization, 2017)
While the empirical evidence on cigarette demand has grown larger and more sophisticated over time, the number of studies that examined the price elasticity of demand for non-cigarette tobacco and nicotine replacement products (NRPs) has been limited. Non-cigarette tobacco products and NRPs include, but are not limited to, non- cigarette combustible tobacco products (cigars, cigarillos, little cigars, roll-your-own (RYO), loose leaf tobacco, and pipe tobacco), smokeless tobacco products (chewing tobacco, moist snuff, dry snuff, and snus), electronic cigarettes (or e-cigarettes), as well as U.S. Food and Drug Administration (FDA) approved over-the-counter nicotine replacement therapy (NRT) (patches, gums and dissolvable lozenges). Price elasticity measures how sensitive the demand for a product responds to a change in price. It is defined as the percentage change in quantity demanded in response to a one percent (or a ten percent) change in its own price (own-price elasticity) or in prices of other related products (cross-price elasticity). To date, the empirical evidence on the impact of price on demand for these products is limited, and the estimated price elasticities vary considerably from study to study. For example, while some studies found that the demand for smokeless tobacco may be as responsive to price as cigarettes,(Chaloupka et al., 1997; Da Pra and Arnade, 2009; Dave and Saffer, 2013; Nguyen et al., 2012; Oshfeldt and Boyle, 1994; Zheng et al., 2017, 2016) other studies indicated that their price elasticities were smaller than that of cigarettes.(Bask and Melkersson, 2003; Ciccarelli and Fraja, 2014; Cotti et al., 2016; Kostova and Dave, 2015; Ohsfeldt et al., 1998, 1997; Tauras et al., 2007) For cigars and little cigars, several studies found very different price elasticity estimates, ranging from −0.05 to −3.17. (Da Pra and Arnade, 2009; Zheng et al., 2017, 2016; Ciccarelli and Fraja, 2014; Gammon et al., 2015; Ringel et al., 2005; Escario and Molina, 2004; Lee et al., 2005; Pekurinen, 1989) Similar mixed results were found for RYO tobacco and loose leaf tobacco as well, with estimates ranging from −0.04 to −0.91.(Cornelsen and Normand, 2014; Da Pra and Arnade, 2009; Mindell and Whynes, 2000; Tait et al., 2015; White and Ross, 2015) Studies that examined the price elasticity of e-cigarettes found that the demand of e-cigarettes, particularly disposable e-cigarettes, was generally price sensitive, with estimated price elasticity in the range of −0.78 to −2.1.(Huang et al., 2014; Pesko et al., 2017; Stoklosa et al., 2016; Zheng et al., 2017, 2016) Studies on NRT products are scare, with one study found that NRT products were largely price sensitive.(Tauras and Chaloupka, 2003)
In addition, little is known about the cross-price impacts between cigarettes and non- cigarette tobacco products and NRPs, and whether an increase in cigarette price would reduce or increase the demand for these products. The empirical evidence to-date is mixed. While some studies found that non-cigarette combustible tobacco products might be substitutes for cigarettes,(Da Pra and Arnade, 2009; Gammon et al., 2015; Hanewinkel et al., 2008; Nguyen et al., 2012) other studies found either no cross-price impacts or complementarity with cigarettes.(Zheng et al., 2017, 2016) For smokeless tobacco, a number of studies found that they were substitutes for cigarettes,(Cotti et al., 2016; Ohsfeldt et al., 1998, 1997; Oshfeldt and Boyle, 1994) however, other studies found that they were complements with cigarettes.(Bask and Melkersson, 2003; Da Pra and Arnade, 2009; Dave and Saffer, 2013; Nguyen et al., 2012; Tauras et al., 2007; Zheng et al., 2017, 2016) For e-cigarettes, some studies found that they may be substitutes for cigarettes,(Grace et al., 2014; Stoklosa et al., 2016; Zheng et al., 2017) but other studies did not find any evidence of either substitutability or complementarity between the two.(Huang et al., 2014; Pesko et al., 2017; Zheng et al., 2016) There is very limited evidence indicating that higher cigarette prices may increase demand for NRT products.(Tauras and Chaloupka, 2003)
A better understanding of the price impact on the demand for non-cigarette tobacco products and NRPs is of great public health importance. While cigarette smoking prevalence in the U.S. has halved since the publication of the 1964 landmark Surgeon General report, nearly half a million adults still die prematurely annually because of cigarette smoking.(U.S. Department of Health & Human Services, 2014) In addition, some disturbing trends in use of non-cigarette tobacco products have occurred in recent years. Consumption of non-cigarette combustible tobacco products and sales of moist snuff increased in the early 2000s.(Centers for Disease Control and Prevention (CDC), 2012; Delnevo et al., 2014) Use of e-cigarettes among youth has increasedconsiderably in the past few years.(Jamal et al., 2017) Given the scientific evidence that demonstrates health risks associated with non-cigarette combustible tobacco products (Baker et al., 2000) and smokeless tobacco products,(Cullen et al., 1986; United States Bureau of Maternal and Child Health and Resources Development Office of Maternal and Child Health, 1986) as well as the adverse health consequences of nicotine exposure during periods of developmental vulnerability,(England et al., 2015) these upward trends in use of non-cigarette tobacco products warrant heightened attention.
Moreover, a better understanding of cross-price impacts between cigarettes and non- cigarette tobacco and NRPs has important policy implications. Tobacco control policies that aim to reduce cigarette smoking may have different, even opposite, impacts on non-cigarette tobacco products, depending on the degree of substitutability or complementarity between these products. To the extent that non-cigarette tobacco products may be substitutes for cigarettes, policies that target only cigarette smoking may increase use of non-cigarette tobacco products. However, if these products were complements for cigarettes, policies that reduce cigarette smoking may also reduce use of non-cigarette tobacco products at the same time. An accurate prediction of the potential impact of tobacco control policies requires an accurate understanding of the degree of substitutability or complementarity between cigarettes and non-cigarette tobacco and NRPs.
2. Methods
2.1 Data
This study utilized quarterly sales and price data of tobacco products and NRPs compiled from Nielsen (The Nielsen Company (US), LLC) retail store scanner database in 52 Nielsen-defined US markets for food, drug and mass merchandise stores (FDM) from 2007 to 2014, and in 30 US markets for convenience stores from 2010 to 2014. A Nielsen market consists of groups of counties centered on a major city. Those 52 Nielsen markets cover 44 states and the District of Columbia in the continental U.S. The Nielsen store scanner data contain detailed information on product retail prices and sales and are gathered directly from Nielsen’s participating retailers. These data allowed us to identify product types, as well as dollar sales amount and sales volume of a given type of tobacco product or NRP in a Nielsen market.
Fifteen nicotine products were examined in this study, including combustible tobacco (cigarettes, cigars, cigarillos, little cigars, RYO loose tobacco, and pipe tobacco), smokeless tobacco (chewing tobacco, moist snuff, dry snuff and snus), e-cigarettes (reusable, disposable), and other nicotine products (FDA approved over-the-counter NRT products, which include nicotine patch, gum, and dissolvable lozenges). Product classification was based on universal product codes and descriptions, as well as extensive checks and verifications through online searches.
2.2 Measures
Per capita product sales volume
For each market and quarter, separately for FDM and convenience stores, Nielsen provided sales units for all 15 types of products sold by its participating retailers. The sales volume for a specific product type in a given market/quarter/store type was calculated by multiplying the total sales units sold for each product type in that market/quarter/store type with the amount of product pieces contained in one single sales unit (e.g., one single cigarette pack is a unit containing 20 cigarettes). Sales volume was measured in pieces for cigarettes, cigars, cigarillos, little cigars, e-cigarettes, and NRT products. For pipe tobacco, RYO loose tobacco, moist snuff, dry snuff, and snus, the sales volume was measured in ounces, based on the weight information provided on the product package. Not all products were sold in all markets or during all time periods; as a result, analyses by each product type differ with regard to the number of available data points.
The dependent variable in our analysis—per capita sales volume—was constructed by dividing the total sales volume in a market/quarter/store type by the total population in that market/quarter. We used Census Bureau county-level population data (2007 – 2014) to determine the total population within a Nielsen market.
Inflation-adjusted product prices
The average price per volume unit in a given market/quarter/store type was calculated by dividing total dollar sales by sales volume in that market/quarter/store type. The product price variables used in our analyses was adjusted for inflation using the Consumer Price Index (indexed to 1 for the last quarter of 2014) obtained from the Bureau of Labor Statistics.
To account for the potential influence of other tobacco control policies on tobacco demand across markets, we controlled for, in our analysis, the inflation-adjusted per capita tobacco control program funding, obtained from CDC’s STATE system, and smoke-free policy coverage measure, constructed using data from the American Nonsmokers’ Rights Foundation U.S. Tobacco Control Laws Database, which take into account both state and local smoke-free policies.(Americans for Nonsmokers’ Rights, 2016)
2.3 Empirical models
Market-store and year/quarter fixed-effects models were used to estimate the own-price elasticity of demand separately for all fifteen nicotine products. The baseline fixed effects models were specified as follows:
The dependent variable in equation 1 is the natural log of per capita product sales volume in a given market/quarter/store type. The log transformation was used because of the skewed distribution of sales. In addition, the log transformation of both sales and prices enable us to conveniently obtain the estimates of price elasticies directly from β1. The key independent variable is the inflation-adjusted product price, also in log form. Year is a vector of dichotomous variables that captures time-varying influences on product sales common to all markets. Quarter is a vector of three dichotomous variables that captures seasonality in product sales. Market-store variables are dichotomous variables for each market and store type that capture the influence of market-store-level characteristics that are constant over time within a given market and store type but that vary across markets and across markets/store types. This model tests how sales of a specific type of tobacco product in a given market and a store type respond to the changes in prices of this product within the same market/store type over time. Because of the potential product substitution within the same market across different retail channels and the potential product substitution across markets, the price elasticities estimated using this model will be larger, in absolute term, than those estimated using aggregated sales data at the national level.
To estimate cross-price elasticity between cigarettes and non-cigarette products, the following model was used:
Equation 2.
Cross-price elasticity between cigarettes and other tobacco products and NRPs:
The estimated β2 from equation 2 reflects cross-price elasticity of demand, which would reveal how changes in cigarette prices influence the sales of non-cigarette tobacco product or NRP being examined. An alternative cross-price elasticity model was also analyzed in which a price index reflecting the sales-weighted average price for all combustible tobacco products replaced the cigarette prices in Equation 2. Since cigarettes dominate the combustible tobacco markets, the combustible tobacco product price index was very similar to cigarette prices; thus, the results from this alternative method were essentially the same as those using cigarette prices. As a result, those results are not presented. All models include comprehensive smoke-free policy coverage measure and per capita tobacco control funding measure.
To examine whether price elasticities differ by store types, we conducted analyses separately for FDM and convenience stores. In those analyses, market-store fixed effects in equations 1 and 2 were replaced by market fixed effects.
In addition to market level analysis, to account for the potential impact of product substitution within the same market across different retail channels, particularly those channels that were not captured in Nielsen data (such as vape shops, tobacco shops, online sales, as well as other non-tracked retail channels); product substitution across markets; and the potential impact of tax avoidance behaviors that involve cross market purchase, purchase occurred in tribal lands, and online purchases, we also aggregated market level sales to the national level and examined the own-price elasticities for each tobacco product at the national level. The disadvantage of conducting aggregated national level analysis is that the number of available data points is significantly reduced; thus, statistical power is usually low and the estimates may vary considerably due to small sample sizes and potential multicollinearity. Because not all products were available in all time periods and store types, which further reduces the available data points for analyzing cross-price impacts, we did not conduct aggregated national level analyses for cross-price elasticities between cigarettes and non-cigarette nicotine products.
3. Results
Descriptive statistics for key variables used in this analysis are presented in Table 1. Sales varied considerable across different nicotine products. Per capita sales was the highest for cigarettes and the lowest for e-cigarettes among all products measured by volume. Moist snuff had the highest per capita sales among products measured in ounces. Large differences in price also exist across different product types. Table 1 also presented price information for each product. E-cigarettes had the highest variability in prices because they encompass a wide variety of devices and types. Figure 1 shows the total dollar sales of 15 nicotine products by store type in all Nielsen markets in 2014.
Table 1.
Descriptive Statistics: E-Cigarettes Reusable (2010–2014), E-Cigarettes Disposable (2009–2014), All Other Products (2007–2014)
| Market-level Quarterly Per Capita Sales Volume | Mean | SD | Min | Max |
|---|---|---|---|---|
| Cigarettes (pieces) | 50.718 | 63.394 | 2.725 | 368 |
| Cigars (pieces) | 0.247 | 0.374 | 0.000 | 2.283 |
| Cigarillos (pieces) | 0.256 | 0.449 | 0.000 | 2.781 |
| Little Cigars (pieces) | 0.430 | 0.558 | 0.000 | 3.856 |
| Roll-your-own Loose Tobacco (ounces) | 0.008 | 0.012 | 0.000 | 0.112 |
| Pipe Tobacco (ounces) | 0.007 | 0.014 | 0.000 | 0.121 |
| Moist Snuff (ounces) | 0.199 | 0.358 | 0.000 | 3.020 |
| Dry Snuff (ounces) | 0.012 | 0.027 | 0.000 | 0.158 |
| Chewing tobacco (ounces) | 0.063 | 0.123 | 0.000 | 0.951 |
| Snus (ounces) | 0.052 | 0.087 | 0.000 | 0.646 |
| E-Cigarettes Reusable (pieces) | 0.001 | 0.002 | 0.000 | 0.030 |
| E-Cigarettes Disposable (pieces) | 0.006 | 0.010 | 0.000 | 0.066 |
| NRT Gum (pieces) | 0.183 | 0.247 | 0.000 | 0.952 |
| NRT Patch (pieces) | 0.010 | 0.013 | 0.000 | 0.062 |
| Dissolvable Lozenge (pieces) | 0.064 | 0.080 | 0.000 | 0.354 |
|
| ||||
|
Prices (inflation adjusted) ($ per piece/ounce)
| ||||
| Cigarettes ($ per piece) | 0.267 | 0.064 | 0.136 | 0.493 |
| Cigars ($ per piece) | 1.009 | 0.247 | 0.438 | 3.510 |
| Cigarillos ($ per piece) | 0.833 | 0.206 | 0.367 | 1.537 |
| Little Cigars ($ per piece) | 0.154 | 0.082 | 0.053 | 0.502 |
| Roll-your-own Loose Tobacco ($ per ounce) | 5.403 | 2.050 | 1.414 | 10.601 |
| Pipe Tobacco ($ per ounce) | 2.434 | 0.936 | 0.187 | 10.143 |
| Moist Snuff ($ per ounce) | 3.156 | 0.897 | 1.714 | 6.005 |
| Dry Snuff ($ per ounce) | 3.796 | 0.968 | 0.331 | 7.135 |
| Chewing tobacco ($ per ounce) | 1.780 | 0.594 | 0.338 | 3.895 |
| Snus ($ per ounce) | 4.549 | 1.433 | 2.339 | 23.049 |
| E-Cigarettes Reusable ($ per piece) | 25.041 | 10.758 | 9.123 | 84.237 |
| E-Cigarettes Disposable ($ per piece) | 9.440 | 2.288 | 2.836 | 29.075 |
| NRT Gum ($ per piece) | 0.436 | 0.167 | 0.162 | 3.265 |
| NRT Patch ($ per piece) | 3.059 | 0.448 | 1.858 | 4.596 |
| Dissolvable Lozenge ($ per piece) | 0.512 | 0.071 | 0.227 | 0.735 |
|
| ||||
|
Additional Control Variables
| ||||
| Smoke-free policy coverage | 0.587 | 0.338 | 0.000 | 1.000 |
| Cigarette tax (in cents) | 131.9 | 88.2 | 18.1 | 435.0 |
| Store dummy (1=FDM; 0=CV) | 0.735 | 0.441 | 0.000 | 1.000 |
Note: FDM - food, drug, and mass merchandise stores. CV - convenience stores.
Figure 1.
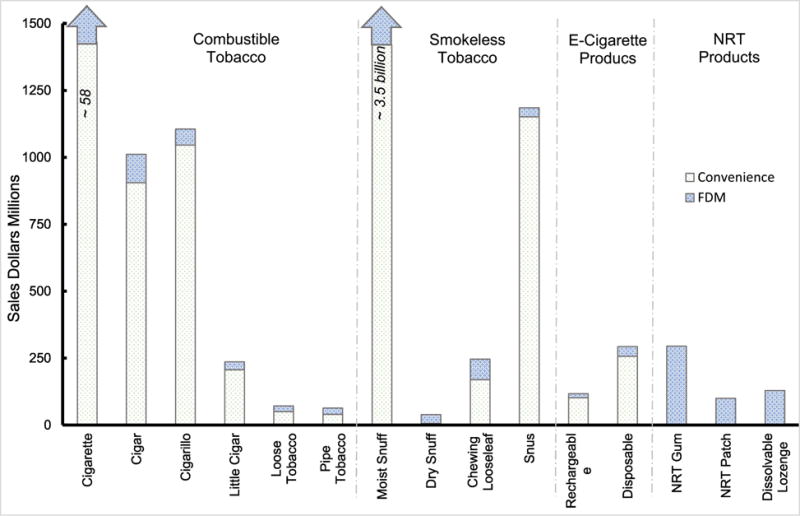
Dollar Sales of Tobacco and Nicotine Replacement Products in 2014 in the U.S. by Store Type
As Figure 1 demonstrates, there were significant differences in sales between FDM and convenience stores for all nicotine products. The sales for cigarettes was the largest, with approximately $60 billion in dollar sales, 86% of which came from convenience stores. Sales for moist snuff was second, close to $4 billion, of which 96% occurred in convenience stores. Sales for cigars and cigarillos were the third and fourth largest, with $1.2 billion and $0.85 billion in sales, respectively. With the exception of NRT products, the vast majority of sales of nicotine products occurred in convenience stores. Sales for NRT gum, patches and dissolvable lozenges almost exclusively occurred in FDM stores. As thus, we did not conduct analyses for NRT products in convenience stores.
Own-price elasticities
Table 2 presents the main results based on the own-price elasticity analysis (Equation 1). The estimated own-price elasticities of combustible tobacco products were all statistically significant in the models with market-store fixed effects. The estimated own- price elasticity at market-store level was −1.477 for cigarettes (p-value < 0.0001), indicating that a 10% increase in cigarette price would result in an approximately 15% decrease in per capita cigarette sales. The estimated price elasticity for cigarettes based on market-store level data was larger than that from aggregated national level analysis (−0.207). Among the remaining combustible products, the demand at the market/store level for pipe tobacco was the most elastic (−2.570), followed by little cigars (−1.665), RYO loose tobacco (−1.417), cigarillos (−1.331), and cigars (−0.722) (p-values < 0.0001 for all products). The estimated price elasticities differ by store types, partly reflecting the differences in sales between FDM and convenience stores, but also reflecting fewer available data points for convenience stores (few years and fewer markets). Price elasticities at the aggregated national level tended to be smaller than those at the market level, and not all were statistically significant, which was partly due to smaller sample sizes and potential multicollinearity.
Table 2.
Estimated Own Price Elasticities of Tobacco Products and Nicotine Replacement Products
| Set | Model | Cigarette | N | Cigars | N | Cigarillos | N | Little Cigars | N | RYO Loose Tobacco | N |
|---|---|---|---|---|---|---|---|---|---|---|---|
| Market Level | (1)FDM CV | 1.477*** [−1.797, −1.157] | 2264 | 0.722*** [−1.039, −0.405] | 2224 | 1.331*** [−1.584, −1.077] | 2224 | 1.665*** [−1.937, −1.393] | 2223 | −1.417*** [−1.726, −1.108] | 2222 |
| (1)FDM | −1.531*** [−1.876, −1.187] | 1664 | −0.844*** [−1.202, −0.485] | 1664 | −1.242*** [−1.522, −0.963] | 1664 | −1.737*** [−2.037, −1.436] | 1663 | −1.425*** [−1.746, −1.103] | 1662 | |
| (1)CV | 0.857*** [−1.175, −0.54] | 600 | −0.587 [−1.319,0.146] | 560 | 1.497*** [−2.065, −0.928] | 560 | 1.287*** [−1.789, −0.785] | 560 | −1.507* [−3.062,0.0475] | 560 | |
|
| |||||||||||
| US Total | (2)FDM CV | −0.207 [−0.467,0.0526] | 52 | −0.292 [−0.721,0.137] | 52 | 1.300*** [−1.563, −1.037] | 52 | 0.676*** [−1.048, −0.304] | 52 | −0.923*** [−1.012, −0.835] | 52 |
| (2)FDM | −0.0904 [−0.392,0.211] | 32 | −0.281 [−0.774,0.212] | 32 | −0.287 [−0.895,0.322] | 32 | 0.389*** [−0.673, −0.106] | 32 | −0.905*** [−0.978, −0.832] | 32 | |
| (2)CV | −0.492 [−1.567,0.584] | 20 | 1.850*** [−2.884, −0.816] | 20 | −0.0196 [−0.796,0.835] | 20 | 1.182*** [−1.446, −0.918] | 20 | −0.694 [−4.521,3.134] | 20 | |
|
| |||||||||||
| Set | Model | Pipe Tobacco | N | Moi st Snuff | N | Dry Snuff | N | Chewing Tobacco | N | Snus | N |
|
| |||||||||||
| Market Level | (1)FDM CV | 2.570*** [−3.177, −1.962] | 2200 | −0.631* [−1.346,0.0835] | 2211 | −0.860 [−2.163,0.443] | 1350 | −0.197 [−1.385,0.991] | 2200 | −1.247*** [−1.837, −0.657] | 2217 |
| (1)FDM | −2 111*** [−2.801, −1.42] | 1664 | −0.608 [−1.385,0.168] | 1651 | −0.444 [−1.479,0.592] | 1240 | −0.0693 [−1.281,1.142] | 1640 | −1.285*** [−1.929, −0.64] | 1657 | |
| (1)CV | 2.126*** [−2.903, −1.349] | 536 | 0.971*** [−1.565, −0.377] | 560 | 9.195*** [−14.08, −4.309] | 110 | 2.074*** [−3.478, −0.669] | 560 | −0.698*** [−1.068, −0.329] | 560 | |
|
| |||||||||||
| US Total | (2)FDM CV | −4.841*** [−5.547, −4.136] | 52 | −1.108*** [−1.508, −0.707] | 52 | −7.114*** [−9.518, −4.711] | 52 | −2.478*** [−4.036, −0.92] | 52 | −0.419* [−0.859,0.0209] | 52 |
| (2)FDM | 0.365* [−0.0705,0.8] | 32 | 0.553*** [−0.767, −0.34] | 32 | 0.0711 [−0.509,0.651] | 32 | −0.0810 [−0.668,0.506] | 32 | −0.464** [−0.837, −0.0915] | 32 | |
| (2)CV | 2.593*** [−3.956, −1.231] | 20 | −1.017 [−3.981,1.948] | 20 | 3.215*** [−4.163, −2.266] | 20 | −0.655 [−1.858,0.548] | 20 | −0.742 [−1.749,0.266] | 20 | |
|
| |||||||||||
| Set | Model | E-Cig Rechargeable | N | E-Cig Disposable | N | NRT Gum | N | NRT Patch | N | Dissolvable Lozenge | N |
|
| |||||||||||
| Market Level | (1)FDM CV | 1.363*** [−1.73, −0.996] | 1130 | 1.560*** [−2.393, −0.727] | 1228 | – | – | – | - | ||
| (1)FDM | −0.573*** [−0.963, −0.183] | 630 | −1.825*** [−2.824, −0.826] | 723 | −1.429*** [−1.873, −0.985] | 1664 | −1.083*** [−1.566, −0.601] | 1664 | −1.404*** [−2.12, −0.689] | 1664 | |
| (1)CV | 2.393*** [−2.985, −1.8] | 500 | −0.933 [−2.738,0.871] | 505 | – | – | – | - | |||
|
| |||||||||||
| US Total | (2)FDM CV | −1.191 [−1.315,3.696] | 36 | −6.363** [−12.37, −0.35] | 43 | – | – | – | – | ||
| (2)FDM | −6.839* [−15.33,1.647] | 16 | −4.537** [−8.271, −0.802] | 23 | −0.203 [−0.743,0.337] | 32 | −0.520 [−1.936,0.896] | 32 | 0.360 [−0.291,1.01] | 32 | |
| (2)CV | −2.698*** [−3.582, −1.813] | 20 | −5.518*** [−6.749, −4.287] | 20 | |||||||
models controlled for ma rket, year, a nd quarter fixed effects, smoke free air index, tobacco control funding, as well as store dummy in FDM CV models.
models controlled for year and quarter fixed effects, smoke free air index, tobacco control funding, as well as store dummy in FDM CV models.
*** p<0.01, ** p<0.05, * p<0.1. 95% confidence intervals in the brackets.
FDM - Food, drug, and mass merchandize stores. CV - convenience stores. NRT- Nicotine Replacement Therapy. RYO - Roll-your-own.
Almost all sales of NRT products occurred in FDM. As thus, no analyses were conducted for NRT in convenience stores.
95% confidence intervals in brackets. N represents the available data points in each analysis, which depend on the number of markets, years and quarter.
The results in Table 2 also reveal that the demand for moist snuff, the largest smokeless tobacco category, was generally less elastic than that for combustible tobacco products. In the models that used data from convenience stores where most of sales for smokeless tobacco occur, the own-price elasticity was −0.971, −9.195, and −2.074 and −0.698 for moist snuff, dry snuff, chewing tobacco, and snus, respectively (p- value < 0.0001 for all). The estimated price elasticity for e-cigarettes from models with market-store fixed effects was −1.363 for reusable e-cigarettes (p-value < 0.0001) and −1.560 for disposable e-cigarettes (p-value = 0.0004).The demand for NRT gum and patches, as well as dissolvable lozenges, was elastic, with the estimated own-price elasticity of −1.429 for NRT gum (p-value = 0.0158), −1.083 for NRT patches (p-value <0.0001), and −1.404 for dissolvable lozenges (p-value < 0.0001).
Cross-product price elasticities
The results for cross-price impacts (Equation 2) are presented in Table 3. The estimated cross-price elasticity between cigarettes and non-cigarette combustible tobacco products was positive and significant, in models with market-store fixed effects, for little cigars (p-value = 0.0229), RYO loose tobacco (p-value =0.0106), pipe tobacco (p-value = 0.0017), indicating that those products were potentially substitutes for cigarettes (i.e. when cigarette price goes up, the demand for these products would go up). The results for cigarillos were positive, but not statistically significant, and the results for cigars were mixed, with the convenience store model being positive and other models being negative.
Table 3.
Estimated Cross-Price Elasticities of Tobacco Products and Nicotine Replacement Products with respect to Cigarette Price
| Set | Model | Cigarette | N | Cigar | N | Cigarillo | N | Little Cigar | N | RYO Loose Tobacco | N |
|---|---|---|---|---|---|---|---|---|---|---|---|
| Market Level | FDM CV | −0.652** [−1.16, −0.143] | 2,208 | 0.287 [−0.279,0.852] | 2,208 | 0.861** [0.122,1.599] | 2,207 | 1.567** [0.376,2.759] | 2,206 | ||
| FDM | −0.743*** [−1.254, −0.232] | 1,648 | 0.218 [−0.408,0.843] | 1,648 | 1.056*** [0.28,1.832] | 1,647 | 1.264* [−0.024,2.553] | 1,646 | |||
| CV | 0.804** [0.0736,1.535] | 560 | 0.280 [−0.635,1.196] | 560 | −2.302 [−4.832,0.228] | 560 | 4.469*** [2.224,6.714] | 560 | |||
|
| |||||||||||
| Set | Model | Pipe Tobacco | N | Moist Snuff | N | Dry Snuff | N | Chewing Tobacco | N | Snus | N |
|
| |||||||||||
| Market Level | FDM CV | 1.749*** [0.676,2.822] | 2,184 | −0.119 [−1.063,0.826] | 2,195 | −0.545 [−1.834,0.743] | 1,334 | −0.566 [−1.413,0.281] | 2,184 | −0.114 [−0.968,0.740] | 2,201 |
| FDM | 1.296*** [0.472,2.121] | 1,648 | −0.0878 [−1.143,0.968] | 1,635 | −0.834 [−1.938,0.270] | 1,224 | −0.487 [−1.387,0.413] | 1,624 | −0.107 [−1.047,0.833] | 1,641 | |
| CV | 4.069* [−0.778,8.916] | 536 | −0.0434 [−1.035,0.948] | 560 | −6.795** [−12.28, −1.314] | 110 | −0.699 [−2.782,1.385] | 560 | −0.108 [−1.446,1.229] | 560 | |
|
| |||||||||||
| Set | Model | E-Cig Reusable | N | E-Cig Disposable | N | NRT Gum | N | NRT Patch | N | Dissolvable Lozenge | N |
|
| |||||||||||
| Market Level | FDM CV | 1.983 [−2.238,6.205] | 1,130 | 0.149 [−2.199,2.497] | 1,228 | ||||||
| FDM | 1.297 [−3.818,6.412] | 630 | −1.947 [−5.081,1.187] | 723 | 0.267 [−0.242,0.777] | 1,648 | 0.399 [−0.114,0.913] | 1,648 | 0.648** [0.0062,1.289] | 1,648 | |
| CV | 2.583 [−4.309,9.475] | 500 | 3.145** [0.275,6.014] | 505 | |||||||
All models controlled for market, year, and quarter fixed effects, smoke free air index, tobacco control funding, as well as store dummy in FDM CV models.
*** p<0.01, ** p<0.05, * p<0.1. 95% confidence intervals in the brackets.
FDM - Food, drug, and mass merchandize stores. CV - convenience stores. NRT- Nicotine Replacement Therapy. RYO - Roll-your-own.
Almost all sales of NRT products occurred in FDM. As thus, no analyses were conducted for NRT in convenience stores.
95% confidence intervals in brackets. N represents the available data points in each analysis, which depend on the number of markets, years, and quarters.
While the cross-price impacts between cigarettes and smokeless tobacco products (moist snuff, dry snuff, chewing, and snus) were all negative, indicating potential complementarity between the two products, none of these results were statistically significant. The estimated cross-price elasticities between cigarettes and e-cigarettes are generally positive in the market/store fixed effects models. However, the results were not significant (except for disposable e-cigarettes sold in convenience stores). The estimated cross-price elasticity between cigarettes and NRT products were positive for NRT gum, NRT patches, and dissolvable lozenges, indicating the existence of substitutability between cigarettes and NRT products. However, only results for dissolvable lozenges were statistically significant (p-value = 0.0479).
4. Discussion
This study comprehensively examines the own- and cross-price impacts of different types of tobacco products and NRPs in the U.S. using Nielsen retail store scanner data between 2007 and 2014. We found that the demand for combustible tobacco products was generally highly responsive to their own price changes. Except for cigars, the demand for other combustible tobacco products were elastic (own-price elasticity greater than unit), i.e., a 10% increase in prices would reduce the quantity demanded by more than 10%. Specifically, the estimated own-price elasticities, based on market-store level analyses, were −1.48 for cigarettes, −0.72 for cigars, −1.33 for cigarillos, −1.67 for little cigar, −1.42 for RYO loose tobacco, and −2.57 for pipe tobacco.
Compared to the cigarette price elasticities found in the previous literature, which cluster around −0.2 to −0.6,(International Agency for Research on Cancer, 2011; National Cancer Institute and World Health Organization, 2017) our price elasticity estimates for cigarettes at the market-store level were larger, which was due, in part, to impact of product substitution within the same market across different retail channels, product substitution across markets, and potential tax avoidance behaviors, which tend to make the demand for cigarettes within a market/store type more elastic. When we conducted analyses using aggregated national level sales data, we found that the own-price elasticity for cigarettes was between −0.1 to −0.5, in line with the estimates from the previous studies.
Our own-price elasticity estimates for cigars was similar to those found in several previous studies, which suggested that demand for cigars are less elastic.(Ciccarelli and Fraja, 2014; Escario and Molina, 2004; Lee et al., 2005; Ringel et al., 2005) In contrast, we found that demand for little cigars and cigarillos are more elastic, and sensitive to price changes, which is consistent with the findings from two previous studies.(Gammon et al., 2015; Zheng et al., 2017)
For smokeless tobacco, we found that the estimated own-price elasticity for moist snuff and snus was smaller than those for combustible tobacco products, but the own-price elasticity for dry snuff and chewing tobacco was larger than those for combustible tobacco products, indicating a heterogeneity in price responsiveness within smokeless tobacco products. This may explain the mixed results regarding the magnitudes of price elasticity for smokeless tobacco from previous studies, which tend to lump various smokeless tobacco products into one broad category.
Regarding e-cigarettes, our findings indicated that the demand of these products were generally elastic at the market-store level. A 10% increase in prices would reduce the quantity demanded by approximately 14% for reusable and 16% for disposable e- cigarettes, respectively. These findings are consistent with the estimates from recent studies.(Huang et al., 2014; Pesko et al., 2017; Stoklosa et al., 2016; Zheng et al., 2017, 2016)
Our results also indicate that demand for NRT products were very sensitive to price changes. A 10% increase in prices of NRT products would reduce demands for patches, gum, and dissolvable lozenges by roughly 14%, 11%, and 14% respectively. Given the demand of NRT products is elastic, policies that incorporate strategies to reduce cost barriers could promote the use of these FDA approved NRT products to help smokers quit.
Our study also reveals that there are cross product price effects between cigarettes and certain other tobacco products and NRPs. Specifically, we found an increase in cigarette prices would increase the demand for little cigars, loose tobacco, pipe tobacco, and dissolvable lozenges, indicating these products are potential substitutes for cigarettes.
Our study has several limitations. First, our data only captured nicotine product sales in Nielsen participating retailers, and did not capture nicotine products sold online, in specialty stores (such as vape shops), or in other retail channels not tracked by Nielsen. In addition, our analyses also did not account for illegal sales, such as contraband, smuggled, or bootlegged tobacco products. Consequently, our price elasticity estimates reflect only a subset of total tobacco products and NRPs sold in the U.S. Second, our study period ended in 2014, a time when use of e-cigarettes was still increasing. As such, our results may not capture the more recent dynamics between e-cigarettes and other tobacco and nicotine products occurred in the market. Finally, because our data were at the market store level, we were unable to estimate price elasticity separately for important subpopulations, such as youth, young adults, racial/ethnic minorities, those with low incomes, and/or mental or behavioral health constrains. More research is warranted to better understand how prices affect the use of these products among subpopulations.
5. Conclusions
Our study demonstrates that policies that alter retail prices of nicotine products may lead to changes in use of these products. Increasing unit price on combustible tobacco products, therefore, could lead to reduction in use of combustible tobacco products. In addition, given the positive cross-price impacts between cigarettes and certain other combustible tobacco products, such as little cigars, RYO loose and pipe tobacco, policies that aim to reduce cigarette smoking could take into account the potential impact of higher cigarette prices on use of these combustible tobacco products.
Our results also suggest that reducing the prices that smokers pay for NRT products could lead to significant increase in use of these products, and that increasing the price of cigarettes may have added benefits of increasing the demand for NRT products. Consequently, reducing prices of NRT products could also be an important policy tool to encourage quitting and to promote the use of FDA approved cessation products.
Highlights.
Price is a key determinant of demand for tobacco and nicotine products
Except for cigar, demand for combustible tobacco products are highly price sensitive
Demand for E-cigarettes and NRT products are highly sensitive to price changes
Certain combustible tobacco products are substitutes for cigarettes
Acknowledgments
The authors would like to thank Megan Diaz and Maryam Mirza of the University of Illinois at Chicago for their excellent research assistance.
Funding
This research was supported by a grant from the National Institutes of Health, National Cancer Institute (Grant #: 1U01CA154248). The NIH and NCI had no role in study design; collection, analysis, and interpretation of data; writing the report; or the decision to submit the report for publication.
Footnotes
Publisher's Disclaimer: This is a PDF file of an unedited manuscript that has been accepted for publication. As a service to our customers we are providing this early version of the manuscript. The manuscript will undergo copyediting, typesetting, and review of the resulting proof before it is published in its final citable form. Please note that during the production process errors may be discovered which could affect the content, and all legal disclaimers that apply to the journal pertain.
Disclaimer
The findings and conclusions in this report are those of the authors and do not necessarily represent the official position of NIH, NCI, and the Centers for Disease Control and Prevention.
Declaration of Interests
The authors have no financial disclosures or conflicts of interest to report.
References
- Americans for Nonsmokers’ Rights. Smokefree Lists, Maps, and Data [WWW Document] 2016 URL http://www.no-smoke.org/goingsmokefree.php?id=519#ords (accessed 9.19.16)
- Baker F, Ainsworth SR, Dye JT, Crammer C, Thun MJ, Hoffman D, Repace JL, Henningfield JE, Slade J, Pinney J, Shanks T, Burns DM, Connolly GN, Shopland DR. Health risks associated with cigar smoking. JAMA. 2000;284:735–40. doi: 10.1001/jama.284.6.735. [DOI] [PubMed] [Google Scholar]
- Bask M, Melkersson M. Should one use smokeless tobacco in smoking cessation programs? HEPAC. 2003;4:263–270. doi: 10.1007/s10198-003-0197-y. [DOI] [PubMed] [Google Scholar]
- Brandt AM. The cigarette century: The rise, fall, and deadly persistence of the product that defined America. Basic Books; New York: 2007. [Google Scholar]
- Centers for Disease Control and Prevention (CDC) Consumption of cigarettes and combustible tobacco–United States, 2000–2011. MMWR Morb Mortal Wkly Rep. 2012;61:565–569. [PubMed] [Google Scholar]
- Chaloupka FJ, Tauras JA, Grossman M. Public Policy and Youth Smokeless Tobacco Use. Southern Economic Journal. 1997;64:503–516. doi: 10.2307/1060863. [DOI] [Google Scholar]
- Ciccarelli C, Fraja GD. The demand for tobacco in post-unification Italy. Cliometrica. 2014;8:145–171. doi: 10.1007/s11698-013-0097-z. [DOI] [Google Scholar]
- Cornelsen L, Normand C. Is roll-your-own tobacco substitute for manufactured cigarettes: evidence from Ireland? J Public Health (Oxf) 2014;36:65–71. doi: 10.1093/pubmed/fdt030. [DOI] [PubMed] [Google Scholar]
- Cotti C, Nesson E, Tefft N. The Effects of Tobacco Control Policies on Tobacco Products, Tar, and Nicotine Purchases among Adults: Evidence from Household Panel Data. American Economic Journal: Economic Policy. 2016;8:103–123. doi: 10.1257/pol.20150268. [DOI] [Google Scholar]
- Cullen JW, Blot W, Henningfield J, Boyd G, Mecklenburg R, Massey MM. Health consequences of using smokeless tobacco: summary of the Advisory Committee’s report to the Surgeon General. Public Health Rep. 1986;101:355–373. [PMC free article] [PubMed] [Google Scholar]
- Da Pra M, Arnade C. Tobacco product demand, cigarette taxes, and market substitution. Presented at the Agricultural and Applied Economics Association 2009 Annual Meeting; Milwaukee, Wisconsin. 2009. p. 22. [Google Scholar]
- Dave D, Saffer H. Demand for smokeless tobacco: Role of advertising. Journal of Health Economics. 2013;32:682–697. doi: 10.1016/j.jhealeco.2013.03.007. [DOI] [PMC free article] [PubMed] [Google Scholar]
- Delnevo CD, Wackowski OA, Giovenco DP, Manderski MTB, Hrywna M, Ling PM. Examining market trends in the United States smokeless tobacco use: 2005–2011. Tob Control. 2014;23:107–112. doi: 10.1136/tobaccocontrol-2012-050739. [DOI] [PMC free article] [PubMed] [Google Scholar]
- England LJ, Bunnell RE, Pechacek TF, Tong VT, McAfee TA. Nicotine and the developing human: A neglected element in the electronic cigarette debate. Am J Prev Med. 2015;49:286–93. doi: 10.1016/j.amepre.2015.01.015. [DOI] [PMC free article] [PubMed] [Google Scholar]
- Escario JJ, Molina JA. Modeling the optimal fiscal policy on tobacco consumption. Journal of Policy Modeling. 2004;26:81–93. doi: 10.1016/j.jpolmod.2003.11.003. [DOI] [Google Scholar]
- Gammon DG, Loomis BR, Dench DL, King BA, Fulmer EB, Rogers T. Effect of price changes in little cigars and cigarettes on little cigar sales: USA, Q4 2011-Q4 2013. Tob Control. 2015 doi: 10.1136/tobaccocontrol-2015-052343. [DOI] [PMC free article] [PubMed]
- Grace RC, Kivell BM, Laugesen M. Predicting decreases in smoking with a cigarette purchase task: evidence from an excise tax rise in New Zealand. Tob Control. 2014 doi: 10.1136/tobaccocontrol-2014-051594. [DOI] [PubMed]
- Hanewinkel R, Radden C, Rosenkranz T. Price increase causes fewer sales of factory-made cigarettes and higher sales of cheaper loose tobacco in Germany. Health Economics. 2008;17:683–693. doi: 10.1002/hec.1282. [DOI] [PubMed] [Google Scholar]
- Hoovers a D&B Company. Tobacco product manufacturing - Industry facts and trends. Hoover’s. A D&B Company; Austin, TX: 2014. [Google Scholar]
- Huang J, Tauras JA, Chaloupka F. The impact of prices and tobacco control policies on the demand for electronic nicotine delivery systems. Tobacco Control. 2014;24:iii41–iii47. doi: 10.1136/tobaccocontrol-2014-051515. [DOI] [PMC free article] [PubMed] [Google Scholar]
- International Agency for Research on Cancer. IARC Handbooks of Cancer Prevention, Tobacco Control. Vol. 14. Effectiveness of Tax and Price Policies for Tobacco Control, Effectiveness of Tax and Price Policies for Tobacco Control; Lyon, France: 2011. [Google Scholar]
- Jamal A, Gentzke A, Hu SS, Cullen KA, Apelberg BJ, Homa DM, King BA. Tobacco Use Among Middle and High School Students - United States, 2011–2016. MMWR Morb Mortal Wkly Rep. 2017;66:597–603. doi: 10.15585/mmwr.mm6623a1. https://doi.org/10.15585/mmwr.mm6623a1. [DOI] [PMC free article] [PubMed] [Google Scholar]
- Kostova D, Dave D. Smokeless tobacco use in India: Role of prices and advertising. Soc Sci Med. 2015;138:82–90. doi: 10.1016/j.socscimed.2015.05.036. [DOI] [PubMed] [Google Scholar]
- Lee JM, Liao DS, Ye CY, Liao WZ. Effect of cigarette tax increase on cigarette consumption in Taiwan. Tobacco Control. 2005;14:i71–i75. doi: 10.1136/tc.2004.008177. [DOI] [PMC free article] [PubMed] [Google Scholar]
- Mindell JS, Whynes DK. Cigarette consumption in The Netherlands 1970–1995Does tax policy encourage the use of hand-rolling tobacco? Eur J Public Health. 2000;10:214–219. doi: 10.1093/eurpub/10.3.214. [DOI] [Google Scholar]
- National Cancer Institute, World Health Organization. Monograph 21: The Economics of Tobacco and Tobacco Control - National Cancer Institute - Cancer Control and Population Sciences [WWW Document] 2017 URL https://cancercontrol.cancer.gov/brp/tcrb/monographs/21/ (accessed 2.1.18)
- Nguyen L, Rosenqvist G, Pekurinen M. Demand for tobacco in Europe - An econometric analysis of 11 countries for the PPACTE Project. National Institute for Health and Welfare; Helsinki, Finland: 2012. [Google Scholar]
- Ohsfeldt RL, Boyle RG, Capilouto E. Letter: Effects of tobacco excise taxes on the use of smokeless tobacco products in the USA. Health Economics. 1997;6:525–531. doi: 10.1002/(SICI)1099-1050(199709)6:5<525::AID-HEC300>3.0.CO;2-Y. [DOI] [PubMed] [Google Scholar]
- Ohsfeldt RL, Boyle RG, Capilouto EL. Tobacco taxes, smoking restrictions, and tobacco use (Working Paper No 6486) National Bureau of Economic Research; 1998. [Google Scholar]
- Oshfeldt RL, Boyle RG. Tobacco excise taxes and rates of smokeless tobacco use in the US: an exploratory ecological analysis. Tob Control. 1994;3:316–323. [Google Scholar]
- Pekurinen M. The Demand for Tobacco Products in Finland. British Journal of Addiction. 1989;84:1183–1192. doi: 10.1111/j.1360-0443.1989.tb00714.x. [DOI] [PubMed] [Google Scholar]
- Pesko MF, Huang J, Johnston LD, Chaloupka FJ. E-cigarette price sensitivity among middle- and high-school students: evidence from monitoring the future. Addiction. 2017 doi: 10.1111/add.14119. [DOI] [PMC free article] [PubMed]
- Ringel JS, Wasserman J, Andreyeva T. Effects of public policy on adolescents’ cigar use: Evidence from the National Youth Tobacco Survey. Am J Public Health. 2005;95:995–998. doi: 10.2105/AJPH.2003.030411. [DOI] [PMC free article] [PubMed] [Google Scholar]
- Stoklosa M, Drope J, Chaloupka FJ. Prices and E-Cigarette Demand: Evidence From the European Union. Nicotine Tob Res. 2016;18:1973–1980. doi: 10.1093/ntr/ntw109. [DOI] [PubMed] [Google Scholar]
- Tait P, Rutherford P, Saunders C. Do consumers of manufactured cigarettes respond differently to price changes compared with their Roll-Your-Own counterparts? Evidence from New Zealand. Tobacco Control. 2015;24:285–289. doi: 10.1136/tobaccocontrol-2013-051010. [DOI] [PubMed] [Google Scholar]
- Tauras J, Powell L, Chaloupka F, Ross H. The demand for smokeless tobacco among male high school students in the United States: the impact of taxes, prices and policies. Applied Economics. 2007;39:31–41. doi: 10.1080/00036840500427940. [DOI] [Google Scholar]
- Tauras JA, Chaloupka FJ. The demand for nicotine replacement therapies. Nicotine Tob Res. 2003;5:237–243. doi: 10.1080/1462220031000073306. [DOI] [PubMed] [Google Scholar]
- United States Bureau of Maternal and Child Health and Resources Development Office of Maternal and Child Health. (NIH Publication No. 86-2874).The health consequences of using smokeless tobacco [WWW Document] 1986 URL http://profiles.nlm.nih.gov/NN/B/B/F/C/ (accessed 2.12.16)
- U.S. Department of Health & Human Services. The health consequences of smoking—50 years of progress: A report of the Surgeon General. U.S. Department of Health and Human Services, Centers for Disease Control and Prevention, National Center for Chronic Disease Prevention and Health Promotion, Office on Smoking and Health; Atlanta, GA: 2014. [Google Scholar]
- White JS, Ross H. Smokers’ Strategic Responses to Sin Taxes: Evidence from Panel Data in Thailand. Health Econ. 2015;24:127–141. doi: 10.1002/hec.3004. [DOI] [PMC free article] [PubMed] [Google Scholar]
- Zheng Y, Zhen C, Dench D, Nonnemaker JM. U.S. Demand for Tobacco Products in a System Framework. Health Econ. 2017;26:1067–1086. doi: 10.1002/hec.3384. [DOI] [PubMed] [Google Scholar]
- Zheng Y, Zhen C, Nonnemaker J, Dench D. Advertising, Habit Formation, and U.S. Tobacco Product Demand. Am J Agric Econ. 2016;98:1038–1054. doi: 10.1093/ajae/aaw024. [DOI] [Google Scholar]