Abstract
Background
Polymeric nanoparticles (PNP) have received significant amount of interests for targeted drug delivery across the blood-brain barrier (BBB). Experimental studies have revealed that PNP can transport drug molecules from microvascular blood vessels to brain parenchyma in an efficient and non-invasive way. Despite that, very little attention has been paid to theoretically quantify the transport of such nanoparticles across BBB.
Methods
In this study, for the first time, we developed a mathematical model for PNP transport through BBB endothelial cells. The mathematical model is developed based on mass-action laws, where kinetics rate parameters are determined by an artificial neural network (ANN) model using experimental data from in-vitro BBB experiments.
Results
The presented ANN model provides a much simpler way to solve the parameter estimation problem by avoiding integration scheme for ordinary differential equations associated with the mass-action laws. Furthermore, this method can efficiently deal with both small and large data set and can approximate highly nonlinear functions. Our results show that the mass-action model, constructed with ANN based rate parameters, can successfully predict the characteristics of the polymeric nanoparticle transport across the BBB.
Conclusions
Our model results indicate that exocytosis (t½,exo = 14.2 h) of nanoparticles is seven fold slower to endocytosis (t½,endo = 1.9 h) suggesting that future studies should focus on enhancing the exocytosis process.
General significance
This mathematical study will assist in designing new drug carriers to overcome the drug delivery problems in brain. Furthermore, we anticipate that this model will form the basis of future comprehensive models for drug transport across BBB.
Keywords: blood-brain barrier, polymeric nanoparticle, drug delivery, artificial neural network, parameter estimation
1. Introduction
The blood-brain barrier (BBB) is a distinct and highly selective barricade formed by the microvascular endothelial cells together with the other neurovascular elements such as astrocytes, pericytes, and microglial cells [1, 2] to protect the brain against harmful agents. The endothelial cells in the BBB are connected to each other through tight junctions. These tight junctions preclude paracellular transport of solutes across BBB except some water-soluble substances. Several transcellular routes, such as transporter protein mediated, receptor-mediated, adsorptive mediated, cell-mediated transcytosis etc. are available for transportation of metabolites and other essential components for proper functioning of brains [3]. However, these transport routes cannot be used for delivering large-molecule drugs and more than 98% of small-molecule drugs across the BBB [4]. To enhance the efficacy of therapeutic delivery through the BBB, several techniques have been tested with varying degrees of success. Among various techniques, tight junction disruption, drug molecules modification and carrier-mediated transportation have dominated the drug delivery research.
Tight junction opening is reported using biological, chemical, and physical stimuli [3]. Biologics such as virus, macrophage, cereport, zonula occludens toxin etc. can increase paracellular transport by either opening tight junctions or using Trojan horse effect [3]. Selected chemicals such as cyclodextrin and poloxamers can extract water and other substances (e.g. cholesterol) from endothelial cells, which lead to opening of gaps between cells for paracellular transport. Physical mechanisms such as ultrasound, microwave, and electromagnetic field can also open tight junctions by protein translocation, which enhance the BBB permeability. Although various stimuli can potentially increase the penetration of drugs to the brain, high concentration of these stimuli compounds can compromise the BBB.
Drug delivery across BBB through modification of drugs is attempted either by direct conjugation of drugs to a BBB transporter (such as glucose transporter) or by targeting lipid-mediated transport of drugs. However, because of highly selective nature of transporters, drugs transport by direct conjugation to a transporter is only possible if drug molecules meet all criteria of endogenous ligands [5]. Lipidization is done by attaching lipid-like molecules on the drug structure by modifying hydrophilic moieties. Although high lipophilicity favored higher permeability of drugs, this lipidization does not ensure targeted drug delivery because the permeability of lipidized-drugs increases across all biological membranes in the body [6]. Moreover, this approach is only suitable for drugs having molecular weight less than 500 Da since higher molecular weight compounds cannot cross BBB through passive lipid soluble mechanism.
Another promising avenue for drug transport across BBB is through carriers such as liposomes, nanoparticles, nanospheres, nanosuspensions, polymer micelles, and nanogels [7]. Among them, nanoparticle-based therapeutic delivery is extensively studied because of their noninvasiveness and targeted drug delivery capability [8]. As a results, several nanoparticle-based system such as mesoporous silica [9, 10], silver [11], superparamagnetic iron oxide [12], gold [13], polymeric [14] nanoparticle have been developed and tested as a drug delivery mechanism through BBB with different levels of success. Polymeric nanoparticles offer several advantages over non-polymeric ones because of their similarity with natural carriers such as serum lipoproteins and viruses. Moreover, they can be targeted not only to the particular organ/tissue, but also to a particular cell or even an intracellular compartment [7]. In addition, polymeric nanoparticles increase drug solubility, improve bio-distribution of drugs, and can potentially decrease side effects [14].
Although significant efforts have been made to study the nanoparticle transport through BBB experimentally, not much attention has been paid to theoretically quantify the transport mechanism. Mathematical modeling is a powerful tool to understand the biological processes such as transport across BBB, where experiments are intricate, costly and sometimes ethically wrong. Hinow et al. [15] developed a mathematical model to describe the transport of free drugs from blood to brain once drugs get released from liposomes under the application of focused ultrasound. However, their model neglects drug accumulation by the endothelial cell and active efflux of drugs from brain to blood. The quantification of accumulated drugs is very important because accrual of particles can increase the toxicity in endothelial cells which may alter the BBB integrity. Loeser [16] modeled the drug release from a temperature-sensitive liposome and the diffusion of drugs in a brain cancer cell, but their model does not include the transport of liposomes from blood to targeted brain cancer cells. Recently, Khan et al. [17] developed a mathematical model for receptor-mediated transcytosis of iron across BBB. Although our previous model addresses the transcytosis, it can’t be used to predict the nano-carrier based drug transport across the BBB because of difference in mechanisms and pathways between iron molecule and nanoparticles.
The goal of the current research is to develop a mathematical model for nanoparticle transport across the BBB using the laws of mass-action. Mass action laws can generally be formed as a set of ordinary or partial differential equations. The estimation of parameters is the crucial step in the development of these type of models. Several methods are developed and used for the parameter estimation such as least square [18], Bayesian approach [19], incremental approach [20], artificial neural network approach [21], preprocessing method [22] etc. Among these methods, least square is the oldest, simplest and widely used for parameter estimation. However, this method suffers from convergence problems. In addition, this approach may get trapped into the local optimal solution instead of the global one [21, 23]. In this work, an artificial neural network (ANN) based model is presented for parameter estimation. Our ANN based parameter estimation method is much simpler to solve since it does not require an integration scheme for differential equations [21]. In addition, ANN can deal with large data sets, can efficiently approximate highly nonlinear functions, and can be used for multi input-output variables [24]. To train our ANN model, we have considered the transcytosis of poly[Triphenylamine-4-vinyl-(P-methoxy-benzene)] (TEB)-based nanoparticles through BBB. We specifically select TEB-polymeric nanoparticles because TEB nanoparticles exhibit excellent fluorescence properties which eliminates the necessity of tagging with additional fluorescence markers. Thus, this type of nanoparticles can potentially be used in both imaging and drug delivery. Moreover, TEB nanoparticles can be synthesized as small as ~20 nm. It has been reported that smaller size (~20 nm) nanoparticles yield higher transcytosis across BBB [13, 25, 26]. In addition, the TEB nanoparticles are highly biocompatible. Controlled transcytosis experiments of TEB nanoparticles across BBB are performed on an in vitro BBB model which is constructed based on mouse cerebral endothelial cells (bEnd.3).
Rest of the paper is organized as follows. In the following section, mathematical model for nanoparticle transport through BBB endothelial cells is presented. Next, an ANN model is presented for estimation of kinetic parameters. In section 4, we describe the in-vitro experiments of both endocytosis and exocytosis to determine the nanoparticle transport rate across the BBB. In section 5, we present important results such as estimated rate parameters for nanoparticle transcytosis and time required for nano-carrier penetration. Finally, we present our conclusions and future research outlook.
2. Mathematical Model
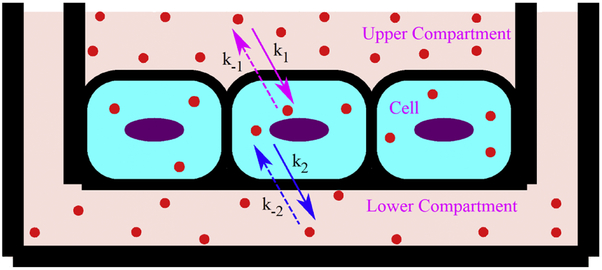
A mass-action based mathematical model is presented to study the transcytosis of nanoparticle from the upper (luminal) chamber to lower (abluminal) chamber as shown in Fig. 1. Endocytosis of nanoparticles can occur by various active transport mechanisms. At the same time, endocytosed nanoparticles may recycle back from cell to upper compartment due to the presence of active efflux pumps in BBB endothelium. The endocytosis and recycling of nanoparticles can be expressed with the following reversible kinetic equation
| (1) |
where Nup and Ncl represent the number of TEB nanoparticles in upper compartment and cell, respectively, k1 and k−1 are the overall rate of endocytosis and recycling of nanoparticles, respectively. The fusion machinery of BBB endothelium transports the nanoparticles from cell to lower compartment of transwell through basolateral membrane by an exocytosis mechanism [27, 28]. Like recycling process through the apical membrane in the luminal side, transported nanoparticles can be internalized from abluminal side (lower compartment) to endothelial cell through basolateral membrane. This process is termed as reendocytosis in the literature [29]. The exocytosis and reendocytosis of nanoparticles can be expressed by the following reversible first order kinetic equation
| (2) |
where Nlo represents the number of TEB nanoparticles in lower compartment, k2 and k−2 are the overall rate of exocytosis and reendocytosis of nanoparticles, respectively.
Fig. 1.
Schematic of nanoparticle (filled circle) transcytosis through a transwell BBB model. At time t=0, nanoparticles are introduced on the upper chamber for transcytosis.
By applying the mass-action laws, the first order reversible reactions (Eq. 1-2) can be converted into the following first order ODEs:
| (3) |
| (4) |
| (5) |
where nup, ncl and nlo represents concentration of nanoparticles in upper compartment, cells and lower compartment, respectively at any time t. Equations (3-5) can be solved if the initial concentrations (nup,0, ncl,0 and nlo,0) and various rate constants (k1, k−1, k2 and k−2) are known. Nanoparticle concentrations in the upper compartment, cell, and lower compartment at the start of experiment (incubation) can be taken as initial conditions. Obviously, at the start of transport study, nanoparticle concentration in the upper compartment, nup,0, can be found by dividing the amount of nanoparticle placed in upper compartment with the volume of medium placed in the upper compartment. On the other hand, nanoparticle concentrations both inside the cell, ncl,0, and in the lower compartment, nlo,0, are zero at the start of transport assay. For the sake of simplicity, all variables are normalized as
| (6) |
where T can be any appropriate time scale for normalization purpose. Using these non-dimensional variables, Eqs. (3-5) can be reduced to
| (7) |
| (8) |
| (9) |
where ,, and . Although nanoparticle concentration at the beginning of the experiments can be found readily (; and ), determination of appropriate rate constant parameters ( , , and ) is extremely important for completeness of this type of model. In next section, we describe our method for finding the rate constant parameters, which is the primary objective of this work.
3. Parameter Estimation
Traditionally, the rate constant parameters are determined by solving the following optimization problem [21]:
| (10) |
where is a J dimensional vector of state variables, is the vector of parameters, are the experimentally observed values of the state variables at time τp and are the corresponding model prediction. In our model, J = 3 for variables , and and = [,,,] as presented in Eqs. 7-9. The must be estimated such that the objective function (ε) is minimized.
Although traditional method described above is simple to implement, it suffers from convergence problems. More importantly, the traditional method is get trapped into the local optimal solution instead of the global one [23]. To circumvent these concerns, we present an artificial neural network (ANN) based model to estimate parameters () by following the work of Dua [21].
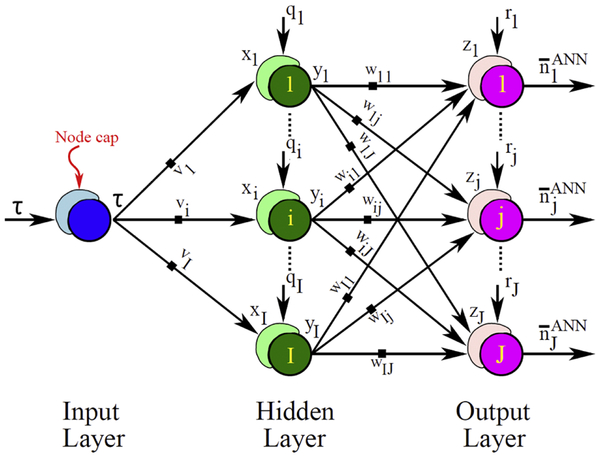
The general architecture of the ANN used in this work is shown in Fig. 2, where only fundamental steps are presented for parameter estimation related to a system of ordinary differential equations (ODEs). The ANN model shown in Fig. 2 has only one node in the input layer because in our ODE-based model time is the only independent variable. The number of nodes in the output layer must be equal to the number of outputs (J). The number of hidden layers and the number of nodes in each hidden layer can be arbitrary. In our model, we have considered a single hidden layer with I number of nodes.
Fig. 2.
Schematic of an artificial neural network (ANN), consisting of one input, one hidden and one output layer, for a system of ODEs presented in Eqs. (7-9). Input layer has only one node, while the hidden layer and the output layer are made of I and J nodes, respectively. The cap in the node sums up all the weighted inputs and feeds as total activation. For details about the ANN, readers are referred to [24, 30].
For a linear transfer function and no threshold in the input layer, the output of the input layer is exactly equal to the input (τ). Thus, the total activation for the hidden layer, xi can be given as
| (11) |
where qi is the threshold in the ith node of hidden layer and vi is the weight factor between the node of input layer and the ith node of hidden layer. Considering a sigmoid transfer function in the hidden layer, output of hidden layer, yi can be given as
| (12) |
Here, we choose a sigmoid transfer function because, in general, this function yields well-behaved networks [30]. Thus, the total activation for the output layer, (zj) can be expressed as
| (13) |
where rj is the threshold in the jth node of output layer and Wij is the weight factor between the ith node of hidden layer and the jth node of output layer for the input yi. Similar to hidden layer, considering a sigmoid transfer function in the output layer, output of this layer can be written as
| (14) |
Thus, for our ANN model, unknowns are the threshold vectors (qi and rj) and the weight factor matrices (vi and Wij). Values of the threshold vectors and the weight factor matrices can be determined by solving the following optimization problem:
| (15) |
A number of efficient algorithms, such as backpropagation algorithm [31], generalized delta rule, radial bias algorithm [30], etc. are available in the literatures for solving the aforementioned optimization problem (Eq. 15). Once the threshold vectors and weight factor matrices are found, the derivative of the state variables can be determined by differentiating Eq. (14) with respect to nondimensional time, τ as
| (16) |
Note that this will provide the rate of change of state variables (left-hand side of Eqs. 7-9). Thus, one can estimate the required parameters for the model by solving the following optimization problem [21]:
| (17) |
subject to: > 0.
Here represents the right-hand side of Eqs. (7-9). This optimization problem is much simpler to solve because this does not require an integration scheme. The first term on the right-hand side of Eq. (17) can be easily obtained from Eq. 16, while the second term can be calculated from the right-hand side terms of Eqs. (7-9) using the artificial neural network solution of state variables (Eq. 14). Here, it is noted that traditional method (Eq. 10) minimizes error between observed and model predicted values of state variables, whereas, our model (Eq. 17) minimizes error between the derivatives of the state variables. This derivative based optimization method is used in other work [22], however, in their work, derivatives are determined using a preprocessing method.
4. Experimental Section
4.1. Materials and reagents
Transwells (Polycarbonate membrane 0.4 μm) were purchased from Fisher Scientific (Waltham, MA, USA). Biological reagents, such as born calf serum, gentamycin, penicillin, streptomycin, fetal bovine serum (FBS), and ATCC® 30-2002™ Dulbecco's Modified Eagle's Medium (DMEM) were obtained from ATCC (Manassas, VA, USA). All other chemicals and solvents were obtained from Sigma-Aldrich (St. Louis, MO, USA).
4.2. Preparation of poly-[Triphenylamine-4-vinyl-(P-methoxy-benzene)] (TEB)-based nanoparticles
In order to obtain TEB-based nanoparticles, the TEB polymer was first synthesized from the reaction of two intermediates: intermediate1 [4,4'-diformyl-triphenylamine], and intermediate2 [2,5-di- (ethoxyphosphorylene) −1,4-dimethoxybenzene (phospholipid)]. The intermediate1 was prepared through a series of chemical reactions of N, N-dimethylformamide, phosphorus oxychloride and triphenylamine. The obtained final product was purified for further use. The intermediate2 was obtained from the final product of a series of chemical reactions of 1,4-dioxane, 1,4-dimethoxybenzene, hydrochloric acid, formaldehyde, and triethyl phosphite. The obtained product was re-crystallized with acetone to gain intermediate2. Both intermediate1 and intermediate 2 were solid powders. Finally, the TEB polymer was synthesized through Wittig-Horner reaction of intermediate1 and intermediate2. All chemical products during the synthesis process were characterized and confirmed using the nuclear magnetic resonance (NMR). The obtained TEB polymer was dissolved in the solution of tetrahydrofuran, Poly(styrene-co-maleic anhydride) and water. Nitrogen gas was then bubbled through the solution to evaporate the solvents. As the solution was concentrated, the fluorescent TEB-based nanoparticles were obtained by co-precipitation from the solution.
4.3. Physical and chemical characterization of TEB-based nanoparticles
Previous studies suggest that the nanoparticle transport efficiency across the BBB decreases with the increase of particle size. For instance, several studies reported that the maximum transport efficiency is achieved for particle size ranging between 20~30 nm [10, 13, 25]. Thus, the synthesis steps are controlled to form nanoparticles in that ballpark. The size and morphology of TEB-based nanoparticles is characterized by transmission electron microscopy (TEM, Philips CM200 UT, Field Emission Instruments, USA).
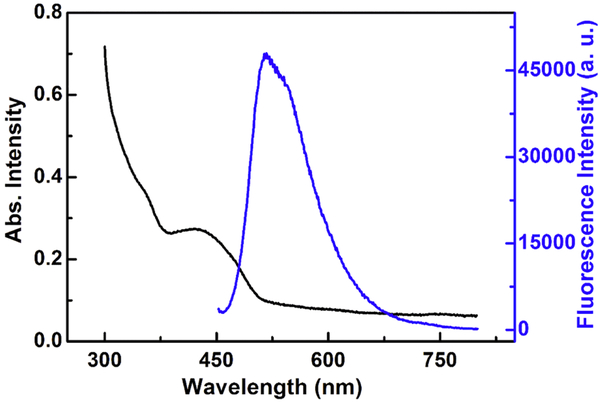
The ultraviolet-visible absorption spectra of TEB-based nanoparticles were measured with a Genesys 10s Bio UV/Visible Spectrophotometer (Thermo Scientific, Waltham, MA, USA), while the fluorescence spectra are analyzed with FluoroMax-4 spectrofluorometer (Horiba, Japan). The optical characteristics of these nanoparticles are shown in Figure 3. The UV-vis absorption spectra of TEB-NPs in aqueous solution exhibits an absorption-band maximum at wavelength 435 nm, which corresponds to excitation wavelength for fluorescence spectra analysis. The emission peak of TEB nanoparticles was centered around 520 nm. The TEB nanoparticles have a zeta potential of −53.0 mV which illustrates their shear plane charge. The zeta potential is measured by a Malvern Zetasizer Nano ZS90 (Malvern Instruments Ltd., UK).
Fig. 3.
UV-vis absorption spectra (black line) and photoluminescence (blue line) of TEB-NPs.
4.4. Construction of in vitro BBB model
In our experiment, the mouse brain cell line (bEnd.3) is used for construction of transwell BBB model. Yuan et al. [32] reported that the cultured bEnd3 monolayer is able to maintain many characteristics of the BBB: low (paracellular) permeability, fairly well-formed tight junctions; comparable thickness and the charge density of surface glycocalyx layer to that of the intact BBB. In addition, Brown et al. [33] found that bEnd.3 cell line expresses the BBB tight junction proteins ZO-1 and ZO-2, the transmembrane proteins occludin and claudin-5, the cytoskeletal protein actin. These and many other similar studies concluded that bEnd3 cells are an attractive candidate for BBB model due to their rapid growth, maintenance of BBB characteristics over repeated passages, amenability to numerous molecular interventions and formation of functional barriers.
The in vitro model construction starts with the placement of polycarbonate membrane insert (0.4 μm) inside the well of a 6-well plate. Each well is then seeded with 1×10⁵ bEnd.3 cells. Next, 2.00 ml and 2.75 ml of DMEM medium are added to the luminal side (upper compartment) and the abluminal side (lower compartment) of the transwell, respectively. Then, the cells are cultured inside the transwell in a humidified incubator at 37°C with 5% CO2. The culture medium was changed every day for cell growth.
The development of tight junctions and the integrity of the BBB model are evaluated with the trans-endothelial electrical resistance (TEER). The TEER values are calculated by measuring resistance across the membrane using an EVOM voltohmeter (10 μA current at 12.5 Hz) as
| (18) |
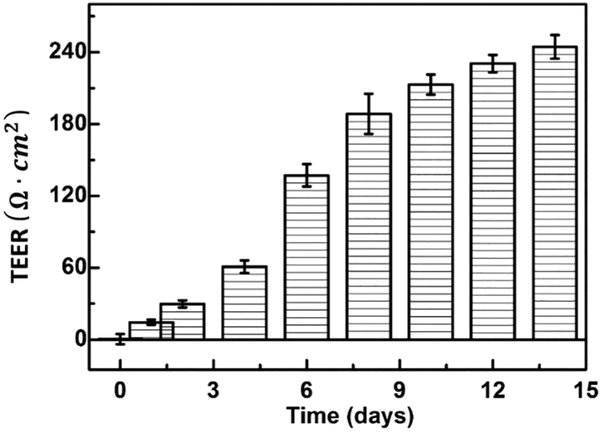
where Rt is the total resistance of the cell culture medium with cells and Rb refers to the resistance of polycarbonate membrane placed in the culture without any cells, and A is the area of transwell. The TEER value is directly correlated with the permeability of BBB for transport of extracellular molecule and a TEER value over 200 Ω × cm2 can confirm the confluence of in vitro model [34]. Fig. 4 shows the TEER value of cultured bEnd.3 cells at different days of incubation. As shown in Fig.4, a TEER value of around 240 Ω × cm2 is detected on day 14 in our model. This illustrates that cultured bEnd.3 cell monolayer is confluent and can adequately serves as an in vitro model for evaluating the transport of TEB nanoparticles. The observed TEER values are in line with previous studies. Liu et al. has reported a TEER value upward of 300 Ω × cm2 with a monolayer culture of bEnd.3 cells on day 12 [25]. Gao et al. [35] and Sharma et al. [36] also reported a TEER value above 200 Ω × cm2 for similar BBB model. Therefore, bEnd.3 monolayers with TEER value above 200 Ω × cm2 are selected for subsequent experiments.
Fig. 4.
The trans-endothelial electrical resistance (TEER) values of the BBB models during cell culture. The error bars show the standard deviation of TEER values. The tight junctions between neighboring endothelial cell are demonstrated by extremely high electric resistance (more than 200 Ω × cm2) within 10 days of culturing.
4.5. Cytotoxicity of the TEB-based nanoparticles
In vitro cytotoxicity of the TEB nanoparticles against bEnd.3 cells was evaluated by a standard 3-(4,5-dimethylthiazol-2-yl)-2,5-diphenyltetrazolium (MTT) assay. The optical density was recorded at 540 nm by synergy H1 microplate reader (BioTeK, Winooski, VT). The relative cell viability can be estimated as
| (19) |
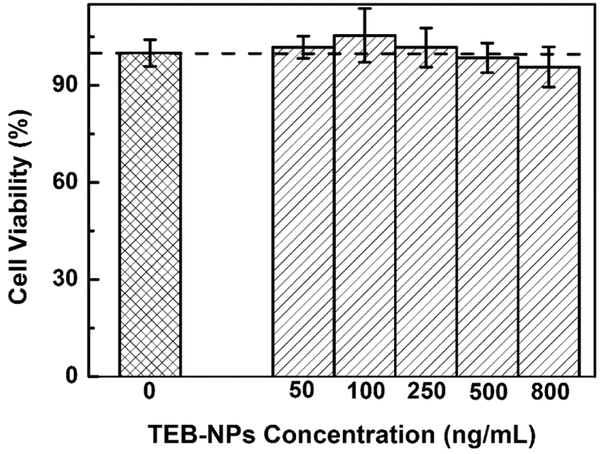
where Atest is the UV signal of cells with different nanoparticle concentration and Acontrol is the UV signal of the cells without any nanoparticles. In this study, different concentration of TEB-NPs (0, 50, 100, 250, 500, 800 ng/mL) were incubated with bEnd.3 cells for 24 h, and cell viability is calculated with aforementioned formula. As shown in Fig. 5, as the concentration of TEB nanoparticles increases, the percentage of cell viability decreases slightly from control (no nanoparticle). However, more than 90% of the bEnd.3 cells survived in the TEB-NP concentration range (50 to 800 ng/mL) studied here. This manifests that TEB-NPs can be used to develop safe nanoprobes for BBB model.
Fig. 5.
Cytotoxicity of TEB-NPs in bEnd.3 cells. Values are means of triplicate experiments and the error bars represent the standard derivations.
4.6. Transport efficacy of TEB based nanoparticles across BBB monolayer
To estimate the uptake and transcytosis of nanoparticles across BBB, a specific amount of TEB nanoparticles is added into the luminal side of the BBB model. The progressive transfer of TEB nanoparticles, from upper (luminal) compartment to lower (abluminal) compartment, is followed for 12 h at an interval of 2 h. The medium (with nanoparticles) from the upper and lower compartments is collected separately at different times (2, 4, 6, 8, 10, 12 h) and its fluorescent intensity is measured. At the same time, the fluorescent intensity of pure DMEM medium (without any TEB nanoparticles) is also determined. These fluorescence intensity data are used to quantify the time-dependent nanoparticles transport process across the BBB endothelial cells. The BBB transport efficiency (TE) of TEB nanoparticles is calculated as:
| (20) |
where Flo is the fluorescence intensity in the lower compartment at various time, Fup,0 is fluorescence intensity in the upper compartment at the start of incubation and Fb is the background (pure medium) fluorescence intensity.
5. Results and Discussion
5.1. Calibration curve for determining nanoparticle concentration
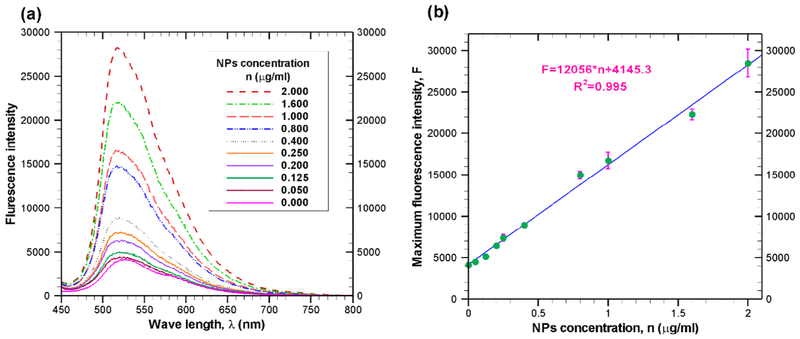
Since we measured the fluorescence intensity as an indication of nanoparticle concentration, the relationship between the nanoparticle concentration and the fluorescence intensity needs to be established. To achieve that several known sample solutions have been prepared by mixing TEB nanoparticles with DMEM medium. Fluorescence spectra of each sample solution is measured with FluoroMax-4 spectrofluorometer (Horiba, Japan). Fig. 6a presents the fluorescence spectra of TEB nanoparticles at a concentration ranging between 0 and 2 . Similar to other nanoparticles such as gold nanoparticles [37], the fluorescence intensity of the synthesized TEB nanoparticle increases with the increasing concentration of nanoparticles as indicated in Fig. 6a. This figure also reveals that the maximum fluorescence intensity occurs at a specific wave length which is around 520 nm. As shown in Fig. 6b, a linear relationship (R2 = 0.995) exists between maximum fluorescence intensity and concentration of nanoparticle. From experimental data, a relationship between nanoparticle concentration and maximum fluorescence intensity can be expressed as
| (21) |
where F(t) is the maximum fluorescence intensity at any time t and n(t) is the nanoparticle concentration in at that time.
Fig. 6.
(a) Fluorescence response for various concentration of TEB nanoparticle in the medium. All fluorescence values are mean of triplicate experiments. The data are obtained after excitation of suspended TEB nanoparticles at 435 nm. (b) The relation between nanoparticle concentration and maximum fluorescence intensity.
5.2. Transcytosis of nanoparticles through in vitro BBB
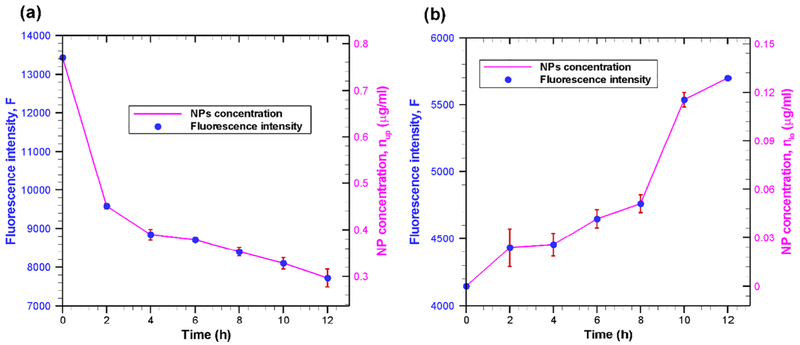
The time-dependent nanoparticle concentrations (solid line) in upper (luminal) and lower (abluminal) compartments are shown in Fig. 7a and Fig. 7b, respectively for an initial luminal TEB nanoparticle concentration of 0.77 From Fig. 7a (solid line) it is seen that nanoparticle concentration in upper compartment is decreasing with increasing incubation time. This indicates that the nanoparticles are internalized by the cells; with increasing incubation time, more nanoparticles are internalized. Internalization of nanoparticles results in a reduction of nanoparticle concentration in the upper compartment, and hence, a decrease in fluorescence intensity. The nanoparticle concentration in the lower compartment is increasing with increasing incubation time as shown in Fig. 7(b). This point out that the nanoparticles are transported from cells to lower compartment. The continuous transportation of nanoparticles from cells to lower compartment results in an increase in concentration of nanoparticles in the lower compartment.
Fig. 7.
Fluorescence intensity (symbol) and nanoparticle concentration (solid line) in (a) upper compartment and (b) lower compartment at various incubation time. All fluorescence intensity values are mean of triplicate experiments ± standard error (bars) under identical experimental conditions. Nanoparticle concentration is calculated using Eq. (21) from the fluorescence intensity data. In our study, the TEB nanoparticles diameter is ~25 nm.
Our results clearly demonstrate that TEB nanoparticle can cross the in-vitro BBB. Initially (first couple of hours) the rate of internalization of nanoparticle is relatively higher, but later nanoparticle internalization rate is reduced greatly (Fig. 7a). On the other hand, nanoparticle transport rate across BBB is initially very low, but later (after 8 hours of incubation) is increased (Fig. 7b). Our results show that 15% of initial number of nanoparticles are transported across the bEnd.3 cell monolayer (i.e. a transport efficiency of 15%) after 12 h incubation. Our reported transport efficiency is significantly higher than those reported in some other studies [38, 39]. The main reasons for large difference in transport efficiency between current study and those reported in previous works [38, 39] are due to different particle sizes (as well as materials) and BBB systems. It has been reported that the particle size has a negative correlation for transport across the BBB [10]. In other words, as the particle size decreases, the transport efficiency across BBB increases. In addition, for the same solute, permeability across monolayer-BBB (monoculture of endothelial cells) is considerably higher than that of multilayer-BBB (coculture of endothelial cells and astrocytes), although both models are good for studying the transport of solutes across the BBB [40]. Here it is noteworthy that one study [38] used immunoliposomes of size around 140 nm, while the other study [39] is based on gold nanoparticles of overall size between 70 and 100 nm. Moreover, in both studies, BBB is established by co-culture of brain endothelial cells and astrocytes. On the other hand, in our study, monolayer BBB is formed with bEnd.3 cell and transport assay is carried out with TEB nanoparticles of size ~ 25 nm. Since, the particle size is very low and BBB is formed with bEnd.3 monolayer, current study yields higher transport efficiency. This observed transport efficiency is in line with previous works having similar BBB system and comparable particle size. For instance, Liu et al. [25] reported a transport efficiency of 26.1 ± 8.9% across the BBB (formed by bEND.3 cell monolayer) after 12 h incubation with poly(ethylene glycol) (PEG) coated silica nanoparticles (25 nm diameter). Qiao et al. [41] also showed that transport efficiency of PEG-coated Fe3O4 nanoparticles across monolayer BBB (formed by porcine brain capillary endothelial cells) can be as high as 22.5 ± 1.4%. Here it is noteworthy to mention that even with three layer BBB system (co culture of bEND.3 cell line, pericytes and astrocytes), 25 nm silica nanoparticle yields a much higher transport efficiency [10].
Next, we determined the nanoparticle accumulation inside the cell. Considering negligible degradation of TEB nanoparticles inside the cell, the mass balance equation can be given as follows:
| (22) |
Integrating this equation from starting time (t = 0) to any time t with initial conditions, nup,0 = 0.77, ncl,0 = 0 and nlo,0 = 0, we get following mass balance equation for nanoparticle accumulation inside the endothelial cells:
| (23) |
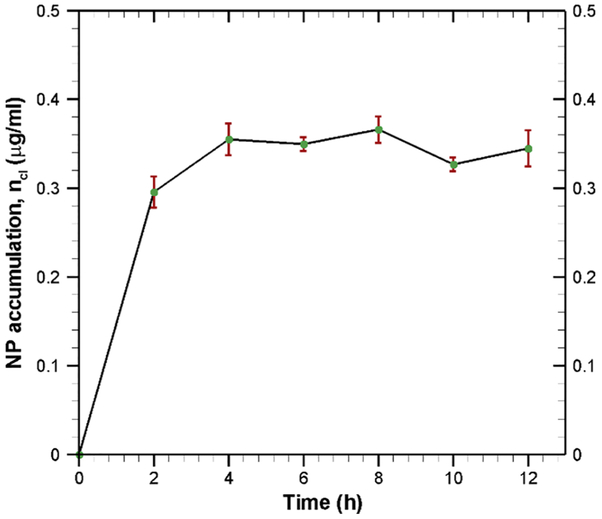
The progressive accumulation of TEB nanoparticles inside the endothelial cell is shown in Fig. 8. During the first 4 hours, there is a rapid accumulation of nanoparticles inside the cell because of high endocytosis and low exocytosis. Fig. 8 indicates that TEB nanoparticle accumulation gets saturated after 4 h. This kind of saturation characteristics is quite common for other particles such as iron transport across BBB [42]. The saturation in nanoparticle accumulation is due to the fact that cells have a limiting capacity to hold nanoparticles. This saturation in nanoparticle accumulation also indicates that endocytosis is in equilibrium with exocytosis [42].
Fig. 8.
Accumulation of nanoparticles inside the endothelial cells at various incubation time. Data are calculated by material balance using Eq. (23).
5.3. Estimation of kinetic rate constant
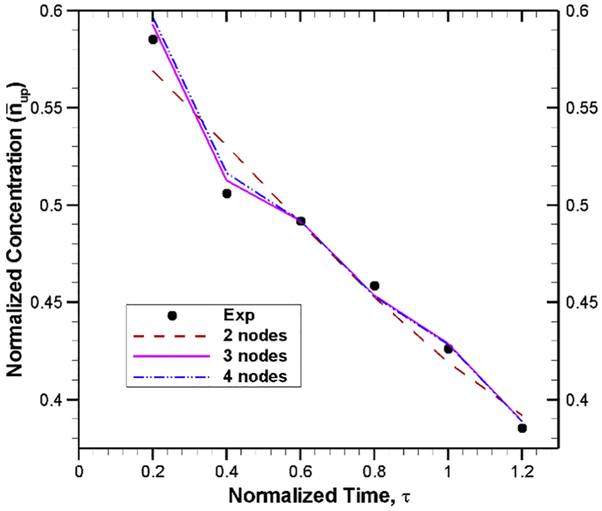
The primary focus of this study is to find the rate constants for model equations using experimental data. For simplicity, the analysis was performed for normalized governing equations presented in Eqs. (7-9). Thus, the experimental data of nanoparticle concentrations are normalized with nup,0 = 0.77 , while the time is normalized with = 10 h. Using these normalized experimental data, the optimization problem given in Eq. 17 is solved by applying a generalized delta rule algorithm [30] with an error of 10−3. In this optimization scheme, all the available data points are fed for the training of artificial neural networks given by Eqs. (11-14) because of limited number of experimental data points. A single hidden layer with 3 nodes is considered in our ANN model because we have found that, for this particular problem, 3 nodes in the hidden layer provide faster convergence (as shown in Fig. 9). Although the final weight factors and thresholds depend on the initial guess of these parameter, for the sake of completeness, the weight factors and thresholds are listed in Table 1 with 3 nodes in the hidden layers.
Fig. 9.
Comparison of ANN model output with experimental data for different number of nodes in the hidden layer. For a tolerance limit of 10−3, the number of iterations needed for 3 and 4 nodes are 1203 and 1409, respectively. On the other hand, with 2 nodes in the hidden layer, a convergence cannot be achieved even with 12,000 iterations.
Table 1:
Weight factors and thresholds for 3 nodes in the hidden layer
| Weight factors | Thresholds | ||
|---|---|---|---|
| Input layer to hidden layer |
Hidden layer to output layer | Hidden layer |
Output layer |
Next, the derivatives of the state variables at different time are calculated by using Eq. 16. Finally, optimization problem given by Eq. (17) is solved by an incremental search technique [17] to find the parameters vector, In brief, one of the parameter value is selected and then its value is changed by a random amount. If this change decreases the error (ε) as presented in Eq. 17, then the new value is kept. Otherwise, previous value is maintained and checked for the other parameters until the error becomes smaller than the tolerance limit. For the tolerance limit 1 × 10⁻³, the estimated parameter values are given in Table 2.
Table 2:
Estimated parameters (nondimensional form) using artificial neural network.
| Nondimensional parameters | ||||
|---|---|---|---|---|
| Estimated value | 3.684 | 3.425 | 0.489 | 0.992 |
5.4. Validation of artificial neural network model
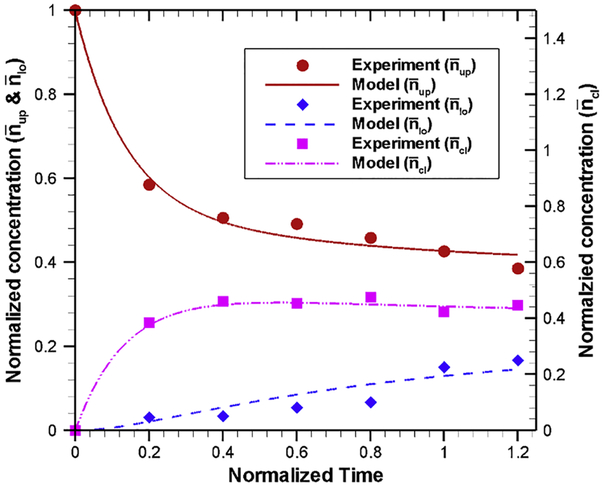
To check the accuracy of the estimated parameters, the mass action model is solved with the estimated parameters using 4th order Runge-Kutta method [43, 44]. A comparison of model results (obtained with estimated parameters) and experimental data, as shown in Fig. 10, indicates that our artificial neural model is very effective in estimating the kinetic rate parameters. Our model results show that, after 12 hours of incubation, around 42% of nanoparticles remain in the upper compartment (red solid line), whereas in experiments approximately 40% nanoparticles remain in the upper compartment (red circular symbols) during the same time. Model results also show that nearly 14.6% of nanoparticles are transported to the lower compartment (dashed blue line) while experimental results indicate ~ 15% nanoparticles are transported to the lower compartment (blue diamond symbols). In addition, model results show that a large fraction of nanoparticles (~ 44%) are accumulated inside the endothelial cells (purple line). Overall, our model results capture the experimental trend very well. This justify that our estimated kinetic rate parameters are suitable to capture the nonlinear behavior of nanoparticle uptake, accumulation and transport across the BBB.
Fig. 10.
Comparison of (normalized) nanoparticle concentration predicted by mass-action model using the estimated kinetic rate parameters (Table 2) with experimental data for upper compartment, lower compartment and inside the cell at various normalized incubation time. Experimental results for different compartments are shown by different symbols (red circle: upper compartment, blue diamond: lower compartment and pink square: cell), while model results for different compartments are shown by different lines (red solid line: upper compartment, blue dashed line: lower compartment and pink line: cell).
The dimensional parameters are calculated from nondimensional values using their relationship (, , and and these kinetic rate parameters are listed in Table 3. From the estimated rate constants, we can determine two important parameters: the half time of internalization or endocytosis and the half time of exocytosis. Half time is defined as the time required for any specified property (e.g. concentration or radioactivity) to decrease by half of its initial value [45]. Thus, the half time of a first order process can be calculated as [45, 46]:
| (24) |
where k is the rate constant of that process. Using our estimated rate constants, the half times for endocytosis and exocytosis are t½,endo = 1.9 h and t½,exo = 14.2 h, respectively. This indicates that the exocytosis of nanoparticle through the basolateral membrane of BBB endothelial cells is much slower than the endocytosis of nanoparticles through the apical membrane of the same endothelial cells.
Table 3:
Estimated parameters (dimensional form)
| Parameters |
k1 (s−1) |
k−1 (s−1) |
k2 (s−1) |
k−2 (s−1) |
|---|---|---|---|---|
| Estimated value | 1.023 × 10 −4 | 9.514 × 10 −5 | 1.358 × 10 −5 | 2.756 × 10 −5 |
6. Conclusions
An artificial neural network (ANN) model, consisting of one input, one hidden and one output layer, is presented to estimate the kinetic rate constants for transcytosis of polymeric nanoparticles through an in vitro BBB. The BBB model is created by culturing bEND.3 cells in a controlled environment for 12~14 days. TEB nanoparticles (diameter ~ 25 nm) are allowed to pass through the BBB endothelial cells, and concentration of nanoparticle are measured at different times both at the luminal and abluminal sides from their fluorescent intensities. The artificial neural network-based optimization problem is solved using experimental data for different number of nodes in the hidden layer, while maintaining one and three nodes in the input and output layers, respectively.
The kinetic rate parameters obtained from the ANN model, in conjunction with the mass-action mathematical model, can effectively reproduce the experimental results for nanoparticle concentrations at different compartments including the accumulation of nanoparticles inside the endothelial cells. Quantification of nanoparticle accumulation is very important because high concentration of nanoparticle can increase the toxicity which may reduce the integrity of BBB. Our results show that the endocytosis of nanoparticle by BBB endothelial cells is a faster process than exocytosis of nanoparticles from BBB endothelial cells. Although the endocytosis rate is reasonably high, the accumulation of nanoparticles inside the cell and low exocytosis rate make the overall transcytosis process very challenging. The BBB penetration efficiency of TEB nanoparticles is roughly 15% in 10 hours, which can be enhanced by modifying the nanoparticles with suitable chemistry. For TEB nanoparticles, the half time of endocytosis and exocytosis becomes 1.9 h and 14 h, respectively.
Our current model is developed for in vitro scenario and appropriate modifications are needed for in vivo applications. However, this rate determination scheme/model can be used for transport of any type of nanoparticle across any kind of cells. In addition, this model can be used as a backbone for other similar problems such as receptor-mediated transcytosis of drugs and their carriers. Unfortunately, time series data is not available for this type of analysis, and we will address that in near future once reliable time series data are available for different processes.
Highlights.
A new mathematical model is presented for polymeric nanoparticle transport across BBB
Artificial neural network-based model is used for kinetic rate parameter estimation
Model predicted nanoparticle concentrations agree well with in vitro BBB experiments
Endocytosis of nanoparticles to cells is comparatively faster than exocytosis from cells
7. Acknowledgment
This work was supported by the National Institute of General Medical Sciences of the National Institutes of Health under Award Number R01GM122081. The content is solely the responsibility of the authors and does not necessarily represent the official views of the National Institutes of Health.
Footnotes
Publisher's Disclaimer: This is a PDF file of an unedited manuscript that has been accepted for publication. As a service to our customers we are providing this early version of the manuscript. The manuscript will undergo copyediting, typesetting, and review of the resulting proof before it is published in its final citable form. Please note that during the production process errors may be discovered which could affect the content, and all legal disclaimers that apply to the journal pertain.
8 References
- [1].Cecchelli R, Berezowski V, Lundquist S, Culot M, Renftel M, Dehouck MP, Fenart L, Modelling of the blood-brain barrier in drug discovery and development, Nature Reviews Drug Discovery, 6 (2007) 650–661. [DOI] [PubMed] [Google Scholar]
- [2].Abbott NJ, Patabendige AA, Dolman DE, Yusof SR, Begley DJ, Structure and function of the blood-brain barrier, Neurobiology of Disease, 37 (2010) 13–25. [DOI] [PubMed] [Google Scholar]
- [3].Chen Y, Liu LH, Modern methods for delivery of drugs across the blood-brain barrier, Advanced Drug Delivery Reviews, 64 (2012) 640–665. [DOI] [PubMed] [Google Scholar]
- [4].Pardridge WM, The blood-brain barrier: bottleneck in brain drug development, NeuroRx, 2 (2005) 3–14. [DOI] [PMC free article] [PubMed] [Google Scholar]
- [5].Juillerat-Jeanneret L, The targeted delivery of cancer drugs across the blood-brain barrier: chemical modifications of drugs or drug-nanoparticles?, Drug Discovery Today, 13 (2008) 1099–1106. [DOI] [PubMed] [Google Scholar]
- [6].Patel MM, Goyal BR, Bhadada SV, Bhatt JS, Amin AF, Getting into the brain, CNS Drugs, 23 (2009) 35–58. [DOI] [PubMed] [Google Scholar]
- [7].Kabanov AV, Batrakova EV, Polymer nanomaterials for drug delivery across the blood brain barrier Neuroimmune Pharmacology, Springer, 2017, pp. 847–868. [Google Scholar]
- [8].Lockman PR, Mumper RJ, Khan MA, Allen DD, Nanoparticle technology for drug delivery across the blood-brain barrier, Drug Development and Industrial Pharmacy, 28 (2002) 1–13. [DOI] [PubMed] [Google Scholar]
- [9].Shen Y, Cao B, Snyder NR, Woeppel KM, Eles JR, Cui XT, ROS responsive resveratrol delivery from LDLR peptide conjugated PLA-coated mesoporous silica nanoparticles across the blood-brain barrier, Journal of Nanobiotechnology, 16 (2018) Article 13. [DOI] [PMC free article] [PubMed] [Google Scholar]
- [10].Song Y, Du D, Li L, Xu J, Dutta P, Lin YH, In vitro study of receptor-mediated silica nanoparticles delivery across blood-brain barrier, ACS Applied Materials & Interfaces, 9 (2017) 20410–20416. [DOI] [PMC free article] [PubMed] [Google Scholar]
- [11].Lin HC, Ho MY, Tsen CM, Huang CC, Wu CC, Huang YJ, Hsiao IL, Chuang CY, From the cover: comparative proteomics reveals silver nanoparticles alter fatty acid metabolism and amyloid beta clearance for neuronal apoptosis in a triple cell coculture model of the blood-brain barrier, Toxicological Sciences, 158 (2017) 151–163. [DOI] [PubMed] [Google Scholar]
- [12].Ivask A, Pilkington EH, Blin T, Kakinen A, Vija H, Visnapuu M, Quinn JF, Whittaker MR, Qiao RR, Davis TP, Ke PC, Voelcker NH, Uptake and transcytosis of functionalized superparamagnetic iron oxide nanoparticles in an in vitro blood brain barrier model, Biomaterials Science, 6 (2018) 314–323. [DOI] [PubMed] [Google Scholar]
- [13].Betzer O, Shilo M, Opochinsky R, Barnoy E, Motiei M, Okun E, Yadid G, Popovtzer R, The effect of nanoparticle size on the ability to cross the blood-brain barrier: an in vivo study, Nanomedicine, 12 (2017) 1533–1546. [DOI] [PubMed] [Google Scholar]
- [14].Chan JM, Valencia PM, Zhang L, Langer R, Farokhzad OC, Polymeric nanoparticles for drug delivery, Cancer Nanotechnology, Springer, 2010, pp. 163–175. [DOI] [PubMed] [Google Scholar]
- [15].Hinow P, Radunskaya A, Mackay SM, Reynolds JNJ, Schroeder M, Tan EW, Tucker IG, Signaled drug delivery and transport across the blood-brain barrier, Journal of Liposome Research, 26 (2016)233–245. [DOI] [PubMed] [Google Scholar]
- [16].Loeser VF, Modeling of Anticancer Drug Delivery By Temperature-Sensitive Liposomes, PhD Dissertation,The University of Wisconsin-Milwaukee, 2017. [Google Scholar]
- [17].Khan AI, Liu J, Dutta P, Iron transport kinetics through blood-brain barrier endothelial cells, Biochimica et Biophysica Acta (BBA)-General Subjects, 1862 (2018) 1168–1179. [DOI] [PMC free article] [PubMed] [Google Scholar]
- [18].Ritchie RJ, Prvan T, Current statistical methods for estimating the Km and Vmax of Michaelis-Menten kinetics, Biochemical Education, 24 (1996) 196–206. [Google Scholar]
- [19].Putter H, Heisterkamp SH, Lange JMA, de Wolf F, A Bayesian approach to parameter estimation in HIV dynamical models, Statistics in Medicine, 21 (2002) 2199–2214. [DOI] [PubMed] [Google Scholar]
- [20].Michalik C, Chachuat B, Marquardt W, Incremental global parameter estimation in dynamical systems, Industrial & Engineering Chemistry Research, 48 (2009) 5489–5497. [Google Scholar]
- [21].Dua V, An Artificial Neural Network approximation based decomposition approach for parameter estimation of system of ordinary differential equations, Computers & Chemical Engineering, 35 (2011) 545–553. [Google Scholar]
- [22].Strebel O, A preprocessing method for parameter estimation in ordinary differential equations, Chaos Solitons & Fractals, 57 (2013) 93–104. [Google Scholar]
- [23].Bezruchko BP, Smirnov DA, Sysoev IV, Identification of chaotic systems with hidden variables (modified Bock's algorithm), Chaos Solitons & Fractals, 29 (2006) 82–90. [Google Scholar]
- [24].Dua V, A mixed-integer programming approach for optimal configuration of artificial neural networks, Chemical Engineering Research & Design, 88 (2010) 55–60. [Google Scholar]
- [25].Liu D, Lin BQ, Shao W, Zhu Z, Ji TH, Yang CY, In vitro and in vivo studies on the transport of PEGylated silica nanoparticles across the blood-brain barrier, ACS Applied Materials & Interfaces, 6 (2014) 2131–2136. [DOI] [PubMed] [Google Scholar]
- [26].Sonavane G, Tomoda K, Makino K, Biodistribution of colloidal gold nanoparticles after intravenous administration: Effect of particle size, Colloids and Surfaces B-Biointerfaces, 66 (2008) 274–280. [DOI] [PubMed] [Google Scholar]
- [27].Predescu SA, Predescu DN, Shimizu K, Klein IK, Malik AB, Cholesterol-dependent syntaxin-4 and SNAP-23 clustering regulates caveolar fusion with the endothelial plasma membrane, Journal of Biological Chemistry, 280 (2005) 37130–37138. [DOI] [PubMed] [Google Scholar]
- [28].Zhu QY, Yamakuchi M, Lowenstein CJ, SNAP23 regulates endothelial exocytosis of von Willebrand factor, PLOS One, 10 (2015) e0118737. [DOI] [PMC free article] [PubMed] [Google Scholar]
- [29].Descamps L, Dehouck M-P, Torpier G, Cecchelli R, Receptor-mediated transcytosis of transferrin through blood-brain barrier endothelial cells, American Journal of Physiology-Heart and Circulatory Physiology, 270 (1996) H1149–H1158. [DOI] [PubMed] [Google Scholar]
- [30].Baughman DR, Liu YA, Neural networks in bioprocessing and chemical engineering, Academic Press, San Diego, CA: (2014). [Google Scholar]
- [31].Vaidyanathan R, Process fault detection and diagnosis using neural networks, PhD Dissertation, Purdue University; (1991). [Google Scholar]
- [32].Yuan W, Li GL, Fu BM, Effect of surface charge of immortalized mouse cerebral endothelial cell monolayer on transport of charged solutes, Annals of Biomedical Engineering, 38 (2010) 1463–1472. [DOI] [PubMed] [Google Scholar]
- [33].Brown RC, Morris AP, O'Neil RG, Tight junction protein expression and barrier properties of immortalized mouse brain microvessel endothelial cells, Brain Research, 1130 (2007) 17–30. [DOI] [PMC free article] [PubMed] [Google Scholar]
- [34].Wong A, Ye M, Levy A, Rothstein J, Bergles D, Searson PC, The blood-brain barrier: an engineering perspective, Frontiers in Neuroengineering, 6 (2013) Article 7. [DOI] [PMC free article] [PubMed] [Google Scholar]
- [35].Gao HL, Qian J, Cao SJ, Yang Z, Pang ZQ, Pan SQ, Fan L, Xi ZJ, Jiang XG, Zhang QZ, Precise glioma targeting of and penetration by aptamer and peptide dual-functioned nanoparticles, Biomaterials, 33 (2012) 5115–5123. [DOI] [PubMed] [Google Scholar]
- [36].Sharma G, Modgil A, Zhong TC, Sun CW, Singh J, Influence of short-chain cell-penetrating peptides on transport of doxorubicin encapsulating receptor-targeted liposomes across brain endothelial barrier, Pharmaceutical Research, 31 (2014) 1194–1209. [DOI] [PubMed] [Google Scholar]
- [37].Huang CC, Yang Z, Lee KH, Chang HT, Synthesis of highly fluorescent gold nanoparticles for sensing mercury (II), Angewandte Chemie, 119 (2007) 6948–6952. [DOI] [PubMed] [Google Scholar]
- [38].Johnsen KB, Burkhart A, Melander F, Kempen PJ, Vejlebo JB, Siupka P, Nielsen MS, Andresen TL, Moos T, Targeting transferrin receptors at the blood-brain barrier improves the uptake of immunoliposomes and subsequent cargo transport into the brain parenchyma, Scientific Reports, 7 (2017)10396. [DOI] [PMC free article] [PubMed] [Google Scholar]
- [39].Johnsen KB, Bak M, Kempen PJ, Melander F, Burkhart A, Thomsen MS, Nielsen MS, Moos T, Andresen TL, Antibody affinity and valency impact brain uptake of transferrin receptor-targeted gold nanoparticles, Theranostics, 8 (2018) 3416–3436. [DOI] [PMC free article] [PubMed] [Google Scholar]
- [40].Li GL, Simon MJ, Cancel LM, Shi ZD, Ji XY, Tarbell JM, Morrison B, Fu BM, Permeability of Endothelial and Astrocyte Cocultures: In vitro blood-brain barrier models for drug delivery studies, Annals of Biomedical Engineering, 38 (2010) 2499–2511. [DOI] [PMC free article] [PubMed] [Google Scholar]
- [41].Qiao RR, Jia QJ, Huwel S, Xia R, Liu T, Gao FB, Galla HJ, Gao MY, Receptor-mediated delivery of magnetic nanoparticles across the blood-brain barrier, ACS Nano, 6 (2012) 3304–3310. [DOI] [PubMed] [Google Scholar]
- [42].Raub TJ, Newton CR, Recycling kinetics and transcytosis of transferrin in primary cultures of bovine brain microvessel endothelial cells, Journal of Cellular Physiology, 149 (1991) 141–151. [DOI] [PubMed] [Google Scholar]
- [43].Chapra SC, Canale RP, Numerical Methods for Engineers, McGraw Hill, New York, (1998). [Google Scholar]
- [44].Burden RL, Faires JD, Numerical Analysis. 2001, Brooks/Cole, Boston, USA, (2001). [Google Scholar]
- [45].Mayle KM, Le AM, Kamei DT, The intracellular trafficking pathway of transferrin, Biochimica et Biophysica Acta (BBA)-General Subjects, 1820 (2012) 264–281. [DOI] [PMC free article] [PubMed] [Google Scholar]
- [46].Ciechanover A, Schwartz A, Dautry-Varsat A, Lodish H, Kinetics of internalization and recycling of transferrin and the transferrin receptor in a human hepatoma cell line. Effect of lysosomotropic agents, Journal of Biological Chemistry, 258 (1983) 9681–9689. [PubMed] [Google Scholar]


