

Abstract
Abnormalities in synaptic plasticity are argued to underlie the neural dysconnectivity observed in schizophrenia. One way to measure synaptic plasticity is through sensory adaptation, whereby sensory neurons exhibit reduced sensitivity after sustained stimulus exposure. Evidence for decreased adaptation in individuals with schizophrenia is currently inconclusive, possibly due to heterogeneity in clinical and medication status across samples. Here we circumvent these confounds by examining whether altered adaptation is represented sub-clinically in the general population. To test this we used three paradigms from visual perception research that provide a precise and non-invasive index of adaptation in the visual system. Two paradigms involve a class of illusory percepts termed visual aftereffects. The third relies on a visual phenomenon termed binocular rivalry, where incompatible stimuli are presented to the two eyes and observers alternate between perceiving exclusively one stimulus or a combination of the two (i.e. mixed perception). We analyzed the strength and dynamics of visual adaptation in these paradigms, in relation to schizotypy. Our results showed that increased schizotypal traits were related to reduced orientation, but not luminance, aftereffect strength (Exp. 1). Further, increased schizotypy was related to a greater proportion of mixed perception during binocular rivalry (Exp. 1 and 2). Given that visual adaption is well understood at cellular and computational levels, our data suggest that short-term plasticity in the visual system can provide important information about the disease mechanisms of schizophrenia.
Keywords: Schizotypy, Visual adaptation, Plasticity, Binocular rivalry, Aftereffects
1. Introduction
Schizophrenia has long been conceptualized as a disorder of brain connectivity (Wernicke, 1906; Bleuler, 1911). Early theories have received empirical support in more recent years from a wealth of functional neuroimaging and electrophysiology data (Narr and Leaver, 2015; Uhlhaas, 2013), which indicate dysfunctional communication across brain regions in individuals with schizophrenia. Direct and indirect evidence from genetics, cellular microstructure, pharmacology, and electrophysiology suggest that one cause of this functional dysconnectivity in schizophrenia is an impairment in synaptic plasticity, i.e. in experience-dependent changes in synaptic strength (reviewed in Stephan et al., 2006). More specifically, given the important role of NMDA receptors for plasticity at glutamatergic receptors and robust evidence for NMDA receptor dysfunction in schizophrenia, a particular role of neuromodulatory effects on NMDA-dependent synaptic plasticity has been posited (reviewed in Stephan et al., 2006; Stephan et al., 2009).
Synaptic plasticity can occur on multiple timescales, with synaptic strength changing at a rate ranging from tens of milliseconds to several minutes (short-term synaptic plasticity; Zucker and Regehr, 2002) or on the order of hours, days, or years (long-term plasticity; Malenka and Nicoll, 1999). While long-term plasticity involves structural and enduring synaptic changes (reviewed in Feldman, 2009), short-term plasticity involves rapid changes in post-synaptic responses without requiring any structural synaptic changes (reviewed in Zucker and Regehr, 2002). In support of the notion that synaptic plasticity is affected in schizophrenia, functions that rely on both long-term and short-term synaptic plasticity are impaired in the disease (reviewed in Goto et al., 2010; Stephan et al., 2006). In particular, abnormalities in perceptual learning, subserved by short-term plasticity, have been linked to hallucinations in schizophrenia, such that an abnormality in integrating sensory information with prior expectations gives rise to these illusory sensory experiences (Powers et al., 2017).
One functional manifestation of short-term neural plasticity is sensory adaptation, which refers to the transient reduction in sensitivity of neurons tuned to particular qualities of a stimulus for which an observer is exposed for a sustained period (Wark et al., 2007). Naturally, sensory adaptation at the neuronal level manifests in changes in perception, which is thus sculpted by a combination of current input and prior exposure. Although sensory adaptation is ubiquitous across modalities, the most rigorous investigation of sensory adaptation has come from the visual domain (reviewed in Clifford et al., 2007; Kohn, 2007). There are well-established methods of quantifying the magnitude of sensory adaptation at the perceptual level (Hiris and Blake, 1992; Kelly and Martinez-Uriegas, 1993) and clear indications as to how these perceptual phenomena may map onto neural sensitivity changes (Anstis et al., 1998; Blakemore and Campbell, 1969). In sum, perceptual manifestations of visual adaptation, which can be measured easily and non-invasively, provide a uniquely precise window into the dynamics of short-term neuronal plasticity. In addition, first-person accounts from individuals on the schizophrenia spectrum have revealed subjective alterations in visual perception (e.g. Freedman and Chapman, 1973). Thus, altered visual adaptation, along with providing insights into disease mechanisms, may also shed light on clinical phenomenology.
Visual adaption is typically measured non-invasively using what are known as visual aftereffects. These are illusory perceptions that follow a constant visual stimulus. For example, in the motion aftereffect, after fixating a moving adapter stimulus for a period of time, a stationary stimulus will appear to move in the direction opposite to that of the adapter (Anstis et al., 1998). Analogous aftereffects are found for luminance, orientation, and color, among other features (reviewed in Thompson and Burr, 2009; see Fig. 1A and B for a schematic of the perceptual phenomena). Importantly, primate neurophysiology work has provided insights into where neurons are adapting for various types of aftereffect to occur. For example, neurons that adapt to luminance are primarily in the retina and subcortical regions, such as the lateral geniculate nucleus of the thalamus (Craik, 1940; Li et al., 2017; Zaidi, 2012). On the other hand, orientation and motion adaptation are driven by adaptation of neurons in cortical regions of the visual processing hierarchy (Clifford et al., 2000; Wenderoth and Johnstone, 1987)—primary visual cortex and area MT, respectively. See Fig. 1C for a schematic of visual adaptation (orientation adaptation, in this example) at the level of a single neuron. A handful of early studies measuring the duration or strength of these aftereffects in patients with schizophrenia (reviewed in Harris, 1994), have yielded conflicting findings. These include slower aftereffect build-up (Abraham and McCallum, 1973; Claridge, 1960; Herrington and Claridge, 1965), no difference in aftereffect duration (Tress and Kugler, 1979), and reduced aftereffect strength (Kelm, 1962, 1968; Wertheimer, 1954; Wertheimer and Jackson, 1957). Discrepant findings across studies have been attributed to a combination of medication use, as antipsychotics reduce visual aftereffect duration in healthy individuals (Harris et al., 1986; Harris et al., 1983), clinical status, and mode of measuring aftereffects (Harris, 1994). A more recent study confirmed slower aftereffect onset in patients with schizophrenia and healthy first-degree relatives, an effect that scaled with positive symptoms in the patient group and the positive dimension of a scale of schizophrenia-like personality traits in the healthy relatives (Surguladze et al., 2012).
Fig. 1.
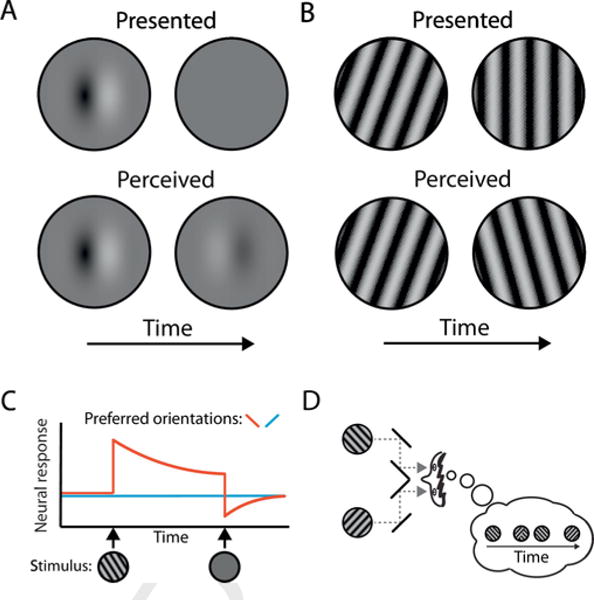
Schematic depictions of negative afterimages (A) and the tilt aftereffect (B), perceptual manifestations of luminance adaptation and orientation adaptation, respectively, how single neurons implement these perceptual phenomena (C), and binocular rivalry (D). A. If an observer views a blank screen following prolonged viewing of a static pattern (top row), the observer may perceive a ‘photo negative’ of the static pattern in place of the blank screen (bottom row). This illusory percept is called a negative afterimage. B. If an observer views pattern of perfectly vertical gratings following prolonged viewing of a tilted pattern (top row), the observer may perceive the vertical pattern as tilted in the direction opposite to the initial pattern (bottom row). This perception of illusory tilt is called a tilt aftereffect. C. The response of a neuron that responds preferentially to leftward orientations is depicted in red, and the response to a neuron that responds preferentially to rightward orientations is depicted in blue. Stimulus presentation is depicted on the x-axis. Upon presentation of a leftward orientation grating, the neuron with a preferred leftward direction begins to respond vigorously, but soon begins to adapt with repeated presentation of this stimulus (i.e. neural firing is attenuated). Upon the offset of this leftward grating and onset of a blank screen, the neuron returns to a below-baseline level of firing. The neuron with a rightward orientation preference remains at baseline, thus resulting in an increase in firing rate of the neuron with a rightward orientation preference relative to the neuron with a leftward orientation preference and giving rise to the perceptual phenomenon of a rightward bias in the perception of stimulus orientation (i.e. aftereffect). Adaptation is illustrated using orientation as an example here, but it transpires in an analogous fashion with other stimulus properties. D. If two incompatible images are shown at the same location of visual space, but each to a different eye, in this case using a configuration of mirrors, observers alternately perceive either of the two images and occasionally also a mixture of the two. The observer’s perception in this schematic is illustrated in the thought bubble. Perceptual switches between the two views are often theorized to come about, at least in part, as a result of adaptation of neurons that represent the currently perceived image. (For interpretation of the references to color in this figure legend, the reader is referred to the web version of this article.)
Another perceptual phenomenon thought to rely on sensory adaptation is binocular rivalry. During binocular rivalry, different visual stimuli are presented simultaneously to each eye, and subjective perception alternates between what is presented to the left eye and right eye and, less commonly, a mix of these two stimuli (see Fig. 1D for a schematic of the perceptual phenomenon). According to a prominent theory of the mechanisms behind this perceptual cycle, two groups of neurons, each encoding the stimulus properties from one eye, engage in a mutually inhibitory relationship (Alais et al., 2010; Brascamp et al., 2017; Wilson, 2007). More importantly in the present context, the theory holds that neurons encoding the currently perceived stimulus, or dominant stimulus, adapt. Adaptation thus renders those neurons more susceptible to inhibition by the currently suppressed stimulus and causes a switch in perception and a continuation of the cycle. Individual differences in the dynamics of these perceptual alternations should thus speak meaningfully to individual differences in sensory adaptation. Although the one published study on binocular rivalry in individuals with schizophrenia reports no difference in these dynamics (Miller et al., 2003), the relatively small sample size should be taken into consideration.
In the current study, we related the strength and dynamics of visual adaptation to the degree of schizotypy in a non-clinical sample. Schizotypy refers to those traits that are related to the spectrum of schizophrenia-like personality traits and may reflect latent illness vulnerability (Lenzenweger, 2006). While there is debate about the precise relationship between schizotypy and clinical syndromes (Claridge and Beech, 1995), there is considerable support for the notion that investigating how the integrity of cognitive and perceptual processes scales with the extent of schizotypal traits provides a complementary approach to studying the illness directly. This approach allows for the study of fundamental features of illness liability that is free of confounds related to studying individuals diagnosed with schizophrenia spectrum disorders, which include general cognitive deterioration that may preclude an understanding of task demands, medication, and the psychosocial effects of having a severe mental illness.
To investigate visual adaptation, we measured the strength of visual aftereffects and the dynamics of binocular rivalry. We included measures of visual aftereffects as these are arguably the clearest demonstration of sensory adaptation in the visual system. More specifically, we measured both adaptation to luminance and adaptation to orientation, as neural adaptation giving rise to these two phenomena is occurring at two different levels of the visual processing stream. Luminance adaptation is caused by neural adaptation at the level of the retina and subcortical regions, whereas orientation adaptation is primarily a cortical phenomenon. Thus, different relationships between schizotypal traits and the strength of these two types of aftereffects may provide insight into where putatively disturbed neural adaptation is occurring in the brain as it relates to psychopathology. Although it is less clear at what level of the visual processing hierarchy neurons are adapting to give rise to perceptual alterations during binocular rivalry than it is for visual aftereffects, there is an advantage in including measures of binocular rivalry from a psychometric perspective. Namely, there is fairly extensive research on individual differences in binocular rivalry dynamics (e.g. Antinori et al., 2016; Bosten et al., 2015; Miller et al., 2010), providing precedence for adopting such an approach in the current study. It was not clear at the outset of the study that the variability in aftereffect strength would also be amenable to an individual differences approach.
We hypothesized that schizotypal traits would be related to reduced adaptation as indexed by reduced strength of visual aftereffects and alterations in the dynamics of binocular rivalry, which were measured in Experiment 1. Indeed, a previous study revealed a relationship between the cognitive disorganization scale of a schizotypy measure and reduced frequency of perceptual switches during binocular rivalry (Antinori et al., 2016). We additionally present data partially replicating the findings from the first experiment in Experiment 2, in a new analysis of previously published data (Antinori et al., 2016). Together the findings reported here have the potential to shed light on how putative short-term plasticity impairments in the visual system scale with the extent of schizophrenia-like traits.
2. Experiment 1
2.1. Methods
2.1.1. Participants
131 participants (100 females) were recruited from the Psychology Subject Pool at Michigan State University. Age was measured categorically. 103 individuals were between 18 and 20 years old, 22 individuals were 21–25, 3 individuals were 26–30, 2 individuals were 31–35, and 1 individual was older than 35. The study protocol was approved by the Michigan State University Institutional Review Board, and written informed consent was obtained from all subjects prior to testing. Subjects fulfilled course requirements through their participation.
2.1.2. Schizotypal personality questionnaire
The Schizotypal Personality Questionnaire (SPQ; Raine, 1991) is a 74-item dichotomous response (yes/no) self-report measure with nine subscales that reflect the nine syndromes of schizotypal personality disorder listed in DSM-III-R (American Psychological Association, 1987). The SPQ can be sub-divided into three syndromes or factors: Cognitive-Perceptual (consisting of ideas of reference, magical thinking, unusual perceptual experiences, and paranoid ideation items), Interpersonal (consisting of social anxiety, no close friends, blunted affect, and paranoid ideation items), and Disorganization (consisting of odd behavior and odd speech items). Positive symptoms of schizophrenia map onto the Cognitive-Perceptual factor, negative symptoms map onto the Interpersonal factor, and disorganized symptoms map onto the Disorganization factor.
2.1.3. Experimental paradigms
Participants completed four behavioral tasks to obtain indices of plasticity in the visual system. We had three tests of visual adaptation: luminance adaptation, tilt adaptation, and motion adaptation. Because the motion adaptation paradigm yielded data with low reliability, precluding any meaningful interpretation of a relationship between performance and personality measures, this paradigm is described in Supplemental methods only. As a further measure of visual plasticity, we used binocular rivalry.
2.1.3.1. Luminance adaptation
After viewing a stationary pattern for some time, replacing that pattern with a blank field can result in the illusory perception of the pattern’s ‘photo negative’ in the retinal location previously exposed to the pattern. Such illusory percepts—referred to as negative afterimages (Fig. 1A)—result from adaptation of retinal receptors as well as neurons further along the visual processing hierarchy during exposure to the initial pattern (Anstis et al., 1978; Brindley, 1962; Craik, 1940; Sakitt, 1976; Shimojo et al., 2001; Virsu and Laurinen, 1977).
The luminance adaptation task is presented in Fig. 2A, and full paradigm details regarding the are presented in the Supplemental methods. Briefly, on each trial the subject was presented with a blurry disk consisting of bright half and a dark half for 1.5s—the adapter stimulus. Were this adapter stimulus followed by a blank screen, the subject would perceive a similarly blurry patch that appears bright where the adapter was dark and vice versa. To measure the strength of this negative afterimage, we used a so-called nulling method. Here a “nuller” stimulus pattern that is a ‘photo negative’ of the afterimage (or, in other words, a low-contrast version of the original adapting pattern itself) is presented for 0.5s immediately following the adapter stimulus. The idea is to vary the strength (luminance contrast) of this nuller across repetitions, while asking the participant what they perceive, to find that strength at which the afterimage is perfectly canceled out by the nuller. In our case, subjects were asked to indicate which side of the second (i.e. nuller) stimulus appeared brighter. The interpretation of their response is as follows. If the nuller is so strong that it overpowers the afterimage, then the observer typically responds seeing a pattern of light and dark that matches the nuller image itself. Alternatively, if the nuller is too weak to counteract the afterimage then the observer will see a pattern of opposite contrast polarity, matching the afterimage. The goal of the nulling procedure is to vary nuller strength across repetitions, to find the strength at which the subject provides either response equally often (because there is a close balance between nuller and afterimage). This nuller strength would then be taken as an index of the strength of the afterimage (Brascamp et al., 2010; Georgeson and Turner, 1985; Kelly and Martinez-Uriegas, 1993; Leguire and Blake, 1982). In practice, this is achieved by finding the 50% point on the psychometric curve fit to response data plotted against nuller strength. A third image, a checker pattern meant to mask any lingering afterimage, followed the nuller image in our paradigm and remained on screen until response. The next adapter stimulus then appeared following a 3-second inter-trial interval. Participants were instructed to fixate their gaze at the center of the display throughout each trial.
Fig. 2.
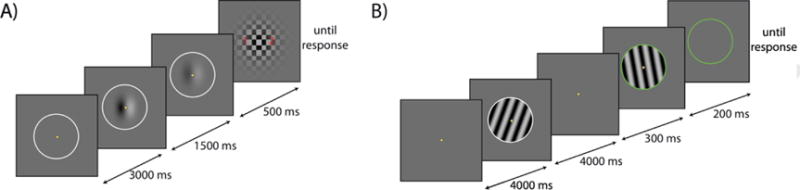
Task figures of the luminance (A) and orientation (B) adaptation paradigms. A. Following a 3000ms inter-trial interval, subjects were presented with the adapter stimulus for 1500ms, followed immediately by a 500ms presentation of the nuller stimulus. A third image, a checker pattern meant to mask any lingering afterimage, followed the nuller image and remained on screen until the subject responded with which area of the screen the light part of the nuller stimulus was located using a keypress. Note that this depiction of the nuller is a simplified but conceptually identical version of the current paradigm, which is described in detail in the Supplemental methods. Participants were instructed to fixate their gaze at the center of the display throughout the experiment. B. Following a 4000ms inter-trial interval, subjects were presented with the adapter stimulus for 4000ms. After a 300ms break, the nuller stimulus was presented for 200ms. The nuller stimulus was additionally distinguished from the adapter stimulus by a change in color of the stimulus outline (white to green). This stimulus outline remained on the screen until subjects responded on the orientation of the nuller stimulus (leftward or rightward) using a keypress. (For interpretation of the references to color in this figure legend, the reader is referred to the web version of this article.)
In our pilot testing, we found that some subjects were erroneously reporting on the adapter stimulus (which is easier to distinguish), rather than the nuller stimulus. In order to circumvent the possibility for such an error, we slightly modified the conventional nulling method described above. This modified method remains identical in rationale and interpretation, and the Supplemental methods provides its details.
There were 6 possible nuller strengths, each of which was presented 12 times, resulting in 72 total trials that were equally distributed across 3 sessions. After each sequence of 20 such trials observers were allowed a self-timed break.
2.1.3.2. Orientation adaptation
After viewing a slightly tilted grating pattern for some time, a second grating pattern with a perfectly vertical orientation typically appears to be tilted in the direction away from that of the first pattern (Fig. 1B). This so-called tilt aftereffect (Clifford et al., 2000; Gibson and Radner, 1937; Schwartz et al., 2007; Wenderoth and Johnstone, 1987) is thought to arise from adaptation of orientation-selective processes within early visual cortex.
The tilt adaptation task is presented in Fig. 2B, and full paradigm details are presented in Supplemental methods. Briefly, on each trial the subject was presented with a flashing grating tilted at 20° from vertical, presented for 4s—the adapter stimulus. Analogous to the method described above, the strength of a participant’s tilt aftereffect was quantified using a nulling procedure. In this case, the nuller was a second grating tilted to differing degrees from trial to trial. Participants were asked to indicate whether this second (i.e. nuller) grating appeared tilted leftward or rightward. The strength of the aftereffect was then quantified as the amount of physical tilt away from vertical that is required to reach a subjective sense of vertical, again corresponding to the 50% point of the psychometric curve of response data against nuller strength (tilt, in this case). Our nuller stimulus lasted 0.2s and was separated from the adapter stimulus by a 0.3s blank After the participant responded, the next adapter stimulus appeared 4s later, thus allowing some time for previously accumulated adaptation to decay.
In an attempt to distinguish perceptual aftereffects from potential cognitive response biases associated with having seen a tilted adapting stimulus, the trials described above were interleaved with trials we refer to as baseline trials. These trials were essentially the same as normal trials, but the adapter stimulus was tilted at a much steeper angle (65° from vertical). Adaptation at such a steep angle typically has little influence on the perception of near-vertical orientations (Clifford, 2002; Schwartz et al., 2007) so any systematic tendency to report vertical nuller stimuli as tilted during these baseline trials could suggest a cognitive response bias. Accordingly, one of our dependent variables is the difference in aftereffect between the normal trials and the baseline trials; a measure we term relative adaptation strength.
There were 6 possible nuller orientations for both normal trials and baseline trials, each of which was presented 9 times, resulting in 108 total trials that were distributed across 3 separate sessions, and with a self-paced break every 9 trials.
2.1.3.3. Binocular rivalry
Binocular rivalry occurs when two incompatible images are shown at the same location of visual space, but each to a different eye (Blake and Logothetis, 2002). The interocular conflict engendered by this configuration results in an unstable perceptual experience, where the participant alternately perceives either of the two images, and occasionally also a mixture of the two, even though both are continuously present. Perceptual switches between the two views are often theorized to come about, at least in part, as a result of adaptation of neurons that represent the currently perceived image (Alais et al., 2010; Wilson, 2007).
Full details regarding the binocular rivalry paradigm are presented in Supplemental methods. Participants were seated in front of a mirror setup (Brascamp and Naber, 2017) that allowed each eye to view a separate computer monitor. A tilted grating was shown on each of these monitors. Grating orientation (−45°. or 45°. from vertical) and color (red or green) differed between eyes, thus resulting in interocular conflict. Participants were instructed to fixate their gaze at a central location and to indicate with a different key press the onset of each red percept, green percept, or mixed percept in which both colors were seen. Stimuli were presented for a total of 12 trials of 45s each, divided into two sessions.
2.1.4. Testing procedure
For the experimental tasks, a chinrest was used to stabilize head position. Task order was counterbalanced across subjects. The visual plasticity paradigms described above were couched in a larger battery of cognitive and perceptual tasks. Testing took place over the course of 3 one-hour sessions. Each of the three adaptation paradigms was completed on a different day. Participants were instructed to fixate their gaze at the center of the display throughout each trial of each experiment.
2.1.5. Data analysis
2.1.5.1. Experimental tasks
For both luminance adaptation and tilt adaptation, we calculated for each participant and for each nuller strength the proportion of trials on which the observer reported perception that was consistent with the nuller (i.e. the proportion of trials where the nuller outweighed the aftereffect). For each participant the relation between this proportion and nuller strength was fitted with a cumulative Gaussian function with three free parameters: mean, standard deviation and ‘lapse rate’. This latter parameter indicates the proportion of trials where the observer makes a response error regardless of the clarity of their perception, so only if this lapse rate is 0 does the function cover the full range between proportions of 0 and 1; otherwise its vertical range is scaled down. The fitted mean parameter served as our estimate of aftereffect strength, as it corresponds to the nuller strength that yields a 50/50 balance between both response options. For tilt adaptation, we subtracted these mean values between the normal trials and the baseline trials (see Experimental paradigms) to obtain the measure we term relative adaptation strength.
To ensure data quality across this population of untrained observers, we applied several data exclusion criteria. In particular, data were discarded if a fitted curve’s standard deviation was very large (above 0.35 for afterimages; above 3.5° for tilt aftereffects), indicating a weak response to the independent variable; if fit quality was poor (a sum of squared errors above 0.2), indicating a large degree of randomness in the data; and if the fitted 50/50 point fell far outside of the range of nuller strengths we applied, precluding an accurate estimate. The total number of participant data sets discarded for these reasons was 5 for luminance adaptation and 15 for orientation adaptation. In addition, several participants in our battery did not provide a complete data set for either luminance adaptation (13) or orientation adaptation (13). This could be because they could not perform the task or because they did not show up for the corresponding session.
Our dependent variables for binocular rivalry were the average duration of an exclusive percept (corresponding to either eye’s image rather than a mixture of both), which is an index of perceptual switch frequency, as well as the proportion of the time during which a mixture of the two images was perceived. We analyzed all key presses indicating the start of an exclusive percept and those indicating the start of a mixed percept, but removed all repeated presses of the same key, using only the first key press in such a sequence. We computed average percept duration as the average time interval between a key press indicating an exclusive percept and a key press indicating the start of the next percept (including mixed percepts). Because the across-observer distribution of resulting average durations was right-skewed, we took the natural logarithm before performing further analyses. We computed the proportion mixed perception by adding up all the intervals between the start and end of a mixed percept and dividing by the total time during which any percept was reported.
There were again several data exclusion criteria. Data from 4 participants were excluded because of a strong bias for one eye or one color (perceiving one of the percepts >3 times as long, across the total experiment, as the alternative percept). For the percept duration measure, but not the mixed perception measure, data from another 3 participants were excluded due to a strong tendency to see mixtures (>40% of the viewing time). A further 2 participants were excluded because they pressed no keys, or only incidentally pressed a key, indicating either non-compliance or no perception of the cycle that normally characterizes binocular rivalry. A final 14 participants did not provide a complete data set for binocular rivalry, typically because they could not perform the task or because they did not show up for the corresponding session.
2.1.5.2. Statistical analyses
As many of our variables were non-normally distributed (Shapiro-Wilk tests p<0.05), Spearman’s rank-order correlation coefficients were used to examine the association between schizotypy scores and measures of visual plasticity. To compare correlations between schizotypy scores and measures of visual plasticity, correlation coefficients were converted to z-scores using Fisher’s r-to-z transformation, and the asymptotic covariance of the estimates were used in an asymptotic z-tests (Steiger, 1980). Since all correlations were planned, we report uncorrected p-values as well as p-values that are corrected for multiple comparisons using the procedure outlined in Benjamini and Hochberg (Benjamini and Hochberg, 1995). Finally, despite non-parametric correlation coefficients being fairly robust to the effect of outliers, we also calculated Spearman’s rank-order correlation coefficients between schizotypy scores and visual plasticity measures after excluding values outside of a 99% density ellipse.
2.2. Results
Descriptive statistics for the SPQ are presented in Table 1, and distributions of SPQ scores are presented in Supplemental Fig. 2. Visual plasticity task measures are presented in Table 2. Correlation coefficients for the relationships between schizotypy and visual plasticity measures and their associated significance values are presented in Table 3. Correlations marked with an asterisk were significant at the p<0.05 level after correcting for multiple comparisons. Correlation coefficients and their associated significance values after excluding outliers are presented in Supplemental Table 1.
Table 1.
Means and standard deviations (S.D.) for SPQ and OLIFE subscale and total scores.
| Mean | S.D. | |
|---|---|---|
| Experiment 1 | ||
| SPQ cognitive-perceptual | 8.82 | 5.84 |
| SPQ interpersonal | 9.71 | 6.73 |
| SPQ disorganized | 4.50 | 3.62 |
| SPQ total | 20.79 | 12.02 |
| Experiment 2 | ||
| OLIFE unusual experiences | 10.66 | 5.73 |
| OLIFE introvertive anhedonia | 5.80 | 4.12 |
| OLIFE cognitive disorganization | 12.58 | 6.99 |
| OLIFE impulsive nonconformity | 10.01 | 4.05 |
Table 2.
Means and standard deviations (S.D.) for performance measures on the visual aftereffect and binocular rivalry tasks in Experiment 1.
| Mean | S.D. | |
|---|---|---|
| Orientation adaptation strength | ||
| Absolute (deg) | 1.97 | 0.81 |
| Baseline (deg) | −0.24 | 0.54 |
| Relative | 2.21 | 0.96 |
| Luminance adaptation strength (Michelson contrast) | 0.33 | 0.09 |
| Binocular rivalry | ||
| Mean percept duration (sec) | 3.60 | 1.02 |
| Mixture proportion | 0.16 | 0.10 |
Table 3.
Correlations between schizotypy and visual plasticity measures. Correlations marked with an asterisk are significant after correcting for multiple comparisons.
| SPQ total | SPQ cognitive-perceptual |
SPQ interpersonal |
SPQ disorganized |
|||||
|---|---|---|---|---|---|---|---|---|
|
| ||||||||
| ρ | p | ρ | p | ρ | p | ρ | p | |
| Orientation adaptation strength | ||||||||
| Relative | −0.28* | 0.005 | −0.29* | 0.005 | −0.16 | 0.12 | −0.24 | 0.02 |
| Absolute | −0.22 | 0.04 | −0.16 | 0.12 | −0.14 | 0.17 | −0.22 | 0.04 |
| Baseline | 0.15 | 0.15 | 0.29* | 0.004 | 0.07 | 0.53 | −0.005 | 0.96 |
| Luminance adaptation strength | 0.04 | 0.68 | 0.16 | 0.09 | −0.02 | 0.85 | −0.07 | 0.44 |
| Binocular rivalry | ||||||||
| Mean Percept duration | 0.15 | 0.15 | 0.19 | 0.06 | 0.08 | 0.40 | 0.05 | 0.65 |
| Mixture proportion | 0.20 | 0.04 | 0.17 | 0.08 | 0.21 | 0.03 | 0.11 | 0.29 |
2.2.1. Visual adaptation
2.2.1.1. Luminance adaptation
After data cleaning, 113 subjects were included in the analysis. Adaptation strength was greater than zero in all subjects. The strength of the negative afterimage was not significantly correlated with the total SPQ score (Fig. 3A) or any of the three factor scores. Excluding bivariate outliers did not change these results.
Fig. 3.
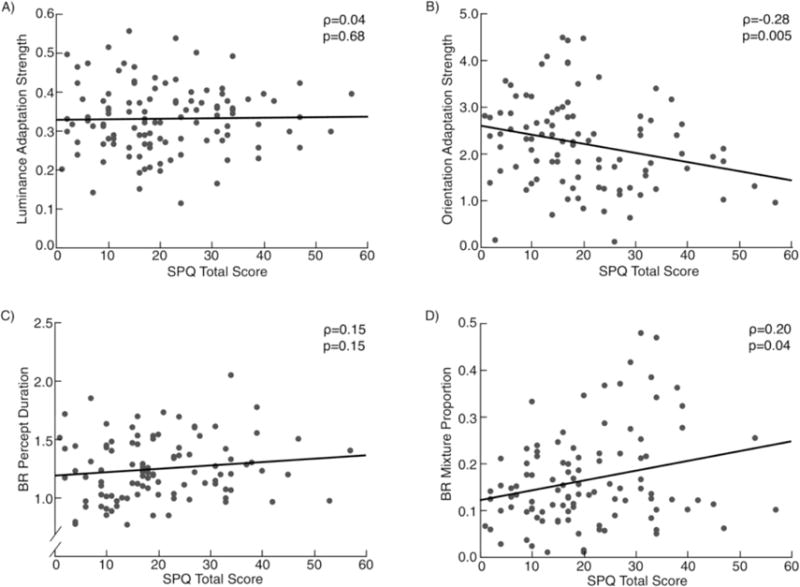
Scatterplots representing the relationship between SPQ Total scores and measures of visual adaptation in Experiment 1. BR, binocular rivalry.
2.2.1.2. Orientation adaptation
After data cleaning, 103 subjects were included in the analysis. Relative adaptation strength was significantly greater than zero in all subjects and was significantly negatively correlated with the total SPQ score (Fig. 3B), as well as the Cognitive-Perceptual and Disorganized factor scores. Higher schizotypal traits were associated with reduced relative adaptation strength. Since these correlations with the relative adaptation strength could be related to the strength of adaptation in the baseline condition, normal condition, or a combination thereof, we additionally calculated the correlation between SPQ scores and adaptation strength in each of the two conditions separately. Adaptation strength in the normal condition was correlated negatively with total SPQ score and score on the Disorganized factor. Adaptation strength in the baseline condition was associated positively with the Cognitive-Perceptual factor. That is, the correlation between positive schizotypy and relative adaptation strength is due largely to an association with stronger adaptation in the baseline condition, but also weaker, albeit non-significantly so, adaptation in the normal condition. Excluding bivariate outliers did not change these results.
2.2.1.3. Orientation versus luminance adaptation
After data cleaning, 88 subjects had usable data for both visual adaptation paradigms. The correlation between the SPQ total score and the strength of orientation adaptation was significantly greater than the correlation with luminance adaptation (z=1.98, p=0.048), which, in turn, did not differ from zero.
2.2.2. Binocular rivalry
After data cleaning, 111 subjects were included in the analysis of mixed percepts and 108 were included in the analysis of percept duration. In contrast to previous findings (Antinori et al., 2016), percept duration was not significantly correlated with the SPQ total score (Fig. 3C) or any of the factor scores. However, the proportion of mixed percepts was positively correlated with the total SPQ score (Fig. 3D) as well as the Interpersonal factor score. Higher schizotypy was associated with a greater likelihood of perceiving a mixture of the two images presented to both eyes. This correlation between total SPQ score and proportion of mixture percepts fell to just below statistical significance after excluding three bivariate outliers.
3. Experiment 2
3.1. Rationale
In an attempt to replicate the correlation between schizotypy and the proportion of mixed percepts, which was less robust than the correlation seen with the strength of visual aftereffects, we analyzed mixed percept data from a previously published study. This study found that the disorganization dimension of schizotypy, as measured using a different scale than that employed in Experiment 1, was associated with reduced frequency of perceptual switches during binocular rivalry (Antinori et al., 2016). In the current analysis, we assessed the relation between schizotypy and proportion of mixed percepts in that existing data set.
3.2. Methods
3.2.1. Participants
160 participants were recruited from the Psychology Subject Pool at the University of Melbourne. All participants had normal or corrected to normal vision. 39 participants were excluded prior to analysis: 28 because no instances of mixed percept were reported, 5 because they did not report alternating stimuli, indicating a failure to experience rivalry, 6 because they did not respond >50% of total duration of the trial (the design of this experiment, contrary to that of Experiment 1, required participants to keep a key pressed throughout a perceptual episode, thus allowing for this exclusion criterion; see below). The final sample included 121 participants (86 females; age: M=19.2, SD=2.5). Written informed consent was obtained from all subjects prior to testing. Subjects fulfilled course requirements through participation. The study protocol was approved by the University of Melbourne Human Research Ethics Committee, in accordance with the Declaration of Helsinki.
3.2.2. The Oxford-Liverpool inventory of feelings and experiences
Experiment 2 used the Oxford-Liverpool Inventory of Feelings and Experiences (O-LIFE; Mason et al., 1995). This questionnaire measures the multidimensional nature of schizotypy and was derived through factor analysis of a large data set of schizotypal measures (Claridge et al., 1996). The scale comprises 104 true/false items sub-divided into 4 factors: Unusual Experience capturing schizophrenia-like positive symptoms (e.g. perceptual aberrations, hallucinations, and magical thinking); Cognitive Disorganization capturing the disorganized thoughts and loose conceptual boundaries of schizophrenia; Introvertive Anhedonia capturing schizophrenia-like negative symptoms (e.g. a lack of enjoyment from social and physical stimulation), and Impulsive Non-Conformity reflecting impulsive and eccentric behaviors.
3.2.3. Binocular rivalry paradigm
The rival targets were stationary green and red gratings (each grating subtends a visual angle of 2°, with a spatial frequency of 4cpd) oriented ±45°. from vertical, with a circular frame. Stimuli were generated in Matlab, using the Psychophysics Toolbox extension (Brainard, 1997), displayed on an Apple mac computer monitor (23-in. monitor, 60Hz frame rate, 1280×800pixel resolution), and were viewed through a mirror stereoscope (viewing distance 33cm).
Participants were instructed to continuously report what they were experiencing by holding down computer keys. Exclusive dominance (time when only one rivalrous stimulus was perceived) was reported by pressing a single key, while any instances of mixed percept (time where the two stimuli appeared as a grid or patchwork combination of the two percepts) where reported by pressing two keys simultaneously. Prior to the experimental task, participants underwent a 60s training session to ensure they understood the instructions. Data were recorded in a single 120s trial.
3.2.4. Data analysis
3.2.4.1. Binocular rivalry task
The duration of mixed perception was calculated as the total duration that participants pressed both the left and right arrow keys simultaneously for at least 220ms (this threshold was chosen as a consequence of the response sampling rate and the desire to exclude the very brief periods of dual button response during transitions between left and right arrow presses). The calculated duration was expressed as a percentage of the trial duration.
3.2.4.2. Statistical analysis
As the proportion of mixed percept was non-normally distributed (Shapiro-Wilk tests p<0.001), Spearman’s rank-order correlation coefficients were used to examine the association between O-LIFE factors and mixed percept. Despite non-parametric correlation coefficients being fairly robust to the effect of outliers, we also calculated Spearman’s rank-order correlation coefficients between schizotypy scores and visual plasticity measures after excluding values outside of a 99% density ellipse.
3.3. Results
Descriptive statistics for the O-LIFE are presented in Table 1, and distributions of O-LIFE scores are presented in Supplemental Fig. 3. Across subjects, the percentage of time spent experiencing mixed percepts was 10.85% (s.d.=5.73%), and the average percept duration was 2.30s (s.d.=0.73s). A greater proportion of mixed percept was associated with higher scores on the Unusual Experience subscale (outliers included: ρ=0.19, p=0.04; 2 outliers excluded: ρ=0.20, p=0.03; Fig. 4A), while the opposite was observed with the Introvertive Anhedonia scale; a greater proportion of mixed percept was associated with a lower score on this scale (outliers included: ρ=−0.19, p=0.03; 3 outliers excluded: ρ=−0.21, p=0.02; Fig. 4B). There were no significant correlations observed between the proportion of mixed percepts and either the Cognitive Disorganization (outliers included: ρ=−0.06, p=0.50; 1 outlier excluded: ρ=−0.09, p=0.33) or Impulsive Non-conformity (outliers included: ρ=0.09, p=0.28; 1 outlier excluded: ρ=0.07, p=0.41).
Fig. 4.
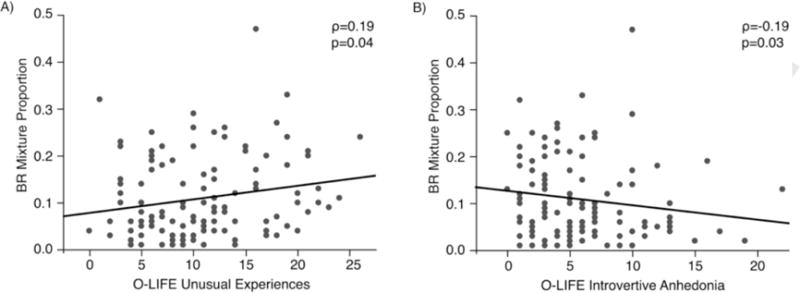
Scatterplots representing the relationship between O-LIFE factor scores and the duration of mixture percepts in Experiment 2. BR, binocular rivalry.
4. Discussion
In the current study, we found evidence for reduced strength of visual adaptation scaling with schizotypal traits in a non-clinical sample, as indexed by the strength of visual aftereffects and the dynamics of binocular rivalry. These findings provide behavioral evidence for a relationship between attenuated schizophrenia-like traits in the normative population and reduced short-term synaptic plasticity in the visual system.
First, we observed a relationship of increased total schizotypy, positive schizotypy, as well as disorganized schizotypy with reduced orientation adaptation. The robust correlation with the positive dimension of schizotypy is particularly intriguing as it is in line with theoretical (Friston, 2005) and empirical (Powers et al., 2017) work suggesting that abnormalities in perceptual learning, putatively subserved by dysregulated short-term plasticity, are linked to hallucinations in schizophrenia. In interpreting these findings, however, it is important to recall how aftereffect strength was measured in this task. In an attempt to distinguish perceptual aftereffects from potential cognitive response biases associated with having seen a tilted adapting stimulus, normal orientation adaptation trials were interleaved with trials we refer to as baseline trials. These trials were essentially the same as normal trials, but the adapter stimulus was tilted at a much steeper angle. Adaptation at such a steep angle typically has little influence on the perception of near-vertical orientations (Clifford, 2002; Schwartz et al., 2007) so any systematic tendency to report vertical nuller stimuli as tilted during these baseline trials could suggest a cognitive response bias. Accordingly, the measure of tilt aftereffect strength, which is displayed in Fig. 3, was calculated as the difference in aftereffect between the normal trials and the baseline trials. In the case of total schizotypy, the correlation with reduced relative tilt aftereffect was driven by a significant correlation with reduced absolute aftereffect strength. Schizotypy was associated with increased aftereffect strength in the baseline condition; however, this relationship was non-significant. In contrast, in the case of positive schizotypy, there was a significant and robust positive correlation with aftereffect strength in the baseline condition. One possible explanation for this finding is that increased positive schizotypy is associated with a response bias, such that viewing a tilted grating biases subjects to report a tilt in the opposite direction. Another explanation is that individuals with increased positive schizotypy are more likely to experience orientation adaptation using a set of adapter parameters that would not typically influence the perception of the nuller stimulus, because the orientation of the adapter and nuller stimuli are too disparate. In theory, this could be caused by broader orientation tuning curves. Such curves describe the average firing rate of a neuron as a function of stimulus orientation. Thus, broader tuning curves would indicate that the firing rates of neurons that modulate with a particular stimulus characteristic (e.g. contrast, orientation, motion, etc.) are less sensitive to differences in those particular characteristics. At the perceptual level, these broader tuning curves would manifest in reduced discrimination performance and, thus, noisier sensory input. Noisier sensory input would result in a broader range of possible interpretations and increased likelihood for disconnection between an internal experience and the objective external input. As a consequence, this could lead to altered sensory experiences (i.e. hallucinations; Powers et al., 2017) and, accordingly, inaccurate cognitive interpretations of these sensory experiences (i.e. delusions; Maher, 1974). Interestingly, increased broader orientation tuning—measured psychophysically—has been reported in patients with schizophrenia (Rokem et al., 2011) and is argued to be mediated by reduced levels of gamma-aminobutyric acid (GABA) levels in visual cortex (Rokem et al., 2011; Thakkar et al., 2017; Yoon et al., 2010). The current findings indicate that broader tuning curves might be a more general vulnerability factor.
Interestingly, although schizotypal traits correlated with reduced strength of orientation adaptation, there was no relationship with luminance adaptation. Indeed, the magnitudes of these two correlations were significantly different. The difference in the relationship between schizotypy and the strength of these two different types of aftereffects may be explained by the different populations of neurons that are adapting during these two adaptation paradigms. More specifically, luminance adaptation occurs in considerable part at the level of retinal and subcortical neurons (Craik, 1940; Li et al., 2017; Zaidi, 2012); orientation adaptation, on the other hand, is thought to occur at a cortical level (Georgeson, 2004; Mollon, 1977). Accordingly, these data are suggestive of a relationship between increased schizotypal traits and a specific decrease in cortical short-term plasticity.
Visual aftereffects have been referred to as the “psychophysicist’s microelectrode” (Frisby, 1979) because these aftereffects can be traced back to adaptation of specific neural populations. The advantage of employing such behavioral paradigms is that they can be interpreted in terms of underlying changes at the neural level. In the case of the current data, the findings provide evidence of a subcortical-cortical dissociation in visual adaptation deficits as they relate to schizotypy. However, our apparent dissociation between cortical and subcortical deficits is not entirely consistent, at least in an obvious way, with what is known about the origin of visual impairments in schizophrenia. That is, although there is certainly support for visual processing abnormalities that can be accounted for by top-down dysfunction, other work has provided evidence for retinal pathology (Silverstein et al., 2017b) and dysfunction in subcortical visual pathways that lead to abnormal cortical visual activity (Butler et al., 2007). More specifically, the magnocellular visual pathway, which projects from retina through the lateral geniculate nucleus, to the dorsal (i.e. “where”) cortical visual pathway has been found to be more impaired that the parvocellular visual pathway, projecting from retinal to the ventral (i.e. “what”) cortical visual pathway (Butler et al., 2001; Javitt and Freedman, 2015). Magnocellular neurons respond preferentially to low-contrast and low spatial frequency stimuli, whereas parvocellular neurons respond to high-contrast and high spatial frequency stimuli. The spatial frequencies and contrasts of our stimuli are such that the luminance adapter would map more onto the magnocellular pathway and the orientation adapter would map more onto the parvocellular pathway. However, we hesitate in interpreting our data within that framework as our experiments were not designed to test dissociations in magnocellular versus parvocellular visual processing; the larger difference between our two paradigms was the nature of the perceptual judgement (orientation versus detection). These results provide a basis for future work investigating the putative degree to which visual adaptation is altered in the magnocellular and parvocellular systems by parametrically manipulating the degree to which adapter stimuli are biased towards processing by each of these systems within the same aftereffect paradigm.
Individual differences in the dynamics of binocular rivalry also support a relationship between reduced adaptation in the visual system and schizotypal traits, although the results are less clear and less robust than for visual aftereffects. To clarify the link between adaptation and binocular rivalry dynamics: a leading theory of the mechanisms of perceptual alterations during dichoptic presentation is that neurons encoding the currently perceived stimulus, or dominant stimulus, adapt, thus rendering them more susceptible to inhibition by the currently suppressed stimulus and causing a switch in perception and a continuation of the cycle. Accordingly, we would expect that weaker adaptation would result in slower alternation rates and also a greater chance that perception will linger in a mixture state between the two exclusive percepts. These predictions were partially borne out in the current data. Across two studies, we observed a correlation between increased schizotypal traits and the amount of time that individuals reported mixed percepts, again suggestive of a relationship between vulnerability towards schizophrenia and reduced short-term visual plasticity. These findings are in line with Antinori et al. (2017), who found that openness to experience, a personality trait that correlates positively with positive schizotypy (Miller and Tal, 2007), also related to increased mixed percepts. We should note that, compared to visual aftereffects, binocular rivalry provides a more tentative measure of adaptation. Models of rivalry that involve adaptation typically also involve mutual inhibition between neural representations that correspond to the two eyes’ images (Wilson, 2007), and changes in mixed percepts have also been attributed to changes in the strength of this inhibition (Antinori et al., 2017; Klink et al., 2010). Having said that, the present binocular rivalry findings provide a corroboration of the more direct evidence provided by the data on orientation adaptation.
There was some discrepancy across our two experiments regarding the dimension of schizotypy with which mixed percept related. In Experiment 1, increased mixed percept duration was positively associated with negative schizotypy. In Experiment 2, increased mixed percept duration correlated positively with positive symptoms, consistent with the trend-level association observed in Experiment 1; however, in contrast to the findings of Experiment 1, increased mixed percept duration was related negatively to negative schizotypy. Although these findings regarding the negative dimension of schizotypy appear to be contradictory across the two experiments, we think this apparent discrepancy can be accounted for by differences in the two schizotypy measures utilized in the two studies—more specifically, in the relationship between positive and negative schizotypy across the two measures. Different measures of schizotypy, assessing the same broad construct but based on slightly different theoretical notions, are available. In Experiment 1, schizotypy was measured using the SPQ, which is based on a quasi-dimensional model of schizotypy (Claridge, 1997). In this measure, the Cognitive-Perceptual factor taps positive schizotypy where the Interpersonal factor taps negative schizotypy. These two factors share items related to paranoid ideation. Unsurprisingly then, the positive and negative schizotypy factors of the SPQ are generally correlated, which we also observed in our study (Supplemental Table 2). This is not the case for the O-LIFE, which was the measure of schizotypy used in Experiment 2 and based on a fully-dimensional model of schizotypy (Claridge, 1997). The positive factor of this scale generally does not correlate with the negative factor, which again was the case in our study (Supplemental Table 3). Further, previous studies have observed that the positive factor of the SPQ correlates positively with the positive dimension of the O-LIFE but, importantly, also with the negative dimension (Asai et al., 2011). In sum, the psychometric properties of the SPQ and O-LIFE make it less surprising that (1) we observe the same direction of the relationship between mixed percept duration and both positive and negative schizotypy using the SPQ; while (2) observing a different relationship between mixed percept duration and negative schizotypy using the two different schizotypy measures.
Contrary to predictions and findings from a previous study (Antinori et al., 2016), we did not observe a significant relationship between percept duration and schizotypal traits. We did observe a trend-level relationship between longer percept duration and the positive dimension of the SPQ. Differences across studies may again be due to differences in schizotypy measures, sample characteristics, and/ or paradigms. Alternatively, the correlation between percept duration and schizotypy may simply not be very robust or reliable.
More generally, the results of the current study are consistent with a previous study investigating EEG measures of plasticity in the visual system of individuals with schizophrenia (Cavus et al., 2012). In this study, visual evoked potentials were elicited before and after high-frequency visual stimulation. Sustained potentiation—even after 20min—was observed in healthy controls, but not schizophrenia patients, consistent with reduced plasticity in the visual system of these individuals, which a later study using the same visual high-frequency stimulation paradigm related to poorer neurocognitive functioning in patients (Jahshan et al., 2017). The results of the current study support and extend these findings by providing behavioral evidence that reduced short-term plasticity extends sub-clinically into a normative sample of college undergraduates.
Along with providing insights into disease mechanisms, these findings may also shed light on clinical phenomenology. Although the precise function of visual adaptation is still up for debate, several possibilities have been posited. One proposed function is that adaptation improves discriminability of novel visual stimuli (Kohn, 2007); this explanation has particular relevance for schizophrenia as aberrant salience inappropriately attributed to irrelevant stimuli is one influential explanation for psychotic symptoms (Kapur, 2003). Indeed, Silverstein et al. (2017a) speculated that reduced adaptation may underpin altered salience attributed to objects. At the very least, adaptation permits the visual system to capitalize on systematic regularities in input to optimize visual processing. Thus, reduced visual adapta tion may contribute to the robust visual perception abnormalities observed in schizophrenia spectrum (reviewed in Butler et al., 2008; Silverstein, 2016).
Here we used schizotypy in order to investigate fundamental features of illness liability in a manner free from confounds related to studying individuals diagnosed with schizophrenia spectrum disorders, which include general cognitive deterioration that may preclude an understanding of task demands, medication, and the psychosocial effects of having a severe mental illness. The results of the current study provide meaningful insights into to disease mechanisms in schizophrenia and provide a non-invasive and relatively simple way to measure short-term plasticity. However, the present approach does not allow for the study of more proximal illness mechanisms that can be examined by studying patient populations. A further limitation is the relatively constricted range of schizotypy scores in this high-functioning group of college undergraduates. Both these limitations should thus motivate future work aimed at generalizing our experimental approach to patient populations, in order to further evaluate the suggestion that short-term plasticity in the visual system may provide important insights into disease mechanisms of schizophrenia.
Supplementary Material
Acknowledgments
The authors would like to thank Jiamei Zhang, Amina Guo, An-drew Rockett, Chinyere Jigo, Christina Sesi, Franco Bull, Michael Wertheimer for help with data collection.
Role of funding
This work was supported by a NARSAD Young Investigator award from the Brain and Behavior Foundation (KNT), NIMH R01 MH112644 (KNT), and a grant from the Michigan State University College of Social Sciences Faculty Initiatives Award (JWB, KNT). AA was supported by an Australian Postgraduate Award and OC was supported by the Australian Research Council FFT40100807.
Appendix A. Supplementary data
Supplementary data to this article can be found online at https://doi.org/10.1016/j.schres.2018.04.013.
Footnotes
Conflicts of interest
No authors report any conflicts of interest.
Contributors
J.W.B., K.N.T., O.L.C. and A.A. designed the study. J.W.B. and A.A. collected data and/or oversaw data collection. J.W.B., K.N.T., and A.A. performed data analysis. K.N.T. wrote a first draft of the manuscript. All authors contributed to and have approved the final manuscript.
References
- Abraham P, McCallum WC. The CNV and the spiral aftereffect. Electroencephalogr. Clin Neurophysiol. 1973;33:205–208. [Google Scholar]
- Alais D, Cass J, O’Shea RP, Blake R. Visual sensitivity underlying changes in visual consciousness. Curr Biol. 2010;20(15):1362–1367. doi: 10.1016/j.cub.2010.06.015. [DOI] [PMC free article] [PubMed] [Google Scholar]
- Anstis S, Rogers B, Henry J. Interactions between simultaneous contrast and colored afterimages. Vis Res. 1978;18(8):899–911. doi: 10.1016/0042-6989(78)90016-0. [DOI] [PubMed] [Google Scholar]
- Anstis S, Verstraten FA, Mather G. The motion aftereffect. Trends Cogn Sci. 1998;2(3):111–117. doi: 10.1016/s1364-6613(98)01142-5. [DOI] [PubMed] [Google Scholar]
- Antinori A, Smillie LD, Carter OL. Personality measures link slower binocular rivalry switch rates to higher levels of self-discipline. Front Psychol. 2016;7:2008. doi: 10.3389/fpsyg.2016.02008. [DOI] [PMC free article] [PubMed] [Google Scholar]
- Antinori A, Carter OL, Smillie LD. Seeing it both ways: openness to experience and binocular rivalry suppression. J Res Pers. 2017;68:15–22. [Google Scholar]
- Asai T, Sugimori E, Bando N, Tanno Y. The hierarchic structure in schizotypy and the five-factor model of personality. Psychiatry Res. 2011;185(1–2):78–83. doi: 10.1016/j.psychres.2009.07.018. [DOI] [PubMed] [Google Scholar]
- Benjamini Y, Hochberg Y. Controlling the false discovery rate: a practical and powerful approach to multiple testing. J R Stat Soc Ser B. 1995;57:289–300. [Google Scholar]
- Blake R, Logothetis N. Visual competition. Nat Rev Neurosci. 2002;3(1):13–21. doi: 10.1038/nrn701. [DOI] [PubMed] [Google Scholar]
- Blakemore C, Campbell FW. On the existence of neurones in the human visual system selectively sensitive to the orientation and size of retinal images. J Physiol. 1969;203(1):237–260. doi: 10.1113/jphysiol.1969.sp008862. [DOI] [PMC free article] [PubMed] [Google Scholar]
- Bosten JM, Goodbourn PT, Lawrance-Owen AJ, Bargary G, Hogg RE, Mollon JD. A population study of binocular function. Vis Res. 2015;110(Pt A):34–50. doi: 10.1016/j.visres.2015.02.017. [DOI] [PubMed] [Google Scholar]
- Brainard DH. The psychophysics toolbox. Spat Vis. 1997;10(4):433–436. [PubMed] [Google Scholar]
- Brascamp JW, Naber M. Eye tracking under dichoptic viewing conditions: a practical solution. Behav Res Methods. 2017;49(4):1303–1309. doi: 10.3758/s13428-016-0805-2. [DOI] [PubMed] [Google Scholar]
- Brascamp JW, van Boxtel JJA, Knapen THJ, Blake R. A dissociation of attention and awareness in phase-sensitive but not phase-insensitive visual channels. J Cogn Neurosci. 2010;22(10):2326–2344. doi: 10.1162/jocn.2009.21397. [DOI] [PMC free article] [PubMed] [Google Scholar]
- Brascamp J, Sterzer P, Blake R, Knapen T. Multistable perception and the role of frontoparietal cortex in perceptual inference. Annu Rev Psychol. 2017 doi: 10.1146/annurev-psych-010417-085944. [DOI] [PubMed] [Google Scholar]
- Brindley GS. Two new properties of foveal after-images and a photochemical hypothesis to explain them. J Physiol. 1962;164:168–179. doi: 10.1113/jphysiol.1962.sp007011. [DOI] [PMC free article] [PubMed] [Google Scholar]
- Butler PD, Schechter I, Zemon V, Schwartz SG, Greenstein VC, Gordon J, Schroeder CE, Javitt DC. Dysfunction of early-stage visual processing in schizophrenia. A J Psychiatry. 2001;158(7):1126–1133. doi: 10.1176/appi.ajp.158.7.1126. [DOI] [PubMed] [Google Scholar]
- Butler PD, Martinez A, Foxe JJ, Kim D, Zemon V, Silipo G, Mahoney J, Shpaner M, Jalbrzikowski M, Javitt DC. Subcortical visual dysfunction in schizophrenia drives secondary cortical impairments. Brain. 2007;130(Pt 2):417–430. doi: 10.1093/brain/awl233. [DOI] [PMC free article] [PubMed] [Google Scholar]
- Butler PD, Silverstein SM, Dakin SC. Visual perception and its impairment in schizophrenia. Biol Psychiatry. 2008;64(1):40–47. doi: 10.1016/j.biopsych.2008.03.023. [DOI] [PMC free article] [PubMed] [Google Scholar]
- Cavus I, Reinhart RM, Roach BJ, Gueorguieva R, Teyler TJ, Clapp WC, Ford JM, Krystal JH, Mathalon DH. Impaired visual cortical plasticity in schizophrenia. Biol Psychiatry. 2012;71(6):512–520. doi: 10.1016/j.biopsych.2012.01.013. [DOI] [PMC free article] [PubMed] [Google Scholar]
- Claridge GS. Excitation-inhibition balance in neurotics. In: Eysenck HJ, editor. Experiments in Personality. Routledge and Kegan Paul; New York: 1960. pp. 107–154. [Google Scholar]
- Claridge G. Theoretical background and issues. In: Claridge G, editor. Schizotypy: Implications for Illness and Health. Oxford University Press; Oxford, United Kingdom: 1997. pp. 3–18. [Google Scholar]
- Claridge G, Beech T. Fully and quasi-dimensional constructions of schizotypy. In: Raine A, Lencz T, Mednick SA, editors. Schizotypal Personality. Cambridge University Press; New York: 1995. [Google Scholar]
- Claridge G, McCreery C, Mason O, Bentall R, Boyle G, Slade P, Popplewell D. The factor structure of ‘schizotypal’ traits: a large replication study. Br J Clin Psychol. 1996;35(Pt 1):103–115. doi: 10.1111/j.2044-8260.1996.tb01166.x. [DOI] [PubMed] [Google Scholar]
- Clifford CW. Perceptual adaptation: motion parallels orientation. Trends Cogn Sci. 2002;6(3):136–143. doi: 10.1016/s1364-6613(00)01856-8. [DOI] [PubMed] [Google Scholar]
- Clifford CW, Wenderoth P, Spehar B. A functional angle on some after-effects in cortical vision. Proc Biol Sci. 2000;267(1454):1705–1710. doi: 10.1098/rspb.2000.1198. [DOI] [PMC free article] [PubMed] [Google Scholar]
- Clifford CW, Webster MA, Stanley GB, Stocker AA, Kohn A, Sharpee TO, Schwartz O. Visual adaptation: neural, psychological and computational aspects. Vis Res. 2007;47(25):3125–3131. doi: 10.1016/j.visres.2007.08.023. [DOI] [PubMed] [Google Scholar]
- Craik KJW. Origin of visual after-images. Nature. 1940;145:512–512. [Google Scholar]
- Feldman DE. Synaptic mechanisms for plasticity in neocortex. Annu Rev Neurosci. 2009;32:33–55. doi: 10.1146/annurev.neuro.051508.135516. [DOI] [PMC free article] [PubMed] [Google Scholar]
- Freedman B, Chapman LJ. Early subjective experience in schizophrenic episodes. J Abnorm Psychol. 1973;82(1):46–54. doi: 10.1037/h0034952. [DOI] [PubMed] [Google Scholar]
- Frisby J. Seeing: Illusion, Brain and Mind. Oxford University Press; Oxford: 1979. [Google Scholar]
- Friston K. Hallucinations and perceptual inference. Behav Brain Sci. 2005;28(6):764–766. [Google Scholar]
- Georgeson M. Visual aftereffects: cortical neurons change their tune. Curr Biol. 2004;14(18):R751–753. doi: 10.1016/j.cub.2004.09.011. [DOI] [PubMed] [Google Scholar]
- Georgeson MA, Turner RSE. Afterimages of sinusoidal, square-wave and compound gratings. Vis Res. 1985;25(11):1709–1720. doi: 10.1016/0042-6989(85)90143-9. [DOI] [PubMed] [Google Scholar]
- Gibson JJ, Radner M. Adaptation, after-effect and contrast in the perception of tilted lines. I. Quantitative studies. J Exp Psychol. 1937;20:453–467. [Google Scholar]
- Goto Y, Yang CR, Otani S. Functional and dysfunctional synaptic plasticity in prefrontal cortex: roles in psychiatric disorders. Biol Psychiatry. 2010;67(3):199–207. doi: 10.1016/j.biopsych.2009.08.026. [DOI] [PubMed] [Google Scholar]
- Harris J. The duration of the movement aftereffect as an index of psychiatric illness. Perception. 1994;23(10):1145–1153. doi: 10.1068/p231145. [DOI] [PubMed] [Google Scholar]
- Harris JP, Phillipson OT, Watkins GM, Whelpton R. Effects of chlorpromazine and promazine on the visual aftereffects of tilt and movement. Psychopharmacology. 1983;79(1):49–57. doi: 10.1007/BF00433016. [DOI] [PubMed] [Google Scholar]
- Harris JP, Gelbtuch MH, Phillipson OT. Effects of haloperidol and nomifensine on the visual aftereffects of tilt and movement. Psychopharmacology. 1986;89(2):177–182. doi: 10.1007/BF00310625. [DOI] [PubMed] [Google Scholar]
- Herrington RN, Claridge GS. Sedation threshold and Archimedes’ spiral after-effect in early psychosis. J Psychiatr Res. 1965;3(3):159–170. doi: 10.1016/0022-3956(65)90026-9. [DOI] [PubMed] [Google Scholar]
- Hiris E, Blake R. Another perspective on the visual motion aftereffect. Proc Natl Acad Sci U S A. 1992;89(19):9025–9028. doi: 10.1073/pnas.89.19.9025. [DOI] [PMC free article] [PubMed] [Google Scholar]
- Jahshan C, Wynn JK, Mathalon DH, Green MF. Cognitive correlates of visual neural plasticity in schizophrenia. Schizophr Res. 2017 doi: 10.1016/j.schres.2017.03.016. [DOI] [PubMed] [Google Scholar]
- Javitt DC, Freedman R. Sensory processing dysfunction in the personal experience and neuronal machinery of schizophrenia. A J Psychiatry. 2015;172(1):17–31. doi: 10.1176/appi.ajp.2014.13121691. [DOI] [PMC free article] [PubMed] [Google Scholar]
- Kapur S. Psychosis as a state of aberrant salience: a framework linking biology, phenomenology, and pharmacology in schizophrenia. Am J Psychiatry. 2003;160(1):13–23. doi: 10.1176/appi.ajp.160.1.13. [DOI] [PubMed] [Google Scholar]
- Kelly DH, Martinez-Uriegas E. Measurements of chromatic and achromatic afterimages. J Opt Soc Am A. 1993;10(1):29–37. doi: 10.1364/josaa.10.000029. [DOI] [PubMed] [Google Scholar]
- Kelm H. The figural after-effect in schizophrenic patients. J Nerv Ment Dis. 1962;135:338–345. doi: 10.1097/00005053-196210000-00008. [DOI] [PubMed] [Google Scholar]
- Kelm H. Visual figural aftereffect in schizophrenic and nonschizophrenic patients. J Abnorm Psychol. 1968;73(3):273–275. doi: 10.1037/h0020123. [DOI] [PubMed] [Google Scholar]
- Klink PC, Brascamp JW, Blake R, van Wezel RJ. Experience-driven plasticity in binocular vision. Curr Biol. 2010;20(16):1464–1469. doi: 10.1016/j.cub.2010.06.057. [DOI] [PMC free article] [PubMed] [Google Scholar]
- Kohn A. Visual adaptation: physiology, mechanisms, and functional benefits. J Neurophysiol. 2007;97(5):3155–3164. doi: 10.1152/jn.00086.2007. [DOI] [PubMed] [Google Scholar]
- Leguire LE, Blake R. Role of threshold in afterimage visibility. J Opt Soc Am. 1982;72(9):1232–1237. doi: 10.1364/josa.72.001232. [DOI] [PubMed] [Google Scholar]
- Lenzenweger MF. Schizotypy: an organizing framework for schizophrenia research. Curr Dir Psychol Sci. 2006;15:162–166. [Google Scholar]
- Li H, Liu X, Andolina IM, Li X, Lu Y, Spillmann L, Wang W. Asymmetries of dark and bright negative afterimages are paralleled by subcortical ON and OFF poststimulus responses. J Neurosci. 2017;37(8):1984–1996. doi: 10.1523/JNEUROSCI.2021-16.2017. [DOI] [PMC free article] [PubMed] [Google Scholar]
- Maher BA. Delusional thinking and perceptual disorder. J Individ Psychol. 1974;30(1):98–113. [PubMed] [Google Scholar]
- Malenka RC, Nicoll RA. Long-term potentiation–a decade of progress? Science. 1999;285(5435):1870–1874. doi: 10.1126/science.285.5435.1870. [DOI] [PubMed] [Google Scholar]
- Mason O, Claridge GS, Jackson ME. New scales for the assessment of schizotypy. Personal Individ Differ. 1995;18:7–13. [Google Scholar]
- Miller GF, Tal IR. Schizotypy versus openness and intelligence as predictors of creativity. Schizophr Res. 2007;93(1–3):317–324. doi: 10.1016/j.schres.2007.02.007. [DOI] [PubMed] [Google Scholar]
- Miller SM, Gynther BD, Heslop KR, Liu GB, Mitchell PB, Ngo TT, Petti-grew JD, Geffen LB. Slow binocular rivalry in bipolar disorder. Psychol Med. 2003;33(4):683–692. doi: 10.1017/s0033291703007475. [DOI] [PubMed] [Google Scholar]
- Miller SM, Hansell NK, Ngo TT, Liu GB, Pettigrew JD, Martin NG, Wright MJ. Genetic contribution to individual variation in binocular rivalry rate. Proc Natl Acad Sci U S A. 2010;107(6):2664–2668. doi: 10.1073/pnas.0912149107. [DOI] [PMC free article] [PubMed] [Google Scholar]
- Mollon JD. Neural analysis. In: von Fieandt K, Moustgaard IK, editors. The Perceptual World. Academic Press; London: 1977. pp. 71–100. [Google Scholar]
- Narr KL, Leaver AM. Connectome and schizophrenia. Curr Opin Psychiatry. 2015;28(3):229–235. doi: 10.1097/YCO.0000000000000157. [DOI] [PubMed] [Google Scholar]
- Powers AR, Mathys C, Corlett PR. Pavlovian conditioning-induced hallucinations result from overweighting of perceptual priors. Science. 2017;357(6351):596–600. doi: 10.1126/science.aan3458. [DOI] [PMC free article] [PubMed] [Google Scholar]
- Raine A. The SPQ: a scale for the assessment of schizotypal personality based on DSM-III-R criteria. Schizophr Bull. 1991;17(4):555–564. doi: 10.1093/schbul/17.4.555. [DOI] [PubMed] [Google Scholar]
- Rokem A, Yoon JH, Ooms RE, Maddock RJ, Minzenberg MJ, Silver MA. Broader visual orientation tuning in patients with schizophrenia. Front Hum Neurosci. 2011;5:127. doi: 10.3389/fnhum.2011.00127. [DOI] [PMC free article] [PubMed] [Google Scholar]
- Sakitt B. Psychophysical correlates of photoreceptor activity. Vis Res. 1976;16(2):129–140. doi: 10.1016/0042-6989(76)90089-4. [DOI] [PubMed] [Google Scholar]
- Schwartz O, Hsu A, Dayan P. Space and time in visual context. Nat Rev Neurosci. 2007;8(7):522–535. doi: 10.1038/nrn2155. [DOI] [PubMed] [Google Scholar]
- Shimojo S, Kamitani Y, Nishida S. Afterimage of perceptually filled-in surface. Science. 2001;293(5535):1677–1680. doi: 10.1126/science.1060161. [DOI] [PubMed] [Google Scholar]
- Silverstein SM. Visual perception disturbances in schizophrenia: a unified model. Neb Symp Motiv. 2016;63:77–132. doi: 10.1007/978-3-319-30596-7_4. [DOI] [PubMed] [Google Scholar]
- Silverstein SM, Demmin D, Skodlar B. Space and objects: on the phenomenology and cognitive neuroscience of anomalous perception in schizophrenia (ancillary article to EAWE domain 1) Psychopathology. 2017;50(1):60–67. doi: 10.1159/000452493. [DOI] [PubMed] [Google Scholar]
- Silverstein SM, Paterno D, Cherneski L, Green S. Optical coherence tomography indices of structural retinal pathology in schizophrenia. Psychol Med. 2017:1–11. doi: 10.1017/S0033291717003555. [DOI] [PubMed] [Google Scholar]
- Steiger JH. Tests for comparing elements of a correlation matrix. Psychol Bull. 1980;87(2):245–251. [Google Scholar]
- Stephan KE, Baldeweg T, Friston KJ. Synaptic plasticity and dysconnection in schizophrenia. Biol Psychiatry. 2006;59(10):929–939. doi: 10.1016/j.biopsych.2005.10.005. [DOI] [PubMed] [Google Scholar]
- Stephan KE, Friston KJ, Frith CD. Dysconnection in schizophrenia: from abnormal synaptic plasticity to failures of self-monitoring. Schizophr Bull. 2009;35(3):509–527. doi: 10.1093/schbul/sbn176. [DOI] [PMC free article] [PubMed] [Google Scholar]
- Surguladze SA, Chkonia ED, Kezeli AR, Roinishvili MO, Stahl D, David AS. The McCollough effect and facial emotion discrimination in patients with schizophrenia and their unaffected relatives. Schizophr Bull. 2012;38(3):599–607. doi: 10.1093/schbul/sbq141. [DOI] [PMC free article] [PubMed] [Google Scholar]
- Thakkar KN, Rosler L, Wijnen JP, Boer VO, Klomp DW, Cahn W, Kahn RS, Neggers SF. 7T proton magnetic resonance spectroscopy of gamma-aminobutyric acid, glutamate, and glutamine reveals altered concentrations in patients with schizophrenia and healthy siblings. Biol Psychiatry. 2017;81(6):525–535. doi: 10.1016/j.biopsych.2016.04.007. [DOI] [PubMed] [Google Scholar]
- Thompson P, Burr D. Visual aftereffects. Curr Biol. 2009;19(1):R11–14. doi: 10.1016/j.cub.2008.10.014. [DOI] [PubMed] [Google Scholar]
- Tress KH, Kugler BT. Interocular transfer of movement after-effects in schizophrenia. Br J Psychol. 1979;70(3):389–392. doi: 10.1111/j.2044-8295.1979.tb01708.x. [DOI] [PubMed] [Google Scholar]
- Uhlhaas PJ. Dysconnectivity, large-scale networks and neuronal dynamics in schizophrenia. Curr Opin Neurobiol. 2013;23(2):283–290. doi: 10.1016/j.conb.2012.11.004. [DOI] [PubMed] [Google Scholar]
- Virsu V, Laurinen P. Long-lasting afterimages caused by neural adaptation. Vis Res. 1977;17(7):853–860. doi: 10.1016/0042-6989(77)90129-8. [DOI] [PubMed] [Google Scholar]
- Wark B, Lundstrom BN, Fairhall A. Sensory adaptation. Curr Opin Neurobiol. 2007;17(4):423–429. doi: 10.1016/j.conb.2007.07.001. [DOI] [PMC free article] [PubMed] [Google Scholar]
- Wenderoth P, Johnstone S. Possible neural substrates for orientation analysis and perception. Perception. 1987;16(6):693–709. doi: 10.1068/p160693. [DOI] [PubMed] [Google Scholar]
- Wertheimer M. The differential satiability of schizophrenic and normal subjects: a test of a deduction from the theory of visual aftereffects. J Gen Psychol. 1954;51:291–299. [Google Scholar]
- Wertheimer M, Jackson CW., Jr Figural after-effects, brain modifiability, and schizophrenia: a further study. J Gen Psychol. 1957;57(1):45–54. doi: 10.1080/00221309.1957.9920347. [DOI] [PubMed] [Google Scholar]
- Wilson HR. Minimal physiological conditions for binocular rivalry and rivalry memory. Vis Res. 2007;47(21):2741–2750. doi: 10.1016/j.visres.2007.07.007. [DOI] [PubMed] [Google Scholar]
- Yoon JH, Maddock RJ, Rokem A, Silver MA, Minzenberg MJ, Ragland JD, Carter CS. GABA concentration is reduced in visual cortex in schizophrenia and correlates with orientation-specific surround suppression. J Neurosci. 2010;30(10):3777–3781. doi: 10.1523/JNEUROSCI.6158-09.2010. [DOI] [PMC free article] [PubMed] [Google Scholar]
- Zaidi Q. Neural locus of color afterimages. J Ophthalmic Vis Res. 2012;7(1):105–106. [PMC free article] [PubMed] [Google Scholar]
- Zucker RS, Regehr WG. Short-term synaptic plasticity. Annu Rev Physiol. 2002;64:355–405. doi: 10.1146/annurev.physiol.64.092501.114547. [DOI] [PubMed] [Google Scholar]
Associated Data
This section collects any data citations, data availability statements, or supplementary materials included in this article.