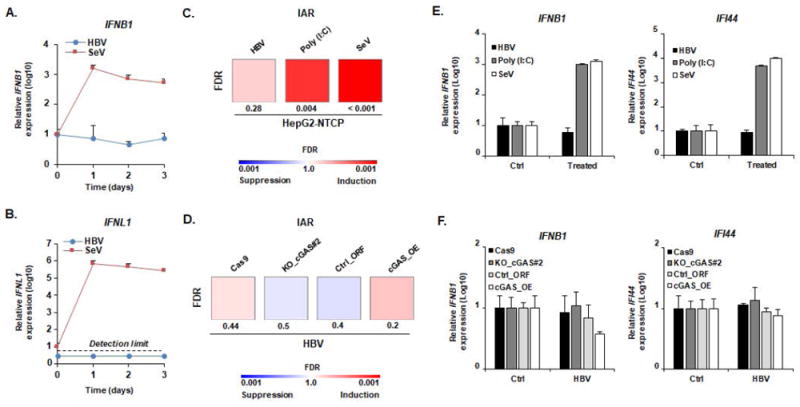
Figure 2. Impaired cGAS-mediated sensing of HBV infection in HepG2-NTCP cells.

(A-B) HBV infection does not induce IFNB1 or IFNL1 expression. HepG2-NTCP cells were infected with HBV (MOI: 500) or SeV (MOI: 10) and total RNA was extracted every day for 3 days. RNA extracted from naive cells before infection was used as a control (D0). IFNB1 (A) and IFNL1 (B) expression was then assessed by qRT-PCR. Results are expressed as means ± SD IFNB1/IFNL1 relative expression (log10) compared to controls (D0, all set at 1) from three independent experiments performed at least in duplicate (SeV) or four independent experiments performed in duplicate (HBV). No robust IFNL1 expression was detected in HBV-infected samples (representative dots are presented under the “detection limit” dotted line). (C, E) cGAS-related ISGs are not affected by HBV infection. HepG2-NTCP cells were infected with HBV or SeV. Alternatively, HepG2-NTCP cells were transfected with Poly (I:C) (100ng). Two days after infection or transfection, total RNA was extracted. Gene expression of IAR signature was then analyzed using multiplexed gene profiling. Results were analyzed by GSEA enrichment compared to non-transfected or non-infected controls (C) or by IFNB1 and IFI44 gene expression (log10) compared to non-transfected or non-infected controls (set at 1) (E). One experiment performed in triplicate is shown. (D, F) cGAS expression level does not affect the cellular response to HBV infection. HepG2-NTCP-Cas9 (Cas9), HepG2-NTCP-KO_cGAS#2 (Ko_cGAS#2), HepG2-NTCP-Ctrl_ORF (Ctrl_ORF), and HepG2-NTCP-cGAS_OE (cGAS_OE) were infected with HBV. Two days after infection, total RNA was extracted. Gene expression of IAR signature gene set was then analyzed using multiplexed gene profiling. Results were analyzed by GSEA enrichment compared to non-transfected or non-infected controls (D) or by IFNB1 and IFI44 gene expression (log10) compared to non-transfected or non-infected controls (set at 1) (F). One experiment performed in triplicate is shown. IAR: innate antiviral response gene set.
