

Abstract
Background/Objectives
Physical activity (PA) protects against a wide range of diseases. Habitual PA appears to be heritable, motivating the search for specific genetic variants that may inform efforts to promote PA and target the best type of PA for each individual.
Subjects/Methods
We used data from the UK Biobank to perform the largest genome-wide association study of PA to date, using three measures based on self-report (nmax=377,234) and two measures based on wrist-worn accelerometry data (nmax=91,084). We examined genetic correlations of PA with other traits and diseases, as well as tissue-specific gene expression patterns. With data from the Atherosclerosis Risk in Communities (ARIC; n=8,556) study, we performed a meta-analysis of our top hits for moderate-to-vigorous PA (MVPA).
Results
We identified ten loci across all PA measures that were significant in both a basic and a fully adjusted model (p<5 × 10⁻⁹). Upon meta-analysis of the nine top hits for MVPA with results from ARIC, eight were genome-wide significant. Interestingly, among these, the rs429358 variant in the APOE gene was the most strongly associated with MVPA, whereby the allele associated with higher Alzheimer’s risk was associated with greater MVPA. However, we were not able to rule out possible selection bias underlying this result. Variants in CADM2, a gene previously implicated in obesity, risk-taking behavior and other traits, were found to be associated with habitual PA. We also identified three loci consistently associated (p<5 × 10⁻⁵) with PA across both self-report and accelerometry, including CADM2. We find genetic correlations of PA with educational attainment, chronotype, psychiatric traits, and obesity-related traits. Tissue enrichment analyses implicate the brain and pituitary gland as locations where PA-associated loci may exert their actions.
Conclusions
These results provide new insight into the genetic basis of habitual PA, and the genetic links connecting PA with other traits and diseases.
Introduction
A physically active lifestyle has been shown to protect against a wide range of diseases, including cardiovascular disease, cancer, type-2 diabetes, osteoporosis, and Alzheimer’s disease 1–4. Levels of engagement in physical activity (PA) vary across individuals, and most people do not meet recommended levels to achieve health benefits. Although cultural, economic, and other environmental factors influence PA engagement 5,6, genetic factors also likely play a role. Understanding the genetic factors underlying inter-individual variation will better inform efforts to promote PA and potentially allow targeting the best type of PA for each person, what might be called “Precision Exercise Prescription”.
Evidence of genetic factors underlying the propensity to exercise in humans has been demonstrated in a number of studies 7–13. Several studies have utilized a candidate gene approach to identify specific genetic variants associated with a proclivity towards PA 8,14–18. This work generally focused on genes related to the serotonin and dopamine systems, energy metabolism, and neurotrophic factors. However, to our knowledge there have been only two previous reports of genome-wide association studies (GWAS) of PA 19,20, neither of which identified a locus at genome-wide significance, likely due to relatively small sample sizes. Thus, while previous work strongly suggests a genetic basis for engagement in PA, the genes that contribute to this healthy lifestyle behavior remain unknown.
In this study, we conducted the largest GWAS of PA to date, aiming to identify genetic variants associated with self-reported and accelerometry-based levels of habitual, leisure-time PA. We sought to identify variants in the UK Biobank, a large cohort study of 500,000 adults measured across a wide range of characteristics including genome-wide markers. We then examined the genetic correlation of PA with other traits, examined putative tissues where PA genes may exert their effects, and meta-analyzed the identified loci for MVPA with data on self-reported PA in an independent cohort from the Atherosclerosis Risk in Communities (ARIC) study.
Methods
Studies
Data from the UK Biobank study were used for discovery of variants. Briefly, the UK Biobank is a large prospective cohort study of approximately a half-million adults (ages 40-69) living in the United Kingdom (UK), recruited from 22 centers across the UK 21. All participants provided written informed consent. Ethical approval of the UK Biobank study was given by the North West Multicentre Research Ethics Committee, the National Information Governance Board for Health & Social Care, and the Community Health Index Advisory Group. We also used data from the ARIC study (n=8,556), which is a prospective cohort study of over 15,000 adults aged 45-64 years that took place in four United States communities. The selection of this cohort for replication was based on 1) the quality of the PA phenotype which incorporates multiple questions assessing types, intensities, and frequency of PA (see below), 2) the focus on habitual, leisure-time PA, and 3) the relatively large sample size. In the absence of previous effect size estimates for genetic variants on PA, the sample size in ARIC, although comparatively much smaller than the UK Biobank, was deemed, on an a-priori basis, to serve as a suitable replication cohort. Details of the ARIC study can be found elsewhere 22. All participants in ARIC provided written informed consent. Institutional review board approval was obtained by each participating field center, and this study was approved by the University of Arizona Human Subjects Protection Program (Protocol number: 1300000659R001). To reduce the potential for confounding by population stratification, we included only individuals of white race/ethnicity in both studies.
Physical activity
In the UK Biobank, self-reported levels of physical activity during work and leisure time were measured via a touchscreen questionnaire, in a fashion similar to the International Physical Activity Questionnaire 23. For moderate PA (MPA), participants were asked: “In a typical WEEK, on how many days did you do 10 minutes or more of moderate physical activities like carrying light loads, cycling at normal pace? (Do not include walking)”. For vigorous PA (VPA), participants were asked: “In a typical WEEK, how many days did you do 10 minutes or more of vigorous physical activity? (These are activities that make you sweat or breathe hard such as fast cycling, aerobics, heavy lifting)”. For each of these questions, those who indicated 1 or more such days were then asked “How many minutes did you usually spend doing moderate/vigorous activities on a typical DAY”. Participants were asked to include activities performed for work, leisure, travel and around the house. We excluded individuals who selected “prefer not to answer” or “do not know” on the above questions, those reporting not being able to walk, and individuals reporting more than 16 hours of either MPA or VPA per day. Those reporting >3hr/day of VPA or MPA were recoded to 3 hours, as recommended 24. Moderate-to-vigorous PA (MVPA) was calculated by taking the sum of total minutes/week of MPA multiplied by four and the total number of VPA minutes/week multiplied by eight, corresponding to their metabolic equivalents, as previously described 23,25.
Since heritability has previously been shown to be higher for intense/vigorous physical activity 12, we also considered VPA on its own. Because the distribution of minutes/week of VPA was highly skewed and zero-inflated, we chose to dichotomize minutes/week of VPA into those who reported 0 days of VPA, and those reporting 3 or more days of VPA and also reporting a typical duration of VPA that is 25 minutes or greater, corresponding to common physical activity guidelines 26. Individuals that did not fall into either of these two groups were excluded. We decided to pick extremes because of the heavily skewed and zero-inflated nature of vigorous activity duration, and in order to increase our power to detect associations. We also performed a sensitivity analysis in which we included individuals who did not fall into either of the two groups described above, and placed these individuals in the group that did not meet 3 days of VPA/week of 25 minutes or greater per day (i.e. those meeting the 3 days/week of VPA at 25/mins per day vs. not meeting this amount).
We used responses to the question “In the last 4 weeks did you spend any time doing the following?” and follow-up questions assessing the frequency and typical duration of “strenuous sports” and of “other exercises”. The possible responses to the initial question were: ‘walking for pleasure’, ‘other exercises’, ‘strenuous sports’, ‘light DIY’, ‘heavy DIY’, ‘none of the above’, and ‘prefer not to answer’. We identified individuals spending 2-3 days/week or more doing strenuous sports or other exercises (SSOE), for a duration of 15-30 minutes or greater. Controls were those individuals who did not indicate spending any time in the last 4 weeks doing either strenuous sports or other exercises. Individuals that did not fall into either of these two groups were excluded. Extremes were chosen because of the heavily skewed and zero-inflated distributions of these variables.
Also, in the UK Biobank, approximately 100,000 participants wore an Axivity AX3 wrist-worn accelerometer, as previously described 27. We examined two measures derived from up to seven days of accelerometer wear: overall acceleration average, and fraction of accelerations > 425 milli-gravities (mg) 27. Since the variable that is available in the UK Biobank is the fraction < 425 mg, we subtracted 1 from this variable. The 425 mg cutoff was chosen because this corresponds to an equivalent of vigorous physical activity (6 METs), as previously reported 28. For both accelerometry variables, individuals with less than three days (72 hours) of data, or those not having data in each one-hour period of the 24-hour cycle were excluded. Based on missing data simulations by Doherty et al, 72 hours of wear was determined to be needed to be within 10% of a complete seven-day measure 27. Device non-wear time, defined as consecutive stationary episodes >=60 minutes where all three axes had a standard deviation <13 mg, was imputed using the average of similar time-of-day vector magnitude and intensity distribution data points on different days 27. This accounts for wear-time diurnal bias that may occur if the device was less worn during sleep in some individuals 27. Finally, we also excluded outliers with values more than 4 standard deviations above the mean.
In ARIC, self-reported PA was assessed for sports/exercise, within the previous year, based on a modification of the Baecke questionnaire 29,30. The sport/exercise index is based on up to four sports/exercises (including modalities of mild, moderate, and strenuous energy exertion) that participants reported in the past year, and was calculated with responses to 4 items: frequency of participation in sports/exercise; frequency of sweating during sports/exercise; a subjective rating of the frequency of participation in sports/exercise compared to others in the same age group; the sum of frequency, duration, and intensity of up to 4 reported sports/exercises. This derived index is described in greater detail elsewhere, along with an assessment of its reliability and accuracy 31.
Genotypes
The majority of UK Biobank participants were genotyped with the Affymetrix UK Biobank Axiom Array (Santa Clara, CA, USA), while 10% of participants were genotyped with the Affymetrix UK BiLEVE Axiom Array. Detailed quality control and imputation procedures are described elsewhere 32. Briefly, phasing was performed by the UK Biobank team in chunks of 15,000 markers, using SHAPEIT3 33 software and 1,000 Genomes phase 334 dataset as a reference panel. Imputation was performed using a combined panel of the Haplotype Reference Consortium 35 and the UK10K haplotype resource 36 after appropriate marker and sample QC in chunks of 50,000 imputed markers. Principal Components Analysis was also performed by the UK Biobank team, using fastPCA 37 software on a set of 147,604 high-quality directly genotyped markers (pruned to minimize LD), and a set of 407,219 unrelated high-quality samples. All other samples were then projected onto the principal components 32. Since corrections for potential problems with the position assignment of the SNPs from the UK10K haplotype resource were not available at the time of analysis, we only included SNPs imputed from the Haplotype Reference Consortium. To minimize the possibility of confounding due to population stratification, only participants who self-identified as European were included. Individuals were excluded based on unusually high heterozygosity or >5% missing rate, a mismatch between self-reported and genetically-inferred sex. These criteria resulted in a total available sample size of 458,969 individuals with genotype data. SNP exclusions were made based on Hardy-Weinberg equilibrium (p<1×10⁻⁶), high missingness (>1.5%), low minor allele frequency (<0.1%), and low imputation quality (info<0.4). A total of approximately 11.8 million SNPs were used in analyses. Of these, 4.1 million have a minor allele frequency < 1%.
In ARIC, participants were genotyped with the Affymetrix Genome-Wide Human SNP Array 6.0 (Affymetrix, Santa Clara, CA, USA). Standard quality control procedures were implemented prior to imputation with IMPUTE2 38, using all individuals in the 1,000 Genomes phase 1 integrated v3 release. Quality-control procedures consisted of excluding SNPs with minor allele frequency < 1%, with missingness > 10%, and SNPs out of Hardy-Weinberg equilibrium (p<1 × 10⁻⁶), and excluding individuals with SNP missingness > 10%. We used principal components for the European-ancestry group as provided by ARIC in dbGaP. Briefly, LD pruning resulted in 71,702 SNPs that were used to derive principal components. A total sample size of 8,556 participants was used in the analysis.
Statistical analyses
For the continuous variables in the UK Biobank (MVPA and accelerometry variables) we created an adjusted phenotype corresponding to the residual of the regression of the following independent variables on the respective dependent PA variable: age, sex, genotyping chip, first ten genomic principal components, center, season (month) at center visit or wearing accelerometer (coded 0 for Winter, 1 for Fall or Spring, and 2 for Summer). In another model (Model 2), we considered the additional inclusion of the following covariates: levels of physical activity at work (coded as 0 by default, 1 for ‘sometimes’, 2 for ‘usually’, and 3 for ‘always’), extent of walking or standing at work (coded similarly as previous variable), and the Townsend Deprivation Index (TDI; a composite measure of deprivation as previously described 39,40). We also considered a third model (Model 3) in which body mass index (BMI) was included as an additional covariate. These covariates were considered since both self-reported and accelerometer-based measures of PA could include PA done as part of one’s employment, as opposed to PA during leisure-time. Additionally, both SES and BMI may affect participation in leisure-time PA 5. Since the MVPA and fraction of accelerations > 425 mg variables exhibited skewed distributions, we inverse-normalized these variables prior to inclusion in the models. Model residuals conformed to the assumptions of normality and homoscedasticity. GWAS were performed with BOLT-LMM software 41,42, which implements a mixed-model linear regression that includes a random effect consisting of the SNPs other than the one being tested, and thus takes into account relatedness among subjects. Since BOLT-LMM implements a linear regression, effect size estimates for case-control outcomes are unreliable. Therefore, as previously done elsewhere 43,44, we derived effect size estimates for the genome-wide significant SNPs for the binary outcomes (VPA and SSOE) using logistic regression in R with the same set of fixed-effect covariates. Given the number of low-frequency SNPs 45 and phenotypes tested, we used a more stringent genome-wide significance threshold: p<5 × 10⁻⁹. To examine the relationship of PA-associated SNPs with BMI, we tested the association of identified SNPs with BMI, which was first inverse-normalized, then adjusted via a linear regression with age, sex, genotyping chip, first ten genomic principal components, and center as independent variables. We also sought to identify variants consistently associated with PA across self-report and accelerometry PA measures, for overall PA and for high-intensity PA. We thus searched for variants associated in the same direction, with p<5 × 10⁻⁵ for: 1) MVPA and average acceleration, and 2) VPA, SSOE, and fraction of accelerations >425 mg.
To determine the extent to which the loci identified in Model 3 may have been subject to collider bias on account of including BMI as a covariate, we derived an approach to estimate the unbiased effect of each SNP of interest on each metric of PA. Our approach was an extension of the methodology employed in Yaghootkar et al. 46 – the primary difference being the collider in our method (i.e., BMI) is a quantitative trait as opposed to a categorical/disease trait. The unbiased coefficient can be expressed as:
where each is the corresponding coefficient of the ith variable in the jth model:
We confirmed this approach via simulation under a variety of conditions, including the inclusion of additional covariates and different relationships between BMI, PA, and a genetic marker (results not shown). For simplicity we modeled PA as a quantitative trait in all cases.
Given the association that we identified with the rs428358 variant in APOE (see Results), we performed several additional analyses. First, we examined the associations with the APOE ε4 haplotype, using this SNP along with the rs7412 SNP. Different protein isoforms of APOE, which is a component of various lipoproteins, are produced by the different haplotypes defined by these two SNPs, and these haplotypes are well-established risk factors for Alzheimer’s disease 47 and coronary artery disease 48,49. Individuals with homozygous CC genotypes at both of these SNPs were classified as homozygous for the APOE ε4 allele. Individuals with homozygous CC genotypes at either SNP and heterozygous at the other SNP were classified as being heterozygous for the ε4 allele. We excluded a relatively small number of individuals heterozygous at both SNPs (n≈10,000), because it is not possible to assign a haplotype status when both loci are heterozygous. We assumed an additive model in association testing. Second, to examine whether this association may be driven by individuals with a known family history of Alzheimer’s disease increasing their levels of PA, we examined the association of a binary variable indicating any self-reported first-degree family history (mother, father, or siblings) of Alzheimer’s disease or dementia with MVPA. Third, we examined the interaction of family history with the rs429358 SNP on MVPA. Fourth, we examined whether the association of rs429358 with MVPA was modified by age, by testing the interaction of this SNP with age, and testing the association of rs429358 with MVPA among individuals in their 40s, 50s, and 60s. Finally, given prior evidence of an association of APOE variants with BMI and the slightly attenuated associations upon our adjustment for BMI, we tested whether BMI mediated the association of rs429358 with MVPA. For this analysis, we used the mediation package 50 in R statistical software 51.
All genome-wide significant loci were examined in ARIC, where we modeled PA as a continuous variable (as described above). We used multiple linear regression to model PA as a function of age, sex, first ten genomic principal components, center, season (coded in the same way as described above). Residuals from this model conformed to the assumptions of normality and homoscedasticity. They were standardized to have a mean of 0 and standard deviation of 1, and were used as the outcome in the genome-wide SNP association analysis. We performed meta-analysis of the top hits for MVPA in the UK Biobank with the corresponding SNP association results in ARIC, using fixed-effects inverse-variance weighted meta-analysis. We also used a method that uses only the p-values 52 to perform meta-analyses of the top hits for the other UK Biobank PA measures. Additional analyses were performed with R statistical software.
To examine the association of genes identified in the UK Biobank with gene expression patterns in different tissues, we used the web-based platform, Functional Mapping and Annotation of Genome-Wide Association Studies (FUMA GWAS) 53, which uses data from GTEx 54 and the MAGMA gene-based analysis 55. Also from this platform, we examined results of gene-set analyses performed for curated gene sets and Gene Ontology terms. We also used the summary statistics from our UK Biobank GWAS to examine heritability of PA traits and their genetic correlation with over 200 traits and diseases using LD score regression 56–58, implemented in an online interface (http://ldsc.broadinstitute.org/). Briefly, this method tests the correlation between the LD score of each SNP (reflecting how correlated it is with nearby SNPs) and its test statistic, where the slope corresponds to the SNP/chip heritability, and the intercept is an estimate of inflation. It uses only SNPs that are likely well imputed (1,000 Genomes 34 EUR MAF>5%), while removing strand-ambiguous SNPs, insertions/deletions, those that do not match those in the 1000 Genomes data phase 3, those in the MHC region, and those with extremely large effect sizes 57,58. The genetics of other traits and diseases are inferred from previously published GWAS. A significant genetic correlation was considered if p< 2.5 × 10⁻⁴, assuming a correction for 200 different tests, which is conservative given that many of the traits/diseases tested are correlated with each other. Finally, we queried our top hits in the Oxford Brain Imaging Genetics Server to examine associations with other traits, including brain imaging phenotypes, in the UK Biobank (http://big.stats.ox.ac.uk/) 59, and in the GTEx Portal for expression quantitative trait locus (eQTL) analysis.
Results
Self-reported PA in UK Biobank
There were 377,234 individuals with non-missing MVPA data. 80,721 individuals were excluded due to insufficient data on either moderate or vigorous PA days and/or duration. There were 261,055 individuals with non-missing VPA data. 175,965 individuals were excluded from the VPA analysis because they belonged to neither of the two defined groups. 21,946 individuals were excluded from VPA analyses because of insufficient data on VPA days and/or duration. For both measures, individuals excluded because of insufficient data were more likely to be female, older, and have a higher BMI (p<2 × 10⁻¹⁶). A summary of self-report PA variables can be found in Table 1. BMI and TDI were consistently negatively associated with these variables, whereas warmer season and male gender were consistently positively associated with them (see Supplementary Table 1). Physical activity at work was positively associated with MVPA and VPA, and negatively associated with SSOE. Self-report PA measures were weakly correlated with accelerometry-based measures (see Supplementary Table 2). ‘Chip heritability’ estimates for self-report PA measures were approximately 5% (Supplementary Table 3). Although Q-Q plots show some evidence of inflation (see Supplementary Figure 1), LD score regression intercepts (<1.03) suggest no significant systematic inflation of test statistics.
Table 1.
Summary of PA phenotypes in the UK Biobank and ARIC.
| UK Biobank - Self-Report | |
|---|---|
|
|
|
| MVPA (MET-minutes/week) | Mean=1,650; Median=960; SD=2,084; n=377,234 |
| VPA: ≥3 vs. 0 days/week | 98,060 cases; 162,995 controls |
| SSOE: ≥2-3 vs. 0 days/week | 124,842 cases; 225,650 controls |
|
UK Biobank - Accelerometry
|
|
| Average acceleration (milli-gravities) | Mean=27.98; Median=27.03; SD=8.14; n=91,084 |
| Fraction of time with accelerations > 425 milli-gravities | Mean=0.0026; Median=0.001; SD=0.0033 ; n=90,667 |
|
ARIC – Self-Report
|
|
| Sport/exercise index | Mean=2.54; Median=2.50; SD=0.81; n=8,817 |
SD: standard deviation
We found nine loci significantly associated (p < 5 × 10⁻⁹) with MVPA (see Figure 1 and Table 2). Among these, four were significantly associated with MVPA in both Models 1 and 3: APOE, EXOC4, CADM2, and PAX5. The RPP21 and ZNF165 loci were significant in Models 1 and 2, but not in Model 3. However, effect estimates were generally similar for all nine loci across Models 1 and 3. The CALU locus was only significant in Model 1. The PBX2 and ARHGEF26-AS1 loci were only significant in Models 2 and 3. Two loci, C11orf80 and CCDC188, were only significant in Model 3 (see Supplementary Tables 4 and 5, Supplementary Figures 2 and 3). Among the nine identified SNPs, six exhibited trends with BMI in the expected direction, based on the negative phenotypic correlation between PA and BMI. Among the other three, the PA-increasing alleles at the CADM2 and PAX5 loci are associated with higher BMI (p=7.9 × 10⁻¹³ and 5.2 × 10⁻⁸, respectively; see Table 2).
Figure 1.
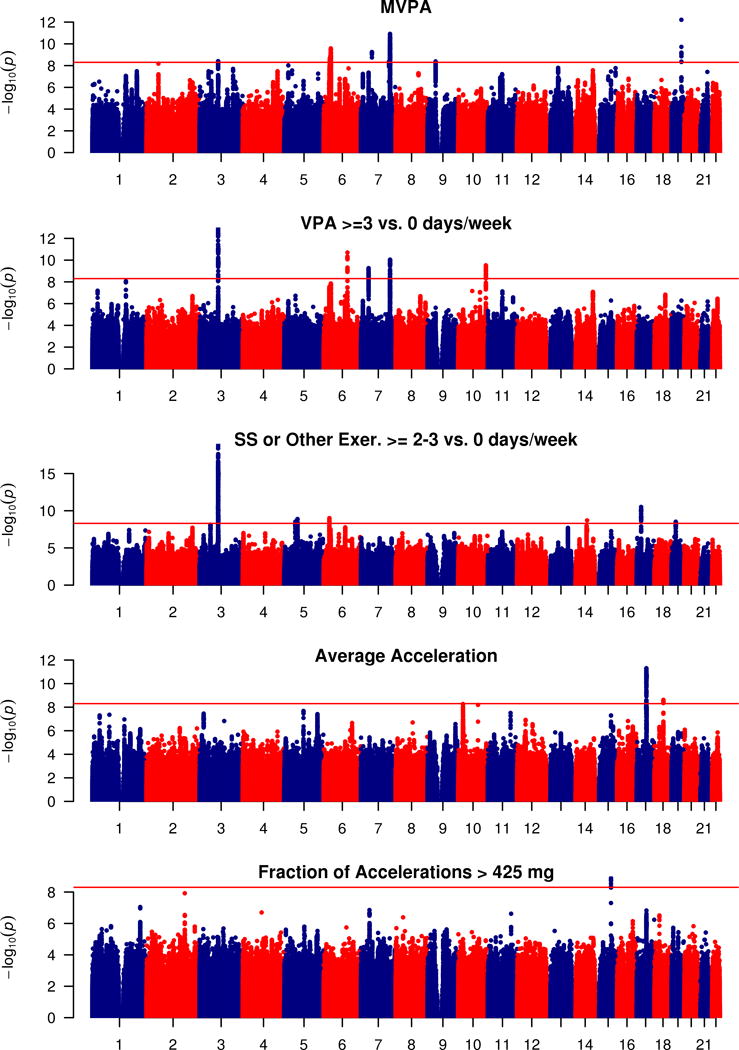
Manhattan plot of GWAS for self-reported MVPA and VPA, strenuous sports or other exercises (abbreviated as SS or Other Exer.), and for accelerometer-based average accelerations and fraction of accelerations > 425 mg. Negative log10-transformed p-value for each SNP is plotted by chromosome and position (x-axis). The red horizontal line represents the threshold for genome-wide significant associations (p<5 × 10⁻⁹).
Table 2.
Summary of polymorphisms identified in the UK Biobank. The beta coefficient units for MVPA are standard deviations of MVPA (MET-minutes/week), after inverse normalization. The beta coefficient unit for acceleration average is milli-gravities. The beta coefficient unit for “Fraction Accel. > 425 mg” is fraction of time. The beta coefficient units for BMI correspond to residualized BMI after inverse normalization.
| SNP ID | Chr. | Gene/Nearest Gene | Position | EA | EAF | Model 1
|
n | Model 3
|
BMI association
|
|||
|---|---|---|---|---|---|---|---|---|---|---|---|---|
| Beta/OR | p-value | Beta/OR | p-value | Beta | p-value | |||||||
| MVPA | ||||||||||||
| rs429358* | 19 | APOE | 45,411,941 | T | 0.85 | −0.022 | 6.1E-13 | 377,234 | −0.019 | 7.3E-11 | 2.5E-02 | 2.4E-21 |
| rs7804463* | 7 | EXOC4 | 133,447,651 | T | 0.53 | 0.015 | 1.2E-11 | 377,234 | 0.013 | 4.1E-10 | −2.9E-04 | 8.8E-01 |
| rs2854277 | 6 | HLA-DQB1 | 32,628,084 | C | 0.92 | 0.032 | 2.6E-10 | 377,234 | 0.027 | 1.4E-08 | −2.0E-02 | 4.8E-06 |
| rs7791992 | 7 | C7orf72/SPATA48 | 50,237,784 | C | 0.41 | −0.014 | 5.7E-10 | 377,234 | −0.012 | 1.7E-08 | 1.5E-03 | 4.4E-01 |
| rs3094622 | 6 | RPP21 | 30,327,952 | A | 0.86 | 0.02 | 1.4E-09 | 377,234 | 0.018 | 1.0E-08 | −9.9E-03 | 3.8E-04 |
| rs149943 | 6 | ZNF165 | 28,002,388 | G | 0.85 | 0.019 | 2.2E-09 | 377,234 | 0.016 | 5.6E-08 | −1.2E-02 | 1.4E-05 |
| rs2035562* | 3 | CADM2 | 85,056,521 | A | 0.33 | −0.014 | 3.9E-09 | 377,234 | −0.014 | 1.0E-09 | −1.5E-02 | 7.9E-13 |
| rs2988004* | 9 | PAX5 | 37,044,388 | T | 0.56 | −0.013 | 4.1E-09 | 377,234 | −0.014 | 2.4E-11 | −1.1E-02 | 5.2E-08 |
| rs1043595 | 7 | CALU | 128,410,012 | G | 0.72 | 0.014 | 4.3E-09 | 377,234 | 0.013 | 4.2E-08 | 1.4E-03 | 5.2E-01 |
| Vigorous PA: ≥ 3 vs. 0 days/week | ||||||||||||
| rs1248860* | 3 | CADM2 | 85,015,779 | G | 0.48 | 0.96 | 1.1E-13 | 261,055 | 0.95 | 5.3E-15 | −9.5E-03 | 6.8E-07 |
| rs2764261 | 6 | FOXO3 | 108,927,842 | A | 0.37 | 1.04 | 2.0E-11 | 261,055 | 1.03 | 5.3E-08 | −1.8E-02 | 8.7E-20 |
| rs13243553* | 7 | EXOC4 | 133,506,955 | G | 0.61 | 1.04 | 9.0E-11 | 261,055 | 1.04 | 2.4E-09 | −4.6E-03 | 2.0E-02 |
| rs3781411* | 10 | CTBP2 | 126,715,436 | C | 0.88 | 1.06 | 3.0E-10 | 261,055 | 1.06 | 1.0E-10 | 1.7E-03 | 5.6E-01 |
| rs328902* | 7 | DPY19L1 | 35,020,843 | C | 0.69 | 0.96 | 5.5E-10 | 261,055 | 0.96 | 1.3E-10 | −6.2E-03 | 2.7E-03 |
| Strenuous sports or other exercises: ≥ 2-3 vs. 0 days/week | ||||||||||||
| rs62253088* | 3 | CADM2 | 85,400,801 | T | 0.33 | 1.05 | 1.0E-19 | 350,492 | 1.05 | 8.9E-23 | 1.1E-02 | 1.2E-07 |
| rs166840* | 17 | AKAP10 | 19,799,698 | G | 0.59 | 1.03 | 3.1E-11 | 350,492 | 1.03 | 7.3E-11 | 5.4E-03 | 5.8E-03 |
| rs10946808 | 6 | HIST1H1D | 26,233,387 | A | 0.73 | 0.97 | 9.9E-10 | 350,492 | 0.97 | 3.8E-08 | 1.2E-02 | 3.6E-08 |
| rs159544* | 5 | CTC-436P18.1 | 60,489,247 | A | 0.61 | 0.97 | 1.3E-09 | 350,492 | 0.97 | 2.7E-09 | −5.5E-03 | 5.3E-03 |
| rs75930676* | 14 | SIPA1L1 | 71,826,547 | T | 0.95 | 0.93 | 2.0E-09 | 350,492 | 0.93 | 8.5E-10 | 2.1E-03 | 6.4E-01 |
| rs111901094 | 19 | GATAD2A | 19,513,570 | G | 0.82 | 1.04 | 3.0E-09 | 350,492 | 1.04 | 5.1E-08 | −8.7E-03 | 6.0E-04 |
| Accelerometry – Average acceleration | ||||||||||||
| rs55657917* | 17 | CRHR1 | 43,844,560 | T | 0.78 | -0.30 | 5.0E-12 | 91,084 | -0.28 | 1.7E-11 | −3.7E-03 | 1.1E-01 |
| rs59499656 | 18 | RIT2/SYT4 | 40,768,309 | A | 0.66 | -0.23 | 2.4E-09 | 91,084 | -0.19 | 4.1E-07 | 1.4E-02 | 1.5E-12 |
| Accelerometry – Fraction accelerations > 425 milli-gravities | ||||||||||||
| rs743580 | 15 | PML | 74,328,116 | A | 0.51 | 0.025 | 1.3E-09 | 90,667 | 0.022 | 4.7E-08 | −1.2E-02 | 1.4E-09 |
EA refers to effect allele that Beta/OR corresponds to; EAF: effect allele frequency; n represents sample size used in Model 1;
indicates SNPs that remain genome-wide significant in Model 3.
Most notably among the MVPA associations, the C allele at SNP rs429358 in APOE was associated with higher self-reported MVPA. This MVPA-increasing allele is the one associated with higher Alzheimer’s disease risk (see Discussion). We found it to also be associated with higher levels of the four other PA measures, though not always reaching nominal significance (VPA: p=5.3 × 10⁻⁷; SSOE: p=0.097; average acceleration: p=8.2 × 10⁻³; fraction of accelerations>425mg: p=0.24). Testing the association of the Alzheimer’s disease-related APOE ε4 allele with MVPA resulted in nearly identical findings. In models adjusted for other covariates, including BMI, this APOE variant remained genome-wide significant (see Supplementary Tables 4 and 5 and Supplementary Figures 2 and 3). Mediation analysis suggests partial mediation (~14%, p<2 × 10⁻¹⁶) by BMI on the association of rs429358 with MVPA. There were 45,440 individuals reporting any family history of Alzheimer’s disease or dementia among parents and siblings. These individuals reported lower levels of MVPA (p=1.2 × 10⁻⁴). We found a significant interaction of rs429358 with family history (p=0.012), whereby the association of rs429358 with MVPA was stronger among those reporting a family history (β=0.042, p=5.13 × 10⁻⁸) compared to among those without a reported family history (β=0.019, p=6.38 × 10⁻⁹). We also observed a significant interaction of age with this variant (p=0.005). Specifically, among individuals in their forties, the association was weaker (β=0.011, se=0.006, p=0.067) than among individuals in their fifties (β=0.017, se=0.005, p=0.0013) and sixties (β=0.030, se=0.005, p=1.28 × 10⁻¹⁰). In addition, the frequency of the C allele decreased slightly across these age groups (r=−0.006, p<5 × 10⁻⁵), at 0.314, 0.309, and 0.305 among individuals in their forties, fifties and sixties, respectively.
Five loci were significantly associated with VPA using Model 1. The strongest among these were variants in CADM2. Four of these were significantly associated with VPA in all three models tested: CADM2, EXOC4, CTBP2, and DPY19L1. The FOXO3 locus was significant in Models 1 and 2, but not Model 3, and loci NEGR1 and MYOM3 were significant only in Model 3 (see Supplementary Tables 4 and 5, Supplementary Figures 2 and 3). The VPA-increasing G allele at the NEGR1 SNP (rs3101340) is in LD (r2=0.60) with a previously identified variant (rs3101336-C) associated with increased BMI 60. Although different individual CADM2 SNPs were identified across models and with MVPA, these SNPs were in strong to moderate LD, suggesting allelic heterogeneity at this locus (see Supplementary Figures 4 and 5). Among all five VPA-associated SNPs, only two had consistent trends of association with BMI in the direction expected based on the negative phenotypic correlation. Notably, the PA-increasing allele at the CADM2 SNP was associated with higher BMI (p=6.8 × 10⁻⁷; see Table 2). In a sensitivity analysis in which all individuals who did not self-report at least 3 days/week at 25 minutes/day of VPA were included as controls (as opposed to only individuals reporting 0 days of VPA), results were similar but generally weaker despite a larger sample size, with a chip heritability of approximately one half of that for the analysis using more extreme controls (h2=0.026 (0.002) vs. 0.054 (0.003); see Supplementary Figure 6).
Six loci were significantly associated with SSOE using Model 1(see Table 2 and Figure 1). CADM2 was the most strongly associated locus. Four loci (CADM2, AKAP10, CTC-436P18.1, and SIPA1L1) were consistently significantly associated in both Models 1 and 3. Locus GATAD2A was associated with SSOE only in Model 1, and HIST1H1D was associated with SSOE only in Models 1 and 2 (see Supplementary Tables 4 and 5, Supplementary Figures 2 and 3). The C allele at a variant in FTO (rs55872725) was associated with lower odds of SSOE only upon adjustment for BMI (Model 3). This allele is in complete LD (r2=1) with the T allele of the well-established variant (rs1558902) associated with lower BMI. Correction for collider bias, shown in Supplementary Table 5, reduces the strength of this FTO SNP association with SSOE from p=7.0 × 10⁻¹³ to p=3.0 × 10⁻³ in the unbiased model, with the same direction of association. Among all five SSOE-associated SNPs, three showed consistent trends of association with BMI in the direction expected based on the negative phenotypic correlation. Notably, the PA-increasing allele at the CADM2 SNP was associated with higher BMI (p=1.2 × 10⁻⁷; see Table 2).
Upon meta-analysis of the 9 top hits for MVPA with the results in ARIC, 8 were genome-wide significant (p<5 × 10⁻⁹), including the APOE, EXOC4, and CADM2 variants (see Supplementary Table 6). The direction of effect was consistent across ARIC and the UK Biobank for all 9 loci. For both VPA and SSOE, we observed consistent directions of effect for 3 out of the 5 top loci (see Supplementary Table 7).
Accelerometer-based PA in UK Biobank
There were approximately 91,000 individuals with non-missing accelerometry data. Approximately 6,500 individuals were excluded because of insufficient wear-time. These excluded individuals were slightly more likely to be male (p=0.03), younger (p<2 × 10⁻¹⁶) and have a higher BMI (p<2 × 10⁻¹⁶). ‘Chip heritability’ estimates for the accelerometry-based measures were higher (14% for average acceleration, and 11% for fraction of accelerations >425 mg) than for self-report PA measures (Supplementary Table 3). Although Q-Q plots show some evidence of inflation (see Supplementary Figure 1), LD score regression intercepts (<1.008) suggest no significant systematic inflation of test statistics.
Using Model 1, two loci were found to be significantly associated with average acceleration and one locus with fraction of accelerations >425 mg (see Table 2 and Figure 1). Only the CRHR1 locus remained genome-wide significant in Model 3. The RIT2/SYT4 locus was only associated with average acceleration in Model 1, and the PML locus was only significant with fraction of accelerations >425 mg in Models 1 and 2 (see Table 2, Supplementary Tables 4 and 5, and Supplementary Figures 1 and 2).
In general, with the exception of the FTO locus as mentioned above, we observed minimal evidence of collider bias because of adjustment for BMI (see Supplementary Table 5).
Consistent loci across self-report and accelerometry
We found a total of seven loci associated (p < 5 × 10⁻⁵) with both self-report and accelerometry measures using Model 1 (see Supplementary Table 8). For MVPA and average acceleration, we identified four loci (MEF2C, RCOR1, STOML1 and CRHR1). For VPA, SSOE, and fraction of acceleration >425 mg, we identified three loci (CADM2, PML, and CCNE1). However, among these, only RCOR1, CRHR1, and CADM2 remained significant in Models 2 and 3 (see Supplementary Table 9).
Follow-up analyses
We found highly significant negative genetic correlations of both MVPA and VPA with intelligence (see Figure 2). We also found significant positive genetic correlations of MVPA and VPA with early-morning chronotype and psychiatric diseases, and negative correlations with body fat and waist circumference. In contrast to the genetic correlations with MVPA and VPA, we found a positive correlation of SSOE with years of schooling and intelligence. We also found positive genetic correlations with age at first birth and negative correlations with neuroticism, depressive symptoms, insomnia, body fat, and waist circumference (see Figure 2). Among the accelerometry-based measures, we found highly significant negative genetic correlations of PA with waist and hip circumference, body fat, obesity, BMI, and other cardiometabolic traits (see Figure 3). Genetic correlation results remained very similar with GWAS models including activity at work and TDI as covariates, except for generally attenuated correlations with intelligence in the model with all covariates except BMI (Model 2, see Figure 2). However, upon the addition of BMI as a covariate (Model 3), the direction of genetic correlation between PA and obesity traits was reversed (see Figures 2 and 3). As we note below, caution may be warranted in interpreting results from these adjusted models, especially since we observed a reversal of direction of correlations with obesity-related traits upon BMI adjustment.
Figure 2.
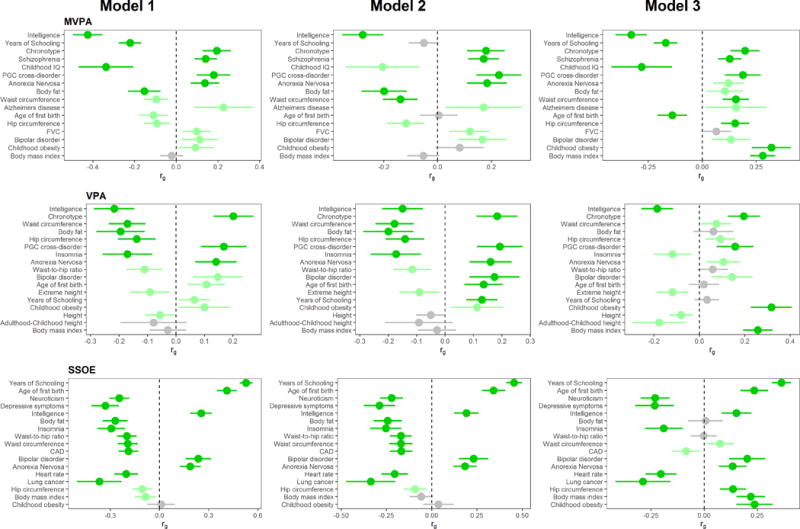
Genetic correlation of self-reported PA variables with other traits and diseases across the three statistical models employed. Traits/diseases shown are those that are in the top 10 of genetically correlated traits/diseases (according to p-value) for at least one of the 3 models. Traits/diseases are ordered from top to bottom in order of increasing p-value for Model 1. Horizontal position of bars corresponds to the genetic correlation (rg) between PA and the respective trait/disease. Error bars represent 95% confidence intervals for rg estimates. Bright green bars represent traits that showed a correlation with p-value <2.5 × 10⁻⁴, and light green bars represent traits with genetic correlation p<0.05. We excluded highly redundant traits (e.g. obesity, overweight) after leaving higher ranked one in.
Figure 3.
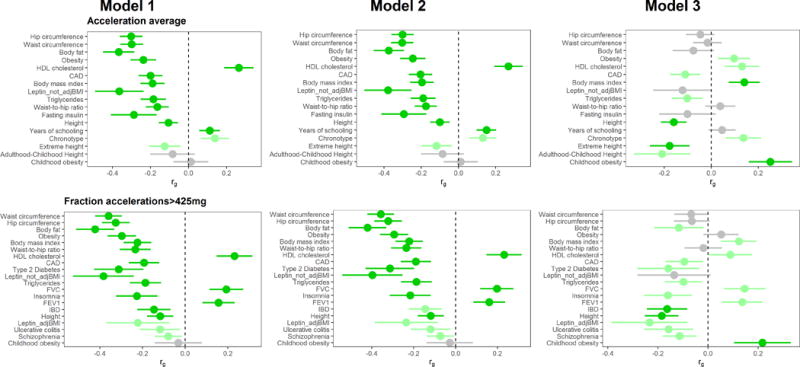
Genetic correlation of accelerometry-based PA variables with other traits and diseases across the three statistical models employed. Traits/diseases shown are those that are in the top 10 of genetically correlated traits/diseases (according to p-value) for at least one of the 3 models. Traits/diseases are ordered from top to bottom in order of increasing p-value for Model 1. Horizontal position of bars corresponds to the genetic correlation (rg) between PA and the respective trait/disease. Error bars represent 95% confidence intervals for rg estimates. Bright green bars represent traits that showed a correlation with p-value <2.5 × 10⁻⁴, and light green bars represent traits with genetic correlation p<0.05. We excluded highly redundant traits (e.g. obesity, overweight) after leaving higher ranked one in.
Gene-based tissue enrichment analysis using data from GTEx generally implicate the brain and pituitary gland as primary tissues through which the PA-associated loci may exert their effects (see Figure 4). Examination of more specific tissues reveals several different parts of the brain. The cerebellum and the frontal cortex appear most consistently implicated across the five PA phenotypes (see Supplementary Figures 7 and 8). Results remained similar when using Models 2 and 3. Gene-set analyses reveal several nervous system gene sets across the PA phenotypes, but the only significant gene set after correction for multiple testing was for enrichment of genes involved in the synapse, for SSOE (see Supplementary Table 10).
Figure 4.
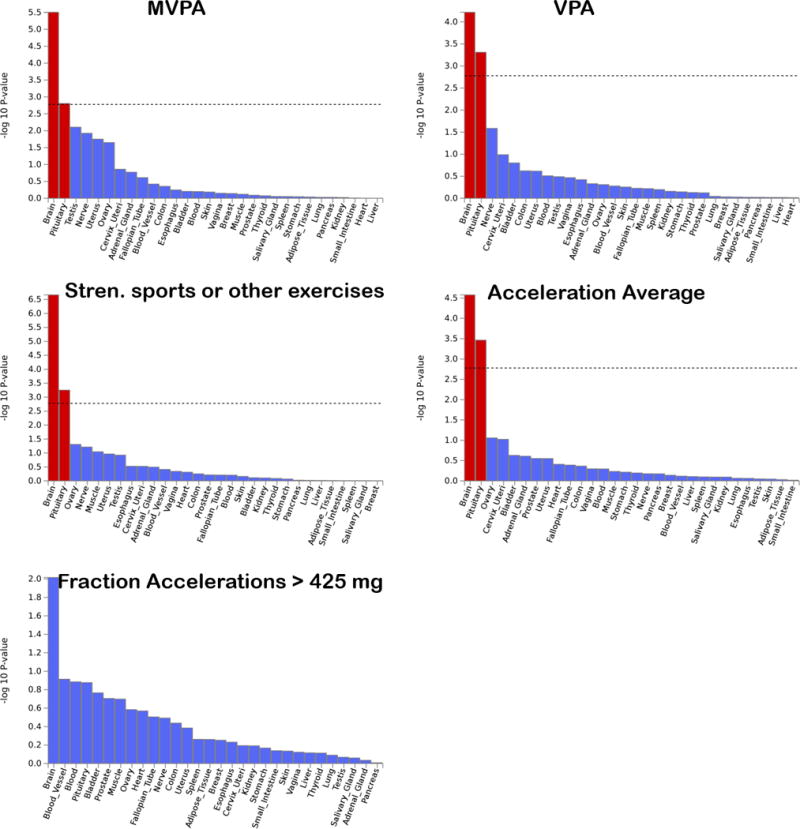
Results of gene-based enrichment analysis for 30 general tissue types for PA-associated loci. Dashed line represents the Bonferroni-corrected significance threshold.
Look-up of top SNPs in the Oxford Brain Imaging server suggests associations with mental health, body composition, educational attainment, sleep and psychiatric traits, in addition to physical activity traits. The rs62253088-T PA-increasing allele in CADM2 was also associated with decreased neuroticism, and decreased self-reported nervous and anxious feelings. The rs7804463-C allele (EXOC4) associated with less PA is also associated with higher self-reported time spent using computer, fewer mood swings, and greater daytime dozing. The rs55657917-G allele (CRHR1) associated with greater PA was also associated with greater neuroticism, lower pulmonary function, greater sense of hurt feelings, and fewer naps during the day (see Supplementary Figure 9). Gene expression analyses imply several different tissues including the brain, adrenal and thyroid gland, skeletal muscle and adipose tissue, among others (see Supplementary Tables 11 and 12). Genes that we identified have previously been implicated in a range of other traits and diseases, including behavioral, cardiometabolic, psychiatric, educational attainment, and pulmonary function traits (see Supplementary Table 11).
Discussion
Given the importance of PA for many dimensions of health, and its’ reported heritability, we sought to identify genetic variants that are associated with engagement in habitual physical activity, while considering important covariates such as season, physical activity at work, socio-economic status, and BMI. In the UK Biobank, with a very large sample size and multiple measures of PA, we identified ten loci that were genome-wide significant for at least one of the PA measures and were consistently associated with the respective PA measure in both the basic (Model 1) and the fully adjusted model (Model 3). We also identified three loci that exhibit consistent associations across both self-report and accelerometry measures.
Although most of the identified loci were novel, the genes that they were in or in proximity to have previous links to various diseases and traits (see Supplementary Table 11). Among these, variants in CADM2, a gene which encodes cell adhesion molecule 2, and is primarily expressed in the brain, has been linked to BMI variation 60,61, risk-taking behavior and other personality and behavioral traits 62–65, as well as with information processing speed 66. The previously identified BMI-associated variant (rs13078960) 60,61 is not in LD (r2<0.07) with the PA–associated variants that we identified, except for the SSOE-increasing allele at rs62253088 being positively, but weakly, correlated with the BMI-increasing allele at rs13078960 (r2=0.2). The previously identified G alleles at both rs13084531 64 and rs57401290 63 associated with risk taking are weakly to moderately correlated (r2=0.52 and 0.23, respectively) with the SSOE-increasing allele that we identified at rs62253088 (see Supplementary Figure 5). It thus appears that this locus may be important for several personality, cognitive, and behavioral traits, and may potentially be involved in reward systems. We found that the association of CADM2 variants with PA in Model 1 was unaffected by the inclusion of BMI as a covariate. Furthermore, the PA-increasing alleles at this locus are associated with higher BMI, in the opposite direction of the phenotypic correlation. Along these lines, but with slightly deviating results, a recent study in mice found that Cadm2-deficient mice exhibit increased locomotor activity along with reduced adiposity 67. Finally, it is important to note that this locus appeared to be more strongly associated with VPA and SSOE as compared to MVPA. It may thus be specifically implicated in the proclivity to engage in intentional high-intensity exercise and sport, as opposed to more general and/or lower intensity PA.
Interestingly, a well-established variant in APOE (part of APOE ε4 allele), strongly implicated in Alzheimer’s disease 47,68, exhibited one of the strongest associations with PA, and remained significant upon meta-analysis. How the APOE risk allele is associated with greater PA is not clear. An exercise training study found that APOE ε4 carriers had a greater increase in aerobic capacity 69. This increased responsivity to PA could reinforce engagement in PA or be related to other factors that influence the tendency to engage in PA. Although another potential explanation for our finding is that individuals with a known family history of dementia or Alzheimer’s disease purposefully increase their levels of PA in the hope of reducing risk for developing the disease, our findings do not suggest that individuals with a first-degree family history of Alzheimer’s disease or dementia engage in higher levels of PA. However, we could not rule out the possibility of selection bias. Since the association was markedly stronger among older participants and the frequency of the risk allele decreased slightly with age from 40 to 69 years, it may be that the older APOE risk allele carriers are particularly enriched for healthy lifestyles. It is important to note that an association between APOE and PA may lead to spurious gene-environment interactions 70, and thus further work is needed to confirm and clarify this observed association.
Among the other specific loci that we identified, we did not find any of the loci that have previously been linked to PA 15,16. The pattern of tissue-specific expression of the identified genes (or nearby genes) varied quite widely, although we observe an overall enrichment of genes expressed in the brain and pituitary gland, and more specifically in the cerebellum and frontal cortex. The cerebellum is involved in the precise coordination of motor activity, and the frontal cortex is involved in decision making, personality expression, and executive function. We also observed an enrichment of genes involved in the nervous system, including in the synapse. Other than CADM2 and APOE, the other identified genes have been previously associated with a wide variety of traits, including intelligence, cognitive decline, blood cell traits, schizophrenia, and obesity among others. They are also expressed in a wide variety of tissues. We suspect that there are many potential paths leading to differences in PA. These could include response to exercise, personality, hormonal levels, body composition. Future research is needed to help elucidate the genetic underpinnings of these proximate mechanisms, and to provide insight into how each of the identified loci contribute to habitual PA behavior.
Previous studies have shown that BMI-associated genetic variants are also associated with PA 71,72. Similarly, we found an overall shared genetic basis for PA (especially accelerometer-based measures) with several obesity-related traits (in the expected negative direction of association), suggesting that genetic risk for obesity coincides with genetic propensity for lower PA. There is likely a complex set of genetic, environmental, and phenotypic factors that connect PA and obesity across the lifespan, that involve many pleiotropic genetic factors. Although we identified previously identified BMI-associated genes (FTO and NEGR1) in Model 3, these results appear to be at least partly attributed to collider bias. Similarly, for all five PA traits, we observed that the direction of the genetic correlation between PA and obesity-related traits is reversed when BMI is included as a covariate, despite a strong negative phenotypic correlation between PA and BMI. In addition to the caution warranted by potential collider bias which occurs when one controls for a variable (i.e. BMI) that is caused by both another covariate (i.e. gene) and the outcome variable in the model (i.e. PA) 46,73, caution is also warranted in interpreting results of genetic associations in which heritable covariates are included in the association model 74. On the other hand, however, adjustment for the covariates may help identify/confirm loci that may or may not be spuriously associated with PA because of confounding via correlated factors.
Our study is strengthened by the large sample size, the availability of both self-reported and objective accelerometer-based measures of PA, and the availability of a replication cohort from a different country. However, we note several limitations. Given the relatively small genetic effect sizes observed for these PA phenotypes, we were insufficiently powered to formally replicate associations in the much smaller sample size in ARIC. Our inability to firmly replicate these findings does detract from our confidence in the generalizability of the UK Biobank results. It could be, for example, that the genetic architecture and implicated genes for habitual PA differ widely by country, as well as by age group (see below), and by PA measure. Additional and larger replication studies are thus needed to more robustly identify PA-associated loci. Furthermore, the self-report measures of PA used in ARIC differed from the one used in the UK Biobank. The ARIC measure focuses more explicitly on leisure-time PA and incorporates more detailed information about PA, such as the frequency of sweating and a comparison of PA frequency with others of the same age. Both self-reported and accelerometer-based measures of PA are subject to various biases. Since both the UK Biobank and ARIC cohorts are comprised of middle- to late-middle-aged adults, the extent to which these results generalize to other age groups is not known. For example, it has been shown that the heritability of PA changes with age, with a decreased heritability in older ages 75. Thus our power to detect strong effects may have been compromised by the older age range in both cohorts that we examined. Furthermore, our results may not generalize to other ethnic/racial groups.
In conclusion, our study revealed several important new findings. Effect sizes were generally very small, given the very large sample size, the common variants identified, and the modest p-values. We identified over 20 variants, most of which were novel, and thus need further study. We identified a variant in CADM2, a gene previously found to be associated with obesity, as well as several personality traits. We also identified a well-established major risk variant for Alzheimer’s disease in APOE, which was associated with higher levels of PA, suggesting the need for follow up studies to help clarify the nature of this observed association and its implication for understanding gene-environment interactions related to PA. We found genetic correlations of PA with obesity 60,76, psychiatric 77,78, educational 79, chronotype 80, and other traits. Genetic correlations with obesity may indicate extensive pleiotropy involving genes associated with both PA and obesity. The identification of genetic factors that predispose to high or low levels of PA will lead to a better understanding of the biological mechanisms underlying these proclivities. It may also lead to the identification of individuals less likely to engage in and/or adhere to PA, and consequently to the development of tailored behavioral strategies. Finally, the integration of genetic characteristics with lifestyle and environmental information may point to how lifestyle/environmental factors interact with genetic factors to influence levels of PA.
Supplementary Material
Acknowledgments
This research was conducted using the UK Biobank Resource under Application Number 15678. We thank the participants and organizers of the UK Biobank. We also thank the participants and organizers of the ARIC study. Data from ARIC was obtained from dbGaP through accession number phs000280.v2.p1. The authors would like to acknowledge support from the National Institute of Diabetes and Digestive and Kidney Diseases grant (K01DK095032), the National Institute on Aging (AG019610), the State of Arizona and Arizona Department of Health Services (ADHS), and the McKnight Brain Research Foundation. The funders had no role in study design, data collection and analysis, decision to publish, or preparation of the manuscript.
Atherosclerosis Risk in Communities
The Atherosclerosis Risk in Communities Study is carried out as a collaborative study supported by National Heart, Lung, and Blood Institute contracts (HHSN268201100005C, HHSN268201100006C, HHSN268201100007C, HHSN268201100008C, HHSN268201100009C, HHSN268201100010C, HHSN268201100011C, and HHSN268201100012C). Funding for GENEVA was provided by National Human Genome Research Institute grant U01HG004402 (E. Boerwinkle). The authors thank the staff and participants of the ARIC study for their important contributions.
LDHUB Acknowledgements
We gratefully acknowledge all the studies and databases that made GWAS summary data available: ADIPOGen (Adiponectin genetics consortium), C4D (Coronary Artery Disease Genetics Consortium), CARDIoGRAM (Coronary ARtery DIsease Genome wide Replication and Meta-analysis), CKDGen (Chronic Kidney Disease Genetics consortium), dbGAP (database of Genotypes and Phenotypes), DIAGRAM (DIAbetes Genetics Replication And Meta-analysis), ENIGMA (Enhancing Neuro Imaging Genetics through Meta Analysis), EAGLE (EArly Genetics & Lifecourse Epidemiology Eczema Consortium, excluding 23andMe), EGG (Early Growth Genetics Consortium), GABRIEL (A Multidisciplinary Study to Identify the Genetic and Environmental Causes of Asthma in the European Community), GCAN (Genetic Consortium for Anorexia Nervosa), GEFOS (GEnetic Factors for OSteoporosis Consortium), GIANT (Genetic Investigation of ANthropometric Traits), GIS (Genetics of Iron Status consortium), GLGC (Global Lipids Genetics Consortium), GPC (Genetics of Personality Consortium), GUGC (Global Urate and Gout consortium), HaemGen (haemotological and platelet traits genetics consortium), HRgene (Heart Rate consortium), IIBDGC (International Inflammatory Bowel Disease Genetics Consortium), ILCCO (International Lung Cancer Consortium), IMSGC (International Multiple Sclerosis Genetic Consortium), MAGIC (Meta-Analyses of Glucose and Insulin-related traits Consortium), MESA (Multi-Ethnic Study of Atherosclerosis), PGC (Psychiatric Genomics Consortium), Project MinE consortium, ReproGen (Reproductive Genetics Consortium), SSGAC (Social Science Genetics Association Consortium) and TAG (Tobacco and Genetics Consortium), TRICL (Transdisciplinary Research in Cancer of the Lung consortium), UK Biobank. We gratefully acknowledge the contributions of Alkes Price (the systemic lupus erythematosus GWAS and primary biliary cirrhosis GWAS) and Johannes Kettunen (lipids metabolites GWAS).
Footnotes
Conflict of interest: The authors declare no conflict of interest.
Supplementary information is available at IJO’s website
References
- 1.Fiuza-Luces C, Garatachea N, Berger NA, Lucia A. Exercise is the real polypill. Physiol. 2013 doi: 10.1152/physiol.00019.2013. [DOI] [PubMed] [Google Scholar]
- 2.US Surgeon General. Physical Activity and Health: A Report of the Surgeon General. S/N 017-023-00196-5. 1996 [Google Scholar]
- 3.Blair SN. Physical inactivity: the biggest public health problem of the 21st century. Br J Sports Med [Internet] 2009 Jan 9;43(1):1 LP-2. [PubMed] [Google Scholar]
- 4.Kaplan GA, Strawbridge WJ, Cohen RD, Hungerford LR. Natural history of leisure-time physical activity and its correlates: associations with mortality from all causes and cardiovascular disease over 28 years. Am J Epidemiol. 1996 doi: 10.1093/oxfordjournals.aje.a009003. [DOI] [PubMed] [Google Scholar]
- 5.Bauman AE, Reis RS, Sallis JF, Wells JC, Loos RJF, Martin BW. Correlates of physical activity: Why are some people physically active and others not? Lancet. 2012:258–71. doi: 10.1016/S0140-6736(12)60735-1. [DOI] [PubMed] [Google Scholar]
- 6.Trost SG, Owen N, Bauman AE, Sallis JF, Brown W. Correlates of adults’ participation in physical activity: review and update. Med Sci Sport Exerc. 2002 doi: 10.1097/00005768-200212000-00020. [DOI] [PubMed] [Google Scholar]
- 7.den Hoed M, Brage S, Zhao JH, Westgate K, Nessa A, Ekelund U, et al. Heritability of objectively assessed daily physical activity and sedentary behavior. Am J Clin Nutr. 2013:1317–25. doi: 10.3945/ajcn.113.069849. [DOI] [PMC free article] [PubMed] [Google Scholar]
- 8.Gielen M, Westerterp-Plantenga MS, Bouwman FG, Joosen AMCP, Vlietinck R, Derom C, et al. Heritability and genetic etiology of habitual physical activity: a twin study with objective measures. [Internet] Genes Nutr. 2014:415. doi: 10.1007/s12263-014-0415-5. [DOI] [PMC free article] [PubMed] [Google Scholar]
- 9.Stubbe JH, Boomsma DI, Vink JM, Cornes BK, Martin NG, Skytthe A, et al. Genetic influences on exercise participation in 37.051 twin pairs from seven countries. PLoS One. 2006 doi: 10.1371/journal.pone.0000022. [DOI] [PMC free article] [PubMed] [Google Scholar]
- 10.Joosen AMCP, Gielen M, Vlietinck R, Westerterp KR. Genetic analysis of physical activity in twins. Am J Clin Nutr United States. 2005 Dec;82(6):1253–9. doi: 10.1093/ajcn/82.6.1253. [DOI] [PubMed] [Google Scholar]
- 11.Pérusse L, Tremblay A, Leblanc C, Bouchard C. Genetic and environmental influences on level of habitual physical activity and exercise participation. Am J Epidemiol. 1989 doi: 10.1093/oxfordjournals.aje.a115205. [DOI] [PubMed] [Google Scholar]
- 12.Lauderdale DS, Fabsitz R, Meyer JM, Sholinsky P, Ramakrishnan V, Goldberg J. Familial determinants of moderate and intense physical activity: a twin study. Med Sci Sports Exerc United States. 1997 Aug;29(8):1062–8. doi: 10.1097/00005768-199708000-00012. [DOI] [PubMed] [Google Scholar]
- 13.Kaprio J, Koskenvuo M, Sarna S. Cigarette smoking, use of alcohol, and leisure-time physical activity among same-sexed adult male twins. Prog Clin Biol Res United States. 1981;69(Pt C):37–46. [PubMed] [Google Scholar]
- 14.Thompson PD, Tsongalis GJ, Ordovas JM, Seip RL, Bilbie C, Miles M, et al. Angiotensin-converting enzyme genotype and adherence to aerobic exercise training. Prev Cardiol. 2006 doi: 10.1111/j.1520-037x.2006.04367.x. [DOI] [PubMed] [Google Scholar]
- 15.Herring MP, Sailors MH, Bray MS. Genetic factors in exercise adoption, adherence and obesity. Obes Rev England. 2014 Jan;15(1):29–39. doi: 10.1111/obr.12089. [DOI] [PubMed] [Google Scholar]
- 16.Wilkinson AV, Gabriel KP, Wang J, Bondy ML, Dong Q, Wu X, et al. Sensation-seeking genes and physical activity in youth. Genes, Brain Behav. 2013 doi: 10.1111/gbb.12006. [DOI] [PMC free article] [PubMed] [Google Scholar]
- 17.Caldwell Hooper AE, Bryan AD, Hagger MS. What keeps a body moving? The brain-derived neurotrophic factor val66met polymorphism and intrinsic motivation to exercise in humans. J Behav Med United States. 2014 Dec;37(6):1180–92. doi: 10.1007/s10865-014-9567-4. [DOI] [PubMed] [Google Scholar]
- 18.Lightfoot JT. Current understanding of the genetic basis for physical activity. J Nutr United States. 2011 Mar;141(3):526–30. doi: 10.3945/jn.110.127290. [DOI] [PMC free article] [PubMed] [Google Scholar]
- 19.De Moor MHM, Liu Y-J, Boomsma DI, Li J, Hamilton JJ, Hottenga J-J, et al. Genome-wide association study of exercise behavior in Dutch and American adults. Med Sci Sports Exerc United States. 2009 Oct;41(10):1887–95. doi: 10.1249/MSS.0b013e3181a2f646. [DOI] [PMC free article] [PubMed] [Google Scholar]
- 20.Kim J, Min H, Oh S, Kim Y, Lee AH, Park T. Joint identification of genetic variants for physical activity in Korean population. Int J Mol Sci. 2014;15(7):12407–21. doi: 10.3390/ijms150712407. [DOI] [PMC free article] [PubMed] [Google Scholar]
- 21.Sudlow C, Gallacher J, Allen N, Beral V, Burton P, Danesh J, et al. UK Biobank: An Open Access Resource for Identifying the Causes of a Wide Range of Complex Diseases of Middle and Old Age. PLoS Med Public Library of Science. 2015;12(3) doi: 10.1371/journal.pmed.1001779. [DOI] [PMC free article] [PubMed] [Google Scholar]
- 22.The Aric Investigators. The Atherosclerosis Risk in Communities (ARIC) Study: design and objectives. The ARIC investigators. Am J Epidemiol [Internet] 1989;129(4):687–702. [PubMed] [Google Scholar]
- 23.Craig CL, Marshall AL, Sjöström M, Bauman AE, Booth ML, Ainsworth BE, et al. International physical activity questionnaire: 12-country reliability and validity. Med Sci Sports Exerc [Internet] 2003 Aug;35(8):1381–95. doi: 10.1249/01.MSS.0000078924.61453.FB. [cited 2013 Aug, 6] [DOI] [PubMed] [Google Scholar]
- 24.Ipaq Sci M, Med S, Hardcastle S, Blake N, Hagger MS, et al. Guidelines for Data Processing and Analysis of the International Physical Activity Questionnaire (IPAQ) - Short Form. J Am Diet Assoc. 2002 [Google Scholar]
- 25.Ekelund U, Sepp H, Brage S, Becker W, Jakes R, Hennings M, et al. Criterion-related validity of the last 7-day, short form of the International Physical Activity Questionnaire in Swedish adults. Public Health Nutr. 2006 doi: 10.1079/phn2005840. [DOI] [PubMed] [Google Scholar]
- 26.American Heart Association. American Heart Association Recommendations for Physical Activity in Adults [Internet] 2016 [cited 2003 Aug 20]. Available from: http://www.heart.org/HEARTORG/HealthyLiving/PhysicalActivity/FitnessBasics/American-Heart-Association-Recommendations-for-Physical-Activity-in-Adults_UCM_307976_Article.jsp#.WqF2eOjwbIV.
- 27.Doherty A, Jackson D, Hammerla N, Plötz T, Olivier P, Granat MH, et al. Large Scale Population Assessment of Physical Activity Using Wrist Worn Accelerometers: The UK Biobank Study. In: Buchowski M, editor. PLoS One [Internet] 2. Vol. 12. Public Library of Science; 2017. Feb 1, p. e0169649. [cited 2017 Apr, 17] [DOI] [PMC free article] [PubMed] [Google Scholar]
- 28.Hildebrand M, Van Hees VT, Hansen BH, Ekelund U. Age group comparability of raw accelerometer output from wrist-and hip-worn monitors. Med Sci Sports Exerc. 2014 doi: 10.1249/MSS.0000000000000289. [DOI] [PubMed] [Google Scholar]
- 29.Baecke JA, Burema J, Frijters JE. A short questionnaire for the measurement of habitual physical activity in epidemiological studies. Am J Clin Nutr. 1982;36(5):936–42. doi: 10.1093/ajcn/36.5.936. [DOI] [PubMed] [Google Scholar]
- 30.Folsom AR, Arnett DK, Hutchinson RG, Liao F, Clegg LX, Cooper LS. Physical activity and incidence of coronary heart disease in middle-aged women and men. Med Sci Sport Exerc. 1997;29(7):901–9. doi: 10.1097/00005768-199707000-00009. [DOI] [PubMed] [Google Scholar]
- 31.Richardson MT, Ainsworth BE, Wu HC, Jacobs DRJ, Leon AS. Ability of the Atherosclerosis Risk in Communities (ARIC)/Baecke Questionnaire to assess leisure-time physical activity. Int J Epidemiol England. 1995 Aug;24(4):685–93. doi: 10.1093/ije/24.4.685. [DOI] [PubMed] [Google Scholar]
- 32.Bycroft C, Freeman C, Petkova D, Band G, Elliott LT, Sharp K, et al. Genome-wide genetic data on ~500,000 UK Biobank participants. bioRxiv [Internet] 2017 Jul 20; [Google Scholar]
- 33.O’Connell J, Sharp K, Shrine N, Wain L, Hall I, Tobin M, et al. Haplotype estimation for biobank-scale data sets. Nat Genet. 2016 doi: 10.1038/ng.3583. [DOI] [PMC free article] [PubMed] [Google Scholar]
- 34.Consortium GP. Abecasis GR, Auton A, Brooks LD, DePristo MA, Durbin RM, et al. An integrated map of genetic variation from 1,092 human genomes. Nature [Internet] Nature Publishing Group. 2012;491(7422):56–65. doi: 10.1038/nature11632. [DOI] [PMC free article] [PubMed] [Google Scholar]
- 35.McCarthy S, Das S, Kretzschmar W, Delaneau O, Wood AR, Teumer A, et al. A reference panel of 64,976 haplotypes for genotype imputation. Nat Genet. 2016 doi: 10.1038/ng.3643. [DOI] [PMC free article] [PubMed] [Google Scholar]
- 36.UK10K Consortium. The UK10K project identifies rare variants in health and disease. Nature. 2015 doi: 10.1038/nature14962. [DOI] [PMC free article] [PubMed] [Google Scholar]
- 37.Galinsky KJ, Bhatia G, Loh PR, Georgiev S, Mukherjee S, Patterson NJ, et al. Fast Principal-Component Analysis Reveals Convergent Evolution of ADH1B in Europe and East Asia. Am J Hum Genet. 2016 doi: 10.1016/j.ajhg.2015.12.022. [DOI] [PMC free article] [PubMed] [Google Scholar]
- 38.Howie B, Marchini J, Stephens M, Chakravarti A. Genotype Imputation with Thousands of Genomes. G3 GenesGenomesGenetics [Internet] Genetics Society of America. 2011;1(6):457–70. doi: 10.1534/g3.111.001198. [DOI] [PMC free article] [PubMed] [Google Scholar]
- 39.Townsend P. J Soc Policy [Internet] 2. Vol. 16. Cambridge University Press; 1987. Deprivation; pp. 125–46. 2009/01/01. [Google Scholar]
- 40.Smith GD, Whitley E, Dorling D, Gunnell D. Area based measures of social and economic circumstances: cause specific mortality patterns depend on the choice of index. J Epidemiol Community Health. 2001 doi: 10.1136/jech.55.2.149. [DOI] [PMC free article] [PubMed] [Google Scholar]
- 41.Loh P-R, Tucker G, Bulik-Sullivan BK, Vilhjalmsson BJ, Finucane HK, Salem RM, et al. Efficient Bayesian mixed-model analysis increases association power in large cohorts. Nat Genet United States. 2015 Mar;47(3):284–90. doi: 10.1038/ng.3190. [DOI] [PMC free article] [PubMed] [Google Scholar]
- 42.Loh P-R, Kichaev G, Gazal S, Schoech AP, Price AL. bioRxiv [Internet] Cold Spring Harbor Laboratory; 2017. Mixed model association for biobank-scale data sets. [Google Scholar]
- 43.Klarin D, Zhu QM, Emdin CA, Chaffin M, Horner S, McMillan BJ, et al. Genetic analysis in UK Biobank links insulin resistance and transendothelial migration pathways to coronary artery disease. Nat Genet United States. 2017 Sep;49(9):1392–7. doi: 10.1038/ng.3914. [DOI] [PMC free article] [PubMed] [Google Scholar]
- 44.Klarin D, Emdin CA, Natarajan P, Conrad MF, Kathiresan S. Circ Cardiovasc Genet [Internet] 2. Vol. 10. American Heart Association Inc; 2017. Genetic Analysis of Venous Thromboembolism in UK Biobank Identifies the ZFPM2 Locus and Implicates Obesity as a Causal Risk FactorCLINICAL PERSPECTIVE. [DOI] [PMC free article] [PubMed] [Google Scholar]
- 45.Fadista J, Manning AK, Florez JC, Groop L. The (in)famous GWAS P-value threshold revisited and updated for low-frequency variants. Eur J Hum Genet. 2016;24:1202–5. doi: 10.1038/ejhg.2015.269. [DOI] [PMC free article] [PubMed] [Google Scholar]
- 46.Yaghootkar H, Bancks MP, Jones SE, McDaid A, Beaumont R, Donnelly L, et al. Quantifying the extent to which index event biases influence large genetic association studies. Hum Mol Genet England. 2017 Mar;26(5):1018–30. doi: 10.1093/hmg/ddw433. [DOI] [PMC free article] [PubMed] [Google Scholar]
- 47.Saunders AM, Strittmatter WJ, Schmechel D, St George-Hyslop PH, Pericak-Vance MA, Joo SH, et al. Association of apolipoprotein E allele ε4 with late-onset familial and sporadic alzheimer’s disease. Neurology. 1993 doi: 10.1212/wnl.43.8.1467. [DOI] [PubMed] [Google Scholar]
- 48.Lahoz C, Schaefer EJ, Cupples LA, Wilson PW, Levy D, Osgood D, et al. Apolipoprotein E genotype and cardiovascular disease in the Framingham Heart Study. Atherosclerosis Ireland. 2001 Feb;154(3):529–37. doi: 10.1016/s0021-9150(00)00570-0. [DOI] [PubMed] [Google Scholar]
- 49.Eichner JE, Dunn ST, Perveen G, Thompson DM, Stewart KE, Stroehla BC. Apolipoprotein E polymorphism and cardiovascular disease: a HuGE review. Am J Epidemiol United States. 2002 Mar;155(6):487–95. doi: 10.1093/aje/155.6.487. [DOI] [PubMed] [Google Scholar]
- 50.Tingley D, Yamamoto T, Hirose K, Keele L, Imai K. Mediation: R Package for Causal Mediation Analysis. J Stat Softw [Internet] 2014;59(5):1–38. [Google Scholar]
- 51.Team RDC. R: A language and environment for statistical computing. 2011 [Google Scholar]
- 52.Chyou PH. A simple and robust way of concluding meta-analysis results using reported P values, standardized effect sizes, or other statistics. Clin Med Res. 2012:219–23. doi: 10.3121/cmr.2012.1068. [DOI] [PMC free article] [PubMed] [Google Scholar]
- 53.Watanabe K, Taskesen E, van Bochoven A, Posthuma D. FUMA: Functional mapping and annotation of genetic associations. bioRxiv. 2017 Feb; doi: 10.1038/s41467-017-01261-5. [DOI] [PMC free article] [PubMed] [Google Scholar]
- 54.Consortium TGte. The Genotype-Tissue Expression (GTEx) pilot analysis: Multitissue gene regulation in humans. Sci [Internet] 2015 May 8;348(6235):648–60. doi: 10.1126/science.1262110. [DOI] [PMC free article] [PubMed] [Google Scholar]
- 55.de Leeuw CA, Mooij JM, Heskes T, Posthuma D. MAGMA: Generalized Gene-Set Analysis of GWAS Data. In: Tang H, editor. PLOS Comput Biol [Internet] 4. Vol. 11. Public Library of Science; 2015. Apr 17, p. e1004219. [cited 2018 Mar 5] [DOI] [PMC free article] [PubMed] [Google Scholar]
- 56.Zheng J, Erzurumluoglu AM, Elsworth BL, Kemp JP, Howe L, Haycock PC, et al. LD Hub: a centralized database and web interface to perform LD score regression that maximizes the potential of summary level GWAS data for SNP heritability and genetic correlation analysis. Bioinformatics [Internet] 2017;33(2):272. doi: 10.1093/bioinformatics/btw613. [DOI] [PMC free article] [PubMed] [Google Scholar]
- 57.Bulik-Sullivan B, Finucane HK, Anttila V, Gusev A, Day FR, Loh PR, et al. An atlas of genetic correlations across human diseases and traits. Nat Genet. 2015;47(11):1236–41. doi: 10.1038/ng.3406. [DOI] [PMC free article] [PubMed] [Google Scholar]
- 58.Bulik-Sullivan BK, Loh P-R, Finucane HK, Ripke S, Yang J, Consortium SWG of the PG et al. Nat Genet [Internet] 3. Vol. 47. Nature Publishing Group a division of Macmillan Publishers Limited; 2015. Mar, LD Score regression distinguishes confounding from polygenicity in genome-wide association studies; pp. 291–5. All Rights Reserved. [DOI] [PMC free article] [PubMed] [Google Scholar]
- 59.Elliott L, Sharp K, Alfaro-Almagro F, Douaud G, Miller K, Marchini J, et al. bioRxiv [Internet] Cold Spring Harbor Laboratory; 2017. The genetic basis of human brain structure and function: 1,262 genome-wide associations found from 3,144 GWAS of multimodal brain imaging phenotypes from 9,707 UK Biobank participants. [Google Scholar]
- 60.Locke AE, Kahali B, Berndt SI, Justice AE, Pers TH, Day FR, et al. Nature [Internet] 7538. Vol. 518. Nature Publishing Group a division of Macmillan Publishers Limited; 2015. Feb 12, Genetic studies of body mass index yield new insights for obesity biology; pp. 197–206. All Rights Reserved. [DOI] [PMC free article] [PubMed] [Google Scholar]
- 61.Speliotes EK, Willer CJ, Berndt SI, Monda KL, Thorleifsson G, Jackson AU, et al. Nat Genet [Internet] Vol. 42. Metabolism Initiative and Program in Medical and Population Genetics, Broad Institute; Cambridge, Massachusetts, USA: 2010. Nov, Association analyses of 249,796 individuals reveal 18 new loci associated with body mass index; pp. 937–48. 1546-1718 (Electronic) [DOI] [PMC free article] [PubMed] [Google Scholar]
- 62.Boutwell B, Hinds D, Tielbeek J, Ong KK, Day FR, Perry JRB. Replication and characterization of CADM2 and MSRA genes on human behavior. Heliyon England. 2017 Jul;3(7):e00349. doi: 10.1016/j.heliyon.2017.e00349. [DOI] [PMC free article] [PubMed] [Google Scholar]
- 63.Day FR, Helgason H, Chasman DI, Rose LM, Loh P-R, Scott RA, et al. Nat Genet [Internet] 6. Vol. 48. Nature Publishing Group a division of Macmillan Publishers Limited; 2016. Jun, Physical and neurobehavioral determinants of reproductive onset and success; pp. 617–23. All Rights Reserved. [DOI] [PMC free article] [PubMed] [Google Scholar]
- 64.Strawbridge RJ, Ward J, Cullen B, Tunbridge EM, Hartz S, Bierut L, et al. Genome-wide analysis of risk-taking behaviour and cross-disorder genetic correlations in 116,255 individuals from the UK Biobank cohort. bioRxiv [Internet] 2017 Aug 16; doi: 10.1038/s41398-017-0079-1. [DOI] [PMC free article] [PubMed] [Google Scholar]
- 65.Clarke T-K, Adams MJ, Davies G, Howard DM, Hall LS, Padmanabhan S, et al. Genome-wide association study of alcohol consumption and genetic overlap with other health-related traits in UK Biobank (N=112 117) Mol Psychiatry England. 2017 Oct;22(10):1376–84. doi: 10.1038/mp.2017.153. [DOI] [PMC free article] [PubMed] [Google Scholar]
- 66.Ibrahim-Verbaas CA, Bressler J, Debette S, Schuur M, Smith AV, Bis JC, et al. Mol Psychiatry. Macmillan Publishers Limited; 2016. GWAS for executive function and processing speed suggests involvement of the CADM2 gene [Internet] pp. 189–97. [DOI] [PMC free article] [PubMed] [Google Scholar]
- 67.Yan X, Wang Z, Schmidt V, Gauert A, Willnow TE, Heinig M, et al. Mol Metab [Internet] Elsevier GmbH; 2017. Cadm2 regulates body weight and energy homeostasis in mice; pp. 1–9. [DOI] [PMC free article] [PubMed] [Google Scholar]
- 68.Pericak-Vance MA, Bebout JL, Gaskell PC, Jr, Yamaoka LH, Hung WY, Alberts MJ, et al. Linkage studies in familial Alzheimer disease: evidence for chromosome 19 linkage. Am J Hum Genet. 1991 [PMC free article] [PubMed] [Google Scholar]
- 69.Thompson PD, Tsongalis GJ, Seip RL, Bilbie C, Miles M, Zoeller R, et al. Apolipoprotein e genotype and changes in serum lipids and maximal oxygen uptake with exercise training. Metabolism [Internet] 2004 Feb;53(2):193–202. doi: 10.1016/j.metabol.2003.09.010. [cited 2017 Aug 16] [DOI] [PubMed] [Google Scholar]
- 70.Dudbridge F, Fletcher O. Gene-environment dependence creates spurious gene-environment interaction. Am J Hum Genet United States. 2014 Sep;95(3):301–7. doi: 10.1016/j.ajhg.2014.07.014. [DOI] [PMC free article] [PubMed] [Google Scholar]
- 71.Lee H, Ash GI, Angelopoulos TJ, Gordon PM, Moyna NM, Visich PS, et al. Obesity-Related Genetic Variants and their Associations with Physical Activity [Internet] Sport Med Open. 2015:34. doi: 10.1186/s40798-015-0036-6. [DOI] [PMC free article] [PubMed] [Google Scholar]
- 72.Richmond RC, Davey Smith G, Ness AR, den Hoed M, McMahon G, Timpson NJ. Assessing Causality in the Association between Child Adiposity and Physical Activity Levels: A Mendelian Randomization Analysis. PLoS Med. 2014 doi: 10.1371/journal.pmed.1001618. [DOI] [PMC free article] [PubMed] [Google Scholar]
- 73.Day FR, Loh P-R, Scott RA, Ong KK, Perry JR. Am J Hum Genet [Internet] 2. Vol. 98. Elsevier; 2016. Feb 4, A Robust Example of Collider Bias in a Genetic Association Study; pp. 392–3. [DOI] [PMC free article] [PubMed] [Google Scholar]
- 74.Aschard H, Vilhjalmsson BJ, Joshi AD, Price AL, Kraft P. Adjusting for heritable covariates can bias effect estimates in genome-wide association studies. Am J Hum Genet United States. 2015 Feb;96(2):329–39. doi: 10.1016/j.ajhg.2014.12.021. [DOI] [PMC free article] [PubMed] [Google Scholar]
- 75.Vink JM, Boomsma DI, Medland SE, de Moor MHM, Stubbe JH, Cornes BK, et al. Variance components models for physical activity with age as modifier: a comparative twin study in seven countries. Twin Res Hum Genet England. 2011 Feb;14(1):25–34. doi: 10.1375/twin.14.1.25. [DOI] [PubMed] [Google Scholar]
- 76.Shungin D, Winkler T, Croteau-Chonka D, Ferreira T, Mägi R, Lakka T, et al. New genetic loci link adipose and insulin biology to body fat distribution. Nature. 2015;518(7538):187–96. doi: 10.1038/nature14132. [DOI] [PMC free article] [PubMed] [Google Scholar]
- 77.Large-scale genome-wide association analysis of bipolar disorder identifies a new susceptibility locus near ODZ4. Nat Genet United States. 2011 Sep;43(10):977–83. doi: 10.1038/ng.943. [DOI] [PMC free article] [PubMed] [Google Scholar]
- 78.Biological insights from 108 schizophrenia-associated genetic loci. Nature England. 2014 Jul;511(7510):421–7. doi: 10.1038/nature13595. [DOI] [PMC free article] [PubMed] [Google Scholar]
- 79.Sniekers S, Stringer S, Watanabe K, Jansen PR, Coleman JRI, Krapohl E, et al. Genome-wide association meta-analysis of 78,308 individuals identifies new loci and genes influencing human intelligence. Nat Genet United States. 2017 Jul;49(7):1107–12. doi: 10.1038/ng.3869. [DOI] [PMC free article] [PubMed] [Google Scholar]
- 80.Jones SE, Tyrrell J, Wood AR, Beaumont RN, Ruth KS, Tuke MA, et al. Genome-Wide Association Analyses in 128,266 Individuals Identifies New Morningness and Sleep Duration Loci. PLoS Genet United States. 2016 Aug;12(8):e1006125. doi: 10.1371/journal.pgen.1006125. [DOI] [PMC free article] [PubMed] [Google Scholar]
Associated Data
This section collects any data citations, data availability statements, or supplementary materials included in this article.