

Abstract
The pro-oncogenic kinase PKCε is overexpressed in human prostate cancer and cooperates with loss of the tumor suppressor Pten for the development of prostatic adenocarcinoma. However, the effectors driving PKCε-mediated phenotypes remain poorly defined. Here, using cellular and mouse models, we showed that PKCε overexpression acts synergistically with Pten loss to promote NF-κB activation and induce cyclooxygenase-2 (COX-2) expression, phenotypic traits which are also observed in human prostate tumors. Targeted disruption of PKCε from prostate cancer cells impaired COX-2 induction and PGE2 production. Notably, COX-2 inhibitors selectively killed prostate epithelial cells overexpressing PKCε, and this ability was greatly enhanced by Pten loss. Long-term COX-2 inhibition markedly reduced adenocarcinoma formation as well as angiogenesis in a mouse model of prostate-specific PKCε expression and Pten loss. Overall, our results provide strong evidence for the involvement of the canonical NF-κB pathway and its target gene COX2 as PKCε effectors, and highlight the potential of PKCε as a useful biomarker for the use of COX inhibition for chemopreventive and/or chemotherapeutic purposes in prostate cancer.
Keywords: PKCε, COX-2, NF-κB, Pten, prostate cancer
INTRODUCTION
Prostate cancer is the most commonly diagnosed form of cancer among men with an estimated 161,360 new cases in 2017 in the USA, and the third leading cause of cancer-related deaths in men (1). Emerging studies have recognized protein kinase C epsilon (PKCε), a member of the novel family of PKC isozymes, as a pro-oncogenic kinase and cancer biomarker (2–4). PKCε, a receptor for the phorbol ester tumor promoters and the lipid second messenger diacylglycerol (DAG), is up-regulated in multiple human cancers, including prostate cancer, and its activation has been linked to the anti-apoptotic, migratory, tumorigenic and metastatic activities (3–8). Up-regulated PKCε levels contribute to tumor formation and metastasis in the TRAMP prostate cancer mouse model (9). Transgenic PKCε overexpression in the mouse prostate under the control of a probasin (PB) promoter (PB-PKCε mice) developed prostatic intraepithelial neoplastic (PIN) preneoplastic lesions (10). Consistent with the previous studies showing NF-κB as a downstream PKC effector (11–16), PINs in PB-PKCε mice display a characteristic nuclear (activated) NF-κB staining (11). The NF-κB transcription factor plays key roles in tumor progression via the induction of pro-inflammatory, angiogenic, and tumorigenic genes, including COX-2, VEGF, and IL-6 (11, 17, 18). More recently, we found that PKCε cooperates with the loss of the tumor suppressor Pten for the formation of prostatic adenocarcinoma, an effect that is reflected in the hyperactivation of PI3K/Akt, Stat3, and Erk (19), however, the effects on NF-κB activation status and COX-2 expression remain to be determined.
Increased expression of cyclooxygenase-2 (COX-2), an enzyme that catalyzes the conversion of arachidonic acid to prostanoids, has been extensively linked to the progression of human malignancies, including prostate cancer (20–23). Cellular, animal and clinical studies have convincingly associated COX-2 up-regulation found in cancer cells with enhanced proliferation, migration, angiogenesis, inflammation, and metastatic dissemination (24–30). More importantly, elevated COX-2 expression in tumors has been linked to poor prognosis and overall reduced patient survival (24, 30–33). Prostaglandin E2 (PGE2), a COX-2 metabolite, has been shown to trigger the activation of tumorigenic and angiogenic signaling pathways, including in prostate cancer (30, 34, 35) (36, 37). Epidemiological studies for different cancer types have shown an association between intake of non-steroidal anti-inflammatory drugs (NSAIDs) that inhibit both COX-1 and COX-2 isozymes with reduced cancer risk and recurrence (27, 38–41). Moreover, selective COX-2 inhibitors such as celecoxib and rofecoxib, either alone or in combination with other agents, suppress prostate tumor growth and metastasis (42–47). Regardless of this, a major clinical study involving advanced metastatic prostate cancer patients (STAMPEDE trial) showed no additional benefit for celecoxib treatment in combination with hormone therapy (48), however this trial neither stratified patients based on COX-2 levels in tumors nor evaluated for the presence of oncogenic/tumor suppressing alterations (49). On the other hand, stratification of patients in a colorectal cancer study was able to establish prolonged survival from aspirin intake among patients with mutated PI3KCA gene but not with wild-type PIK3CA cancer (38). Likewise, it has been recently shown that aspirin decreases breast cancer cell viability and tumor forming ability in the context of mutant PI3K (50, 51). Considering both the importance of COX-2 in prostate cancer progression and the challenges met with the use of COX-2 inhibitors in clinical trials, it is desirable to identify other molecular biomarkers that can determine prostate cancer patients who would specifically be benefited from COX inhibition.
Here, using both cellular and animal models, we demonstrate a central role for PKCε in cooperation with the Pten loss as a mediator of COX-2 induction and PGE2 production in prostate cancer. Not only this, COX-2 inhibition markedly affects the biological responses and tumorigenic phenotypes driven by PKCε overexpression and Pten loss, thus highlighting the potential epidemiological and therapeutic implications of our studies.
RESULTS
PKCε overexpression, NF-κB hyperactivation and COX-2 up-regulation in human prostate cancer
We previously demonstrated that PKCε acts as an upstream positive regulator of NF-κB signaling in prostate cancer (11). Since COX2 is a well-known NF-κB-regulated gene, we began with investigating if there is any association between PKCε and COX-2 expression in prostate cancer. As we previously reported (11, 52), PKCε is highly expressed in androgen-independent prostate cancer cell lines (PC3, PC3-mL and DU145) compared to the androgen-dependent LNCaP, RWPE-1 (normal immortalized prostate epithelial) or RWPE-2 (Ras-transformed RWPE-1) cells. Up-regulated PKCε levels in aggressive prostate cancer cell lines correlate with both elevated COX-2 expression and nuclear translocation of NF-κB, a hallmark of NF-κB pathway activation (Fig. 1A). COX-2 mRNA levels in the different prostate cells showed a similar trend (Fig. 1B). Interestingly, immunohistochemical analysis using a human prostate tissue microarray revealed elevated PKCε, phospho-NF-κB (nuclear) and COX-2 staining in human prostate cancer relative to normal adjacent tissue (Figs. 1C and 1D). These results suggest an association between PKCε overexpression, COX-2 up-regulation, and NF-κB hyperactivation in human prostate cancer.
Figure 1. Expression of PKCε, NF-κB and COX-2 in prostate cancer.
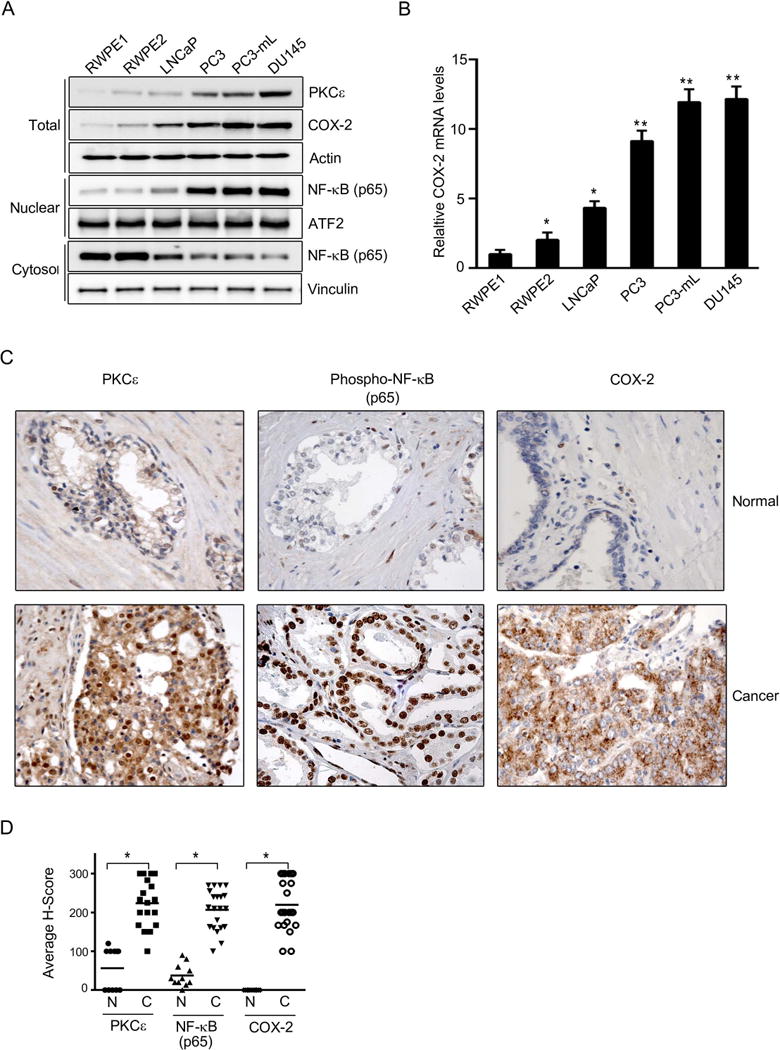
(A) PKCε, COX-2 and NF-κB p65 expression in total cell lysates, cytosolic and nuclear extracts was determined by Western blot. Actin, vinculin and ATF2 were used as loading controls for each fraction. The following cells were used: RWPE-1 (normal immortalized prostate epithelial), RWPE-2 (Ras-transformed RWPE-1 cells), LNCaP (androgen-dependent prostate cancer cells), PC3, PC3-mL and DU145 (androgen-independent prostate cancer cells).
(B) COX-2 mRNA levels in human prostate cancer cells, as determined by Q-PCR. Results normalized to RWPE-1 cells are expressed as mean ± S.D. of triplicate measurements. *, p< 0.05; **, p< 0.01 vs. RWPE-1.
(C) Immunohistochemical staining of PKCε, NF-κB p65 and COX-2 in prostate cancer specimens. Magnification: 40×. Representative photomicrographs for cancer samples and adjacent normal tissue are shown.
(D) H score is plotted for normal and cancer sample stainings of PKCε, NF-κB and COX-2 in the TMA. N, normal; C, cancer. *, p< 0.05.
PKCε mediates COX-2 activation in human prostate cancer cells
To determine if PKCε is involved in the control of COX-2 expression in prostate cancer cells, we first silenced PKCε in PC3-mL cells using two different RNAi duplexes. As seen in Fig 2A, PKCε RNAi depletion significantly reduced the constitutively up-regulated COX-2 mRNA levels and in consistence, it decreased PGE2 production, as determined by an enzyme immunoassay (EIA) using the conditioned medium.
Figure 2. PKCε mediates activation of COX-2 pathway in prostate cancer cells.
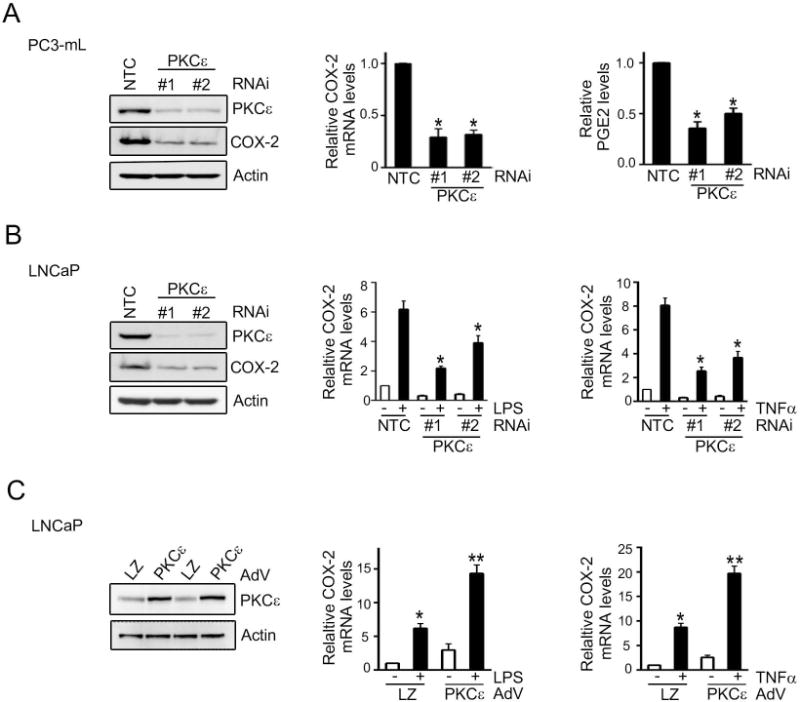
(A) PC3-mL cells were transfected with RNAi duplexes for PKCε (#1 and #2) or a non-target control (NTC). Left: PKCε levels were determined by Western blot. Middle: COX-2 mRNA levels were determined by Q-PCR. Right: PGE2 levels in the culture medium were assessed by enzyme immuno assay. Results were normalized to NTC.
(B) LNCaP cells were transfected with RNAi duplexes for PKCε (#1 and #2) or NTC, and 48 h later treated with LPS (5 μg/ml) or TNFα (10 ng/ml) for 4 h. COX-2 mRNA levels were determined by Q-PCR. Results expressed as fold-induction relative to NTC, vehicle treatment.
(C) LNCaP cells were infected with either PKCε or LacZ control (LZ) AdVs (MOI = 1 pfu/cell) and 24 h later treated with either LPS (5 μg/ml) or TNFα (10 ng/ml) for 4 h. COX-2 mRNA levels were determined by Q-PCR. Results were normalized to LZ, vehicle treatment.
In (A), (B), and (C), results were expressed as mean ± S.D. of triplicate measurements. *, p< 0.05 and **, p< 0.01. Similar results were observed in 2 additional experiments.
Next, we assessed the effect of PKCε RNAi depletion on TNFα- or LPS-induced COX-2 in LNCaP cells. These stimuli cause activation of NF-κB in LNCaP cells via PKCε (11). As shown in Fig. 2B, TNFα- or LPS-mediated induction of COX-2 was markedly reduced in PKCε-depleted LNCaP cells. PKCε RNAi was also found to reduce PGE2 induction (Fig. S1a). On the other hand, PKCε overexpression by means of an adenovirus (PKCε-AdV) in LNCaP cells potentiated the induction of COX-2 by TNFα or LPS (Fig. 2C). A similar effect was observed upon PKCε overexpression in RWPE-1 cells, although the magnitude of the induction was smaller in this case (Fig. S1b).
PKCε overexpression cooperates with Pten loss to mediate COX-2 activation
Prostate-specific PKCε transgenic mice (PB-PKCε) develop PIN lesions that display enhanced NF-κB pathway activation (11). Very recently, we characterized a mouse model for prostate-specific PKCε overexpression in a Pten haplodeficient background (PB-PKCε;Pten+/− mice), which in addition to PIN lesions also develops prostatic adenocarcinoma, in some cases with invasive features (19). Hence, to address whether PKCε overexpression cooperates with Pten loss for COX-2 induction in vivo, we analyzed COX-2 expression in prostates from these mouse models. PIN lesions from PB-PKCε, Pten+/− and PB-PKCε;Pten+/− mice displayed increased staining for COX-2 compared to wild-type mice prostates (Fig 3A). Notably, adenocarcinomas from PB-PKCε;Pten+/− mice showed remarkably higher COX-2 staining, and in addition, they displayed a prominent and almost exclusive nuclear phospho-NF-κB staining, in concordance with the findings in human prostate cancer cells and specimens (Fig. 1). Thus, loss of the tumor suppressor Pten cooperates with PKCε for COX-2 induction and NF-κB hyperactivation in vivo.
Figure 3. PKCε overexpression and Pten loss cooperate for COX-2 induction.
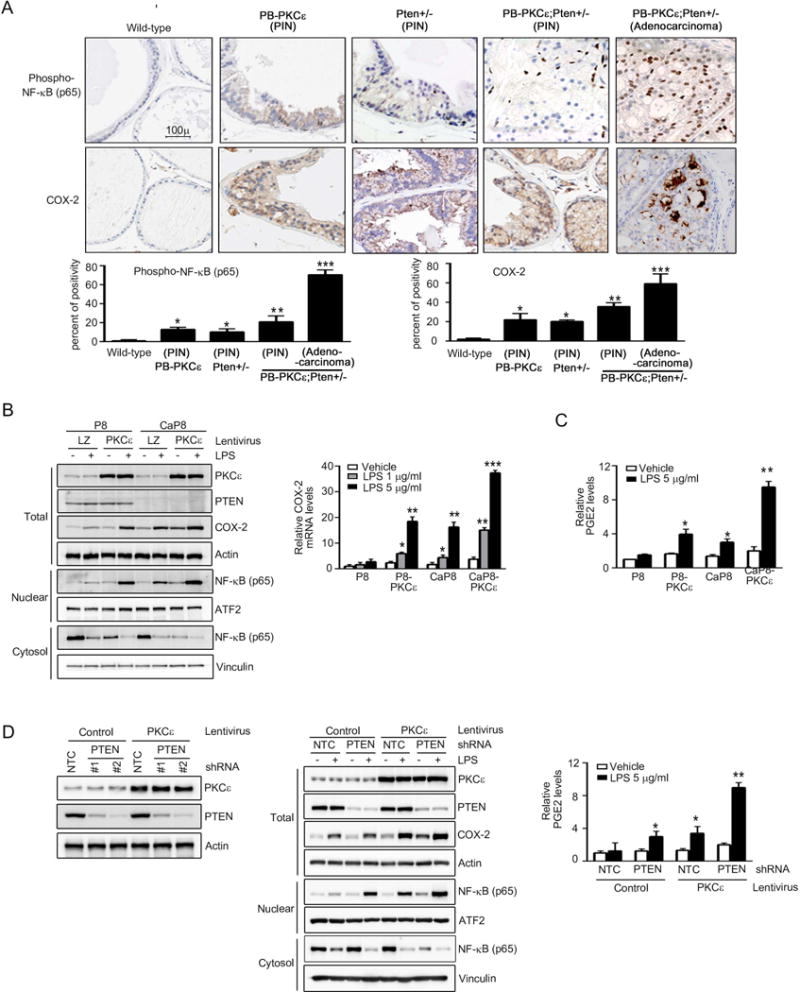
(A) Top: Phospho-NF-κB p65 and COX-2 immunohistochemical staining in prostates from 12 month-old PB-PKCε, Pten+/−, PB-PKCε;Pten+/−, or wild-type (FVB/N) mice. Representative figures are shown. Magnification: 20×. Bottom: Quantification. Numbers are percent of positivity. *, p< 0.05, **, p< 0.01 and ***, p< 0.001.
(B) P8 and CaP8 cells with or without stable PKCε overexpression (achieved by infection with PKCε lentivirus) were treated with either LPS or vehicle for 4 h. Left: PKCε, COX-2 and NF-κB p65 expression in total cell lysates, cytosolic and nuclear extracts was determined by Western blot. Actin, vinculin and ATF2 were used as loading controls for each fraction. Right: COX-2 mRNA levels, as determined by Q-PCR, normalized to vehicle treated parental P8 cells. LZ, LacZ lentivirus.
(C) PGE2 levels in the culture medium assessed by enzyme immune assay, normalized to vehicle treated parental P8 cells.
(D) Left: RWPE-1 cells subject to PKCε overexpression or control (achieved by lentiviral means) were subject to stable Pten depletion using shRNA lentiviruses. A representative Western blot is shown. Middle: Cells were treated with LPS (5 μg/ml) or vehicle for 4 h. PKCε, COX-2 and NF-κB p65 expression in total cell lysates, cytosolic and nuclear extracts was determined by Western blot. Right: PGE2 levels in the culture medium, normalized to vehicle treated NTC control cells.
In (B), (C), and (D), results were expressed as mean ± S.D. of triplicate measurements. *, p< 0.05, **, p< 0.01 and ***, p< 0.001. Similar results were observed in 2 additional experiments.
To corroborate these effects in a cellular context, we took advantage of prostate epithelial murine cell lines derived from the Pten knock-out mice (53). Parental (P8) and Pten-null (CaP8) cell lines engineered to overexpressed PKCε (P8-PKCε and CaP8-PKCε, respectively) (19) were treated with LPS and assessed for COX-2 expression and NF-κB activation by Western blot. As shown in Fig. 3B (left panel), COX-2 induction by LPS was higher in cells overexpressing PKCε (P8-PKCε) or lacking Pten (CaP8) compared to the parental P8 cells. Most important, Pten-null cells subjected to PKCε overexpression (CaP8-PKCε) displayed the highest COX-2 induction by LPS. A similar profile was observed when COX-2 mRNA levels were determined by Q-PCR (Fig. 3B, right panel). The expression patterns of COX-2 in these cell lines correlate with those of nuclear NF-κB expression. Indeed, CaP8-PKCε cells displayed the highest nuclear NF-κB levels in response to LPS stimulation (Fig. 3B, left panel). Similar results were observed when we measured LPS-induced PGE2 production in these cells (Fig. 3C).
To further validate the cooperation of PKCε with Pten loss in a human prostate cell model, we developed the corresponding model using RWPE-1 cells subject to Pten depletion and/or PKCε overexpression (with a PKCε lentivirus) (Fig. 3D, left panel). Interestingly, overexpression of PKCε and loss of Pten in RWPE-1 cells, showed significant induction of COX-2 expression, nuclear NF-κB expression (Fig. 3D, middle panel) and PGE2 production (Fig. 3D, right panel).
To further scrutinize deeply the pathways regulating COX-2 activation in response to PKCε overexpression and/or Pten loss, we initially used the established pharmacological inhibitors. PC3-mL cells, which express high PKCε levels and are Pten null (Fig. 1), were treated with GF109203X (pan-PKC inhibitor), BKM120 (PI3K inhibitor), BX795 (an inhibitor of PDK1, a PI3K-dependent kinase acting upstream of PKCs), parthenolide or wedelolactone (NF-κB inhibitors). A significant reduction in COX-2 mRNA (Fig. 4A, left panel) and protein levels (Fig. 4A, right panel) was observed upon inhibition of PKC, NF-κB or PI3K, whereas no effect was observed with the PDK1 inhibitor. Similar results were observed in LPS-treated CaP8-PKCε cells (Fig. 4B). LPS-stimulated COX-2 up-regulation in RWPE-1 cells overexpressing PKCε and subject to Pten depletion was also found to be susceptible to GF109203X, BKM120, parthenolide or wedelolactone treatments (Fig. S2). These results confirmed the requirement of NF-κB for COX-2 induction in cell lines that express high PKCε levels and have Pten loss.
Figure 4. The canonical NF-κB pathway mediates COX-2 induction in PKCε overexpressing, Pten depleted prostate cells.
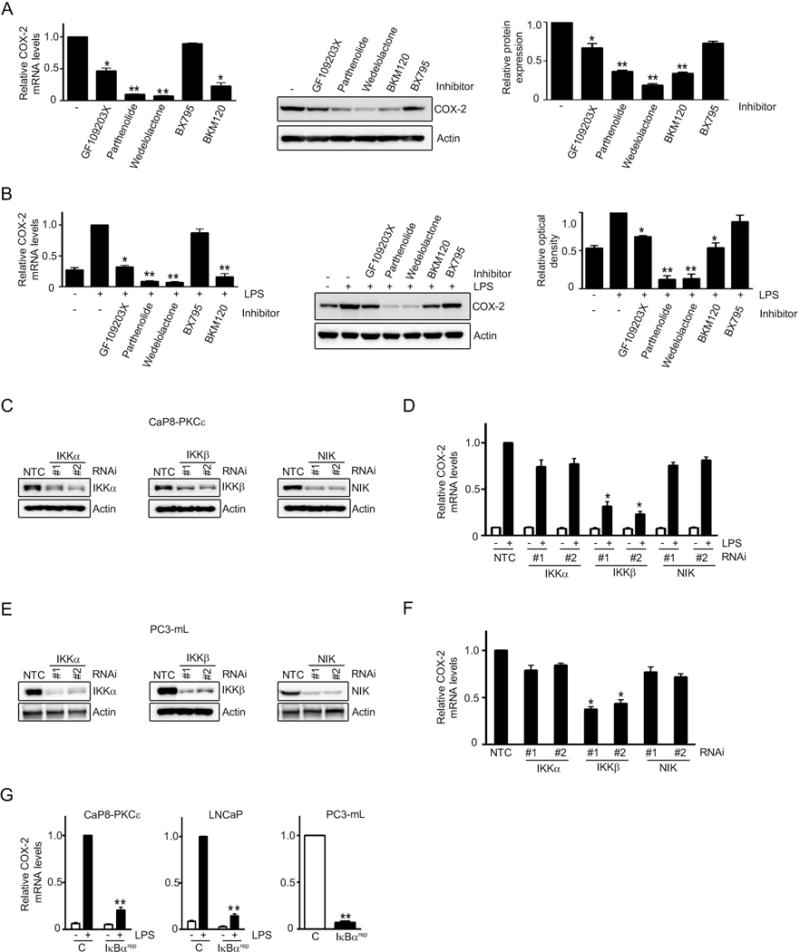
(A) Effect of GFX (0.5 μM), parthenolide (2.5 μM), wedelolactone (10 μM), BX795 (5 μM), and BKM120 (0.3 μM) treatment for 16 h on COX-2 expression in PC3-mL cells. Left: COX-2 mRNA levels, as determined by Q-PCR, normalized to untreated cells. Middle: COX-2 protein levels, as determined by Western blot. Right: Densitometric analysis of COX-2 expression from Western blots.
(B) Murine CaP8-PKCε cells were treated with LPS (5 μg/ml, 4 h) in the presence of different inhibitors. Left: COX-2 mRNA levels, normalized to LPS, no inhibitor. Right: COX-2 protein levels as determined by Western blot, relative to LPS-treated cells, no inhibitor.
(C) IKKα, IKKβ, and NIK RNAi depletion in CaP8-PKCε cells was achieved using two different RNAi duplexes in each case. NTC, non-target control RNAi.
(D) Effect of IKKα, IKKβ, and NIK RNAi depletion on COX-2 mRNA induction by LPS in CaP8-PKCε cells. Results were normalized to NTC, + LPS.
(E) IKKα, IKKβ, and NIK RNAi depletion in PC3-mL cells was achieved using two different RNAi duplexes in each case. NTC, non-target control RNAi.
(F) Effect of IKKα, IKKβ, and NIK RNAi depletion in PC3-mL cells on COX-2 mRNA expression. Results were normalized to NTC.
(G) The indicated cells were transfected with a plasmid encoding the IκBα “super-repressor” (IκBαrep) and 24 h later stimulated with either LPS (5 μg/ml) or vehicle for 4 h. COX-2 mRNA levels were normalized to LPS-treated control cells (CaP8-PKCε and LNCaP cells) or untreated control cells (PC3-mL cells).
In (A), (B), (D), (F) and (G), results were expressed as mean ± S.D. of triplicate measurements. *, p< 0.05 and **, p< 0.01. Similar results were observed in two additional experiments.
Next, we silenced IKKβ and IKKα, the key components of canonical and non-canonical NF-κB pathways respectively, in CaP8-PKCε cells (Fig. 4C). As seen in Fig. 4D, LPS-stimulated COX-2 mRNA expression in CaP8-PKCε cells was significantly reduced upon IKKβ RNAi depletion whereas only a marginal inhibitory effect was observed in IKKα-depleted cells. Likewise, silencing NIK (Fig. 4C), a kinase associated with the non-canonical NF-κB cascade, also failed to abridge COX-2 induction by LPS (Fig. 4D). Similar results were observed in PC3-mL cells (Figs. 4E and 4F). To further confirm the major role of the canonical NF-κB pathway in COX-2 up-regulation, we found that the IκBα super-repressor (IκBαrep) (11) blunted the COX-2 induction by LPS both in CaP8-PKCε and LNCaP cells, as well as reduced the COX-2 expression in PC3-mL cells (Fig. 4G). Results thus demonstrate a necessary role of the canonical NF-κB pathway in COX-2 up-regulation in prostate cancer cells.
COX-2 is implicated in PKCε-mediated prostate cancer cell growth, survival, and migration
Crucial roles for PKCε have been assigned in the survival, growth, and migration of prostate cancer cells (5, 9, 10, 19). In addition, several reports showed that selective COX-2 inhibitors suppress invasion, angiogenesis and prostate cancer growth in vivo, as well as induce an apoptotic response (42, 44, 46, 47, 54, 55). To determine if the effect of COX-2 inhibition is causally related to the PKCε expression levels, we first examined the effect of COX-2 inhibitor NS398 on the viability of P8/CaP8 cell models subjected to PKCε overexpression at different time points (24-72 h). Interestingly, whereas parental P8 cells were essentially insensitive to NS398, a reduction in viability was observed in P8-PKCε cells, an effect that became more pronounced at longer times of treatment (72 h). NS398 had a relatively smaller effect on the viability of CaP8 cells, however CaP8-PKCε cells were highly sensitive, suggesting that expression levels of PKCε, particularly in the absence of Pten, sensitize cells to the effect of COX-2 inhibition (Fig. 5A). Comparable results were observed with another COX-2 inhibitor, rofecoxib (Fig. 5B). The effects of the COX-2 inhibitors were similar in human RWPE-1 cells subjected to Pten RNAi depletion and PKCε lentiviral overexpression (Fig. S3). Analysis of the key apoptotic markers in response to NS398 revealed that both PKCε overexpression and Pten loss cooperate for the induction of Bax, PARP cleavage, caspase-3 cleavage, and cytochrome C release, with a concomitant reduction in Bcl2 levels (Fig. 5C). CaP8-PKCε cells display the highest Bax/Bcl2 ratio relative to P8-PKCε, CaP8, and P8 cells (Fig. 5D). Therefore, the sensitivity to the killing effect of COX-2 inhibitors is determined by the expression levels of both PKCε and Pten, which as described above also markedly influence COX-2 expression in human prostate cancer cells.
Figure 5. Differential sensitivity of PKCε overexpressing and Pten-depleted prostate epithelial cells to COX-2 inhibitors.
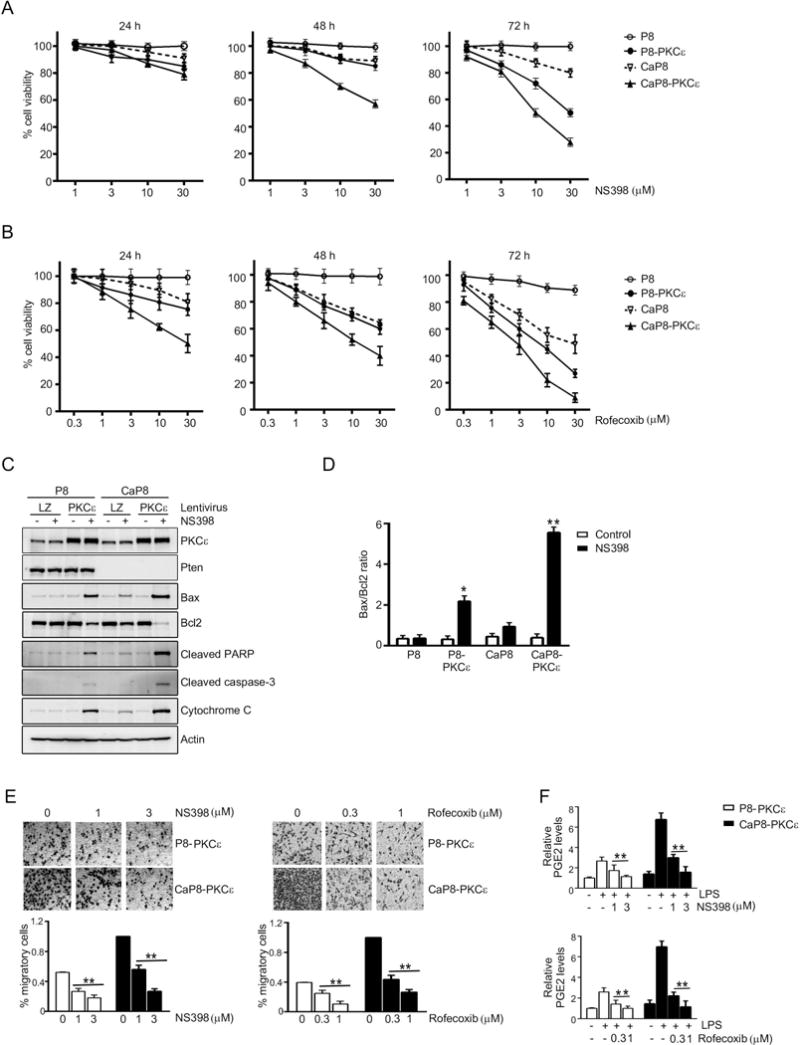
(A) P8 and CaP8 cells with or without stable PKCε overexpression were treated with different concentrations of NS398, and cell viability was determined after 24, 48, or 72 h of treatment using the MTT assay.
(B) P8 and CaP8 cells with or without stable PKCε overexpression were treated with different concentrations of rofecoxib, and cell viability was determined after 24, 48, or 72 h of treatment using the MTT assay.
(C) Cells were treated with NS398 (30 μM, 24 h), and subjected to Western blot analysis of the indicated apoptotic markers.
(D) Bax/Bcl2 ratio was determined after densitometric analysis of Western blot of Bax and Bcl2 protein. *, p< 0.05 and **, p< 0.01 vs. control.
(E) Migration of P8-PKCε and CaP8-PKCε cells after treatment with different concentrations of NS398 or rofecoxib was determined using a Boyden chamber. Top: Representative images. Bottom: Quantification of migrating cells. **, p< 0.01 vs. untreated (no treatment of NS398 or rofecoxib).
(F) Effect of NS398 or rofecoxib on PGE2 levels in the culture medium, as determined by enzyme immune assay. **, p< 0.01 vs. LPS, no NS398 or rofecoxib.
In (A), (B), (D), (E), and (F), results were expressed as mean ± S.D. of triplicate measurements. Similar results were observed in two additional experiments.
It was also observed that both NS398 and rofecoxib dose-dependently decreased the cell migration in PKCε overexpressing cells, both in Pten-positive and Pten-null backgrounds (Fig 5E). For the migration experiment, we have used doses of NS398 (1-3 μM) and rofecoxib (0.3-1 μM) that inhibited the PGE2 production (Fig. 5F) without causing appreciable cell death in 24 h (Figs. 5A, 5B, and S3).
COX-2 inhibition impairs tumorigenicity of Pten-depleted, PKCε overexpressing prostate cells
As CaP8-PKCε cells are highly sensitive to the effects of COX-2 inhibitors in culture, we next aimed to ascertain if COX-2 inhibition influences their tumorigenic capacity. In the first set of experiments, nude mice were fed with rofecoxib diet starting from 7 days before s.c. cell inoculation. Fig. 6A shows that essentially no tumor growth could be observed in mice fed with rofecoxib diet, whereas those mice that received control diet developed tumors, which reached ~600 mm3 at 30 days after inoculation. Similar results were obtained by pretreating mice with the NF-κB inhibitor parthenolide (Fig. S4).
Figure 6. COX-2 inhibition impairs PKCε driven tumorigenicity.
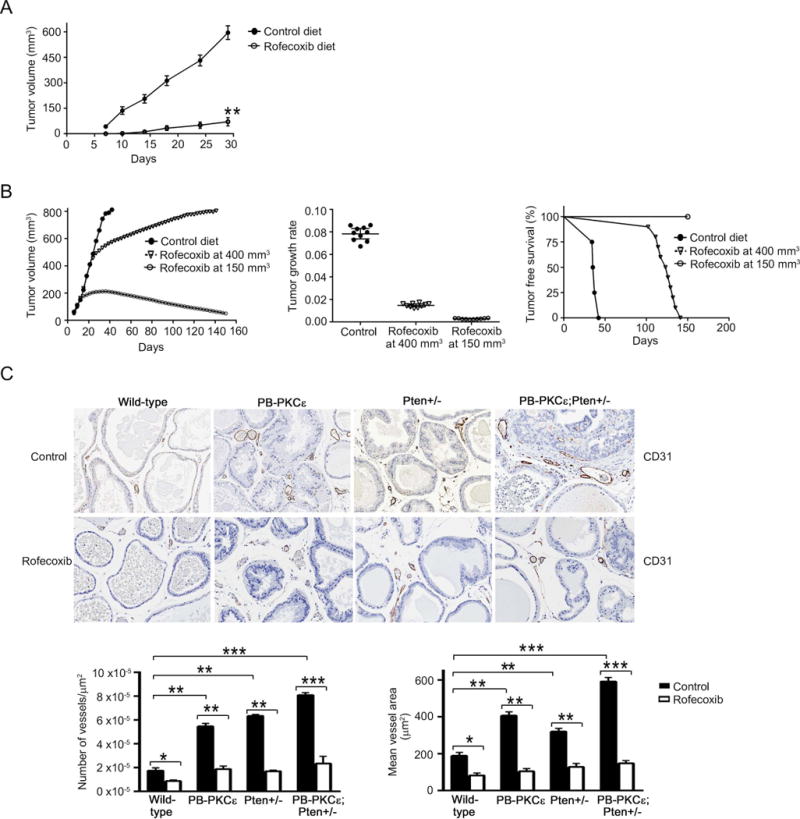
(A) Male athymic nude mice were fed with either control laboratory or rofecoxib diet. Following 7 days of the start of the dietary regimen, CaP8-PKCε cells were injected s.c. into the left flank of the nude mice and tumor growth was monitored for 30 days. Results were expressed as mean ± S.D. (n= 8 mice/group).
(B) CaP8-PKCε cells were injected s.c. into the left flank of the nude mice. When the tumor reached either 150 mm3 or 400 mm3, mice were randomly divided into groups that received either control or rofecoxib diet. Left: Tumor volume, expressed as mean ± S.D. (n= 10 mice/group). Middle: Tumor growth was analyzed for a period of 33 days. For this analysis, tumor volume was measured every three days. Data were represented on a semilogarithmic scale and fitted by linear regression. Slopes for each growth curve are represented (P = 0.089, Mann Whitnet U-test). Right: Kaplan-Meier plot for tumor-free survival. ***, p< 0.001, log rank test.
(C) Top: CD-31 staining in prostates from 12-month-old transgenic mice fed with either control or rofecoxib diet for 6 months. Representative figures are shown. Magnification: 10×. Bottom left panel: Quantification of number of vessels/μm2. Bottom right panel: Quantification of mean vessel area (μm2). Results were expressed as mean ± S.D. (n=10). *, p< 0.05; **, p< 0.01.
In the second set of experiments, rofecoxib treatment was initiated after tumors had formed, and when they reached volumes of either 150 mm3 or 400 mm3. A significant regression in tumor growth was noticed in the first case, while when fed after tumor grew 400 mm3, rofecoxib produced a significant delay in tumor growth (Fig. 6B, left panel). Most importantly, in either case, rofecoxib treatment reduced the overall tumor growth rate (Fig. 6B, middle panel) and led to enhanced survival of mice (Fig. 6B, right panel). No significant changes in the body weights were detected amongst the different groups (data not shown). These results clearly show that COX-2 inhibition impairs the tumorigenic capacity of CaP8-PKCε cells and regress tumor growth, particularly if administered at an early stage.
COX-2 inhibition impairs the development of PKCε-driven lesions
Finally, we investigated the effect of dietary treatment with a COX-2 inhibitor on the formation of prostate lesions in PB-PKCε, Pten+/−, and PB-PKCε;Pten+/− mice (Table 1). Mice were subjected to rofecoxib diet starting at 6 months of age, and sacrificed 6 months later. No diet related toxicity or appreciable weight differences were observed in any of the treatment groups (data not shown). PB-PKCε mice fed with control diet showed 93% and 53% incidence of low-grade and high-grade PIN lesions respectively at 12 months. A similar pattern was observed in Pten+/− mice (100% low-grade PINs and 70% high-grade PINs). Notably, the incidence of low-grade and high-grade PIN lesions observed in PB-PKCε;Pten+/− mice was 100%. In situ adenocarcinomas were only observed in PB-PKCε;Pten+/− mice, with an incidence of 86% at 12 months of age. Invasive adenocarcinomas were observed in 57% of PB-PKCε;Pten+/− mice, consistent with our previous study (19). Notably, rofecoxib diet reduced the formation of PIN lesions in PB-PKCε mice (32% and 49% inhibition for low- and high-grade PIN, respectively) and in Pten+/− mice (40% and 43% inhibition for low- and high-grade PIN, respectively). Rofecoxib treatment also affected the development of high-grade PIN lesions in PKCε;Pten+/− mice (67% inhibition). Most impressively, mice fed with the COX-2 inhibitor showed no signs of in-situ or invasive adenocarcinomas, indicating a prominent effect in the development of those lesions that, as shown in Fig. 3, display high COX-2 expression levels. Rofecoxib plasma concentrations in mice fed with rofecoxib (determined by mass spectrometry) (Fig. S5) were roughly in the same range as those observed in previous studies (56).
Table 1. Incidence of prostate lesions in mice subject to rofecoxib diet.
Six-months old wild- type, PB-PKCε, Pten+/− and PB-PKCε;Pten+/− mice were fed with either control or rofecoxib diet, and sacrificed at 12-months of age.
| Mouse Genotype | Treatment | Hyperplasia | Low-grade PIN | High- grade PIN | In situ adenocarcinoma | Invasive adenocarcinoma |
|---|---|---|---|---|---|---|
| Wild-type | Control | 7/8 (88%) | 2/8 (25%) | 0/8 (0%) | 0/8 (0%) | 0/8 (0%) |
| Rofecoxib | 5/8 (63%) | 2/8 (25%) | 0/8 (0%) | 0/8 (0%) | 0/8 (0%) | |
| PB-PKCε | Control | 15/15(100%) | 14/15(93%) | 8/15(53%) | 0/15 (0%) | 0/15 (0%) |
| Rofecoxib | 10/11 (91%) | 7/11 (64%) | 3/11 (27%) | 0/11 (0%) | 0/11 (0%) | |
| Pten+/− | Control | 10/10 (100%) | 10/10(100%) | 7/10 (70%) | 5/10 (50%) | 0/10 (0%) |
| Rofecoxib | 6/10 (60%) | 6/10 (60%) | 4/10 (40%) | 2/10 (20%) | 0/10 (0%) | |
| PB-PKCε; Pten+/− | Control | 7/7 (100%) | 7/7 (100%) | 7/7 (100%) | 6/7 (86%) | 4/7 (57%) |
| Rofecoxib | 9/9 (100%) | 9/9 (100%) | 3/9 (33%) | 0/9 (0%) | 0/9 (0%) |
Lastly, to assess a potential effect of COX-2 inhibition on angiogenesis, we stained for CD31, an endothelial marker. Prostates from PB-PKCε;Pten+/− mice displayed a significant angiogenic response, which was higher than in PB-PKCε or Pten+/− mice (Fig. 6C). This angiogenic response was confirmed by quantitative analysis of microvessel density and mean vessel area. Notably, rofecoxib dietary treatment significantly reduced the microvessel formation in the prostates from these mouse models. Thus, inhibition of COX-2 has a prominent inhibitory effect on angiogenic responses driven by PKCε overexpression and/or Pten loss.
DISCUSSION
Here, we established a functional association between PKCε and COX-2 for the progression of prostate cancer. PKCε overexpression is a signature of prostate cancer and other epithelial cancers, and plays important roles in prostate tumorigenesis and metastasis, as well as in the transition to androgen-independence (2, 57). The generation of preneoplastic lesions in a mouse model of prostate-specific overexpression of PKCε causally links this PKC to disease initiation. In addition, PKCε cooperates with the loss of the tumor suppressor Pten for the progression to invasive adenocarcinoma, arguing that it contributes to disease progression in a coordinated manner with other genetic alterations. Consistent with its role in cell survival, overexpression of PKCε in mice protects against apoptosis in response to androgen ablation (10, 19). The observed correlation between PKCε up-regulation, NF-κB activation, and COX-2 induction represents a novel link potentially targetable for prostate cancer.
Numerous studies established that COX-2 levels are elevated in human prostate adenocarcinoma (20, 23, 24). COX-2 is also up-regulated in preneoplastic PIN lesions and inflammatory benign prostatic hyperplasia (BPH), and its expression correlates with increased angiogenesis and a reduced apoptotic rate (58–60). COX-2 expression is higher in prostate tumors that metastasize and is linked to poor patient outcome (24). Not surprisingly, COX-2 inhibitors abrogate the development of prostate adenocarcinoma and metastatic dissemination in the TRAMP mouse model (45, 61), as well as the growth of androgen-independent prostate cancer cells in culture and xenograft models, both as monotherapy and in combination with chemotherapeutic agents (42, 46, 47). Consistent with the widespread evidence for a role of PGE2 in prostate cancer development, the suppressive growth effects of celecoxib are mediated by discrete members of EP receptors, particularly the PGE2 receptor EP2 (62, 63). Moreover, silencing the expression of microsomal mPGES-1 enzyme, a PGE synthase highly expressed in prostate cancer cells and tissues, reduces prostate xenograft tumor growth in nude mice and enhances apoptotic responses to genotoxic stress (36). Along the same line, our studies demonstrate that PKCε is a major inducer of PGE2 production. PKCε has been previously shown to control COX-2 expression in the myocardium, and more recently, to participate in COX-2 gene induction in cardiac myofibroblasts (64, 65). In addition to its role in tumorigenesis, PKCε is required for the motility of lung cancer cells (66). We have recently reported that PKCε overexpression in prostate epithelial cells increases their migratory capacity, an effect that is cooperatively enhanced by hyperactivation of the PI3K pathway caused by Pten loss (19). Notably, both NS398 and rofecoxib inhibit the migration of P8-PKCε and CaP8-PKCε cells, thus establishing COX-2 as a required effector for PKCε-driven motility. Whether PKCε is activated by PGE2 in prostate cancer cells remains to be determined. As EP receptors couple to the generation of DAG (the physiological activator of PKCε) and PI3K activation (67–69), one attractive scenario is that secreted PGE2 drives an autocrine vicious cycle by acting on its own receptors in prostate cancer cells. A similar PKCε/PI3K-mediated autocrine loop contributing to the high proliferative and migratory status of prostate cancer cells has been recently described for the chemokine CXCL13 and its receptor CXCR5 (19). Beyond the scope of this study, PGE2 and other pro-inflammatory mediators produced by stromal cells, such as macrophages, may also contribute to establishing a pro-tumorigenic microenvironment.
One of the remarkable findings of our study is that PKCε cooperates with Pten loss for the induction of NF-κB. Previously, we showed that PKCε activates genes regulated by the canonical NF-κB pathway, including COX2, VEGF, MMP9 and IL-6 (11). Notably, PKCε overexpression is sufficient to trigger NF-κB activation both in prostate epithelial cells in vitro and in vivo (11). Moreover, prostate adenocarcinomas in PB-PKCε;Pten+/− mice show an uniform nuclear NF-κB staining, suggestive of a robust activation of the NF-κB pathway, which is consistent with the pattern observed in human prostate tumors. Notably, pharmacological inhibition of the NF-κB pathway or silencing IKKβ, a key mediator of the canonical NF-κB signaling pathway, prevents COX-2 induction in PKCε-overexpressing/Pten depleted prostate epithelial cells. The canonical NF-κB pathway has been widely implicated in prostate cancer progression (11, 70, 71). We recently reported that PKCε overexpression in the context of Pten loss confers hyperactivation of the non-canonical NF-κB pathway to promote the secretion of key chemokines required for cell growth and motility (19). Thus, activation of both canonical and non-canonical NF-κB cascades by PKCε leads to significant phenotypical consequences, and this is markedly enhanced upon Pten loss. In support of this model, nuclear localization of both canonical and non-canonical NF-κB transcription factors correlates with patient’s Gleason scores (71).
Finally, our study may have significant implications for both prostate cancer chemoprevention and therapy. Regardless of the strong suppressive effects of COX-2 inhibitors in prostate tumor growth and metastasis in mouse models, the therapeutic value of these agents in prostate cancer patients remains uncertain. The addition of celecoxib to the established hormone therapy (STAMPEDE trial) shows no additional benefit for advanced metastatic prostate cancer patients. In addition to the various reasons accounted for the limited success of this trial (mixed population under study, advanced disease, pre-existing comorbidities, likely inadequate dosing, and duration of treatment), COX-2 expression status or the presence of other genetic alterations were not established in this patient cohort. On the other hand, in colon cancer, the use of aspirin after diagnosis was associated with a drastic reduction in overall mortality (~45%) and colorectal cancer-specific mortality (~80%) in patients with mutated PI3KCA gene, but not in patients with wild-type PI3KCA (38). More recently, Toker and coworkers demonstrated that aspirin in combination with PI3K inhibitors cause a significant growth suppression of PI3KCA/PTEN-mutant breast cancer cells (51). However, this growth suppression phenotype may be related to NF-κB/COX-2 independent effects mediated by AMPK activation and mTORC1 inhibition, a paradigm not yet explored in the context of prostate cancer. Since the killing effect of COX-2 inhibitors in prostate epithelial cells was greatly dependent on PKCε expression levels and Pten loss, factors that also drastically mediate COX-2 up-regulation, stratification of patients based on PKCε expression levels and PTEN/PI3KCA status may provide a beneficial outcome for personalized therapeutics with COX-2 inhibitors. As numerous trials suggested the potential chemotherapeutic value of aspirin in cancer patients (38–41, 72), our study also argue for the need of assessing the chemotherapeutic and therapeutic value of COX inhibition in prostate cancer patients in a personalized manner. Conceivably, a subset of patients stratified upon high PKCε expression and low PTEN levels (high PI3K activity) may potentially benefit from such therapeutic regime.
MATERIALS AND METHODS
Cell lines, cell culture, and reagents
Human prostate cancer cells (LNCaP, PC3 and DU145) and immortalized prostate epithelial RWPE-1 and RWPE-2 cells were obtained from ATCC (Rockville, MD) and cultured as detailed before (11). PC3-mL cells were obtained from Dr. Alessandro Fatatis (Drexel University), as previously described (73). The generation of murine prostate epithelial cell lines with PKCε stable overexpression (P8 and CaP8) has been previously described (19). Human RWPE-1 cells overexpressing PKCε were generated by infection with a PKCε lentivirus, followed by blasticidin selection (1.5 μg/ml). Stable Pten depletion in RWPE-1 cells was achieved using two different shRNA lentiviruses (Sigma), followed by puromycin selection (0.4 μg/ml).
Fetal bovine serum, PDGF, lipopolysaccharide (LPS) and TNFα were procured from Hyclone, R&D Systems, Sigma and PeproTech, respectively. Blasticidin and bovine pituitary extract were obtained from Life Technologies.
Western Blot analysis and fractionation
Cellular fractionation (total cell, cytosol and nuclear) and Western blot analysis were carried out as previously described (11). The following antibodies were used: anti-PKCε, anti-Bax, anti-Bcl2 (Santa Cruz Biotechnology Inc.), anti-Pten, anti-COX-2, anti-cytochrome C, anti-cleaved PARP, anti-cleaved Caspase 3 (Cell Signaling Technology), anti-vinculin, and anti-β-actin (Sigma). Anti-mouse or anti-rabbit secondary antibodies conjugated to horseradish peroxidase (Bio-Rad Laboratories) were used.
Cell viability assays
Cell viability assay were performed as previously described (19). Briefly, cells in 96-well plates (1-3 × 10³ cells/well) were treated with different concentrations of COX-2 inhibitors for 24-72 h. Viability was assessed using the MTT reagent.
Migration assays
Migration assays were performed using Boyden chambers as previously described (19). Cell motility in response to 5% FBS was determined in the presence of COX-2 inhibitors. Migration was assessed during a 24 h period, and concentration of COX-2 inhibitors was adjusted to be non-toxic and also to induce no changes in cell proliferation.
Adenoviral infections
Cells were infected with adenoviruses encoding PKCε or LacZ (control) at the indicated multiplicities of infection (MOIs), as previously reported (11). Experiments were carried out 24 h later.
RNA interference (RNAi)
For transient depletions, we used ON-TARGET Plus RNAi duplexes from Dharmacon. Control Negative Silencer® siRNA was from Ambion. RNAi duplexes were transfected using Lipofectamine RNAiMax (Invitrogen). After 48 h cells were serum starved where specified and used in the indicated experiments.
RNA isolation and real-time quantitative PCR (Q-PCR)
Total RNA from different cell lines was extracted and reverse transcribed as described (11). Real-time qPCR for COX-2 and 18S ribosomal RNA was performed using the inventoried gene expression assays and Taqman Universal PCR Master Mix (Applied Biosystems).
PGE2 measurements
Cells were seeded in 6-well plates (1-3 × 10⁵ cells/well) and serum starved for 16 h. Subsequently, cells were treated with LPS (5 μg/ml, 4 h). Culture medium was collected and used for PGE2 measurements by enzyme immune assay using the EIA kit (Cayman Chemical).
Mice experiments
CaP8-PKCε murine prostate cells (1 × 10⁶ cells mixed 1:1 with Matrigel, BD Bioscience) were inoculated into the flanks of 6-week old male athymic nude mice (Foxn1nu, Harlan Laboratories). Male mice received either regular laboratory diet (control) or a diet in which rofecoxib (Harlan Laboratories) was incorporated into the food pellets (rofecoxib diet). Diet treatment was initiated at different times: a) one week before cell inoculation; b) when tumors reached ~ 150 mm3 and c) when tumors reached ~ 400 mm3. Tumor volume was determined as described (19). In a different set of experiments, mice were treated with either the NF-κB inhibitor parthenolide (400 μM i.p., every other day) or vehicle (ethanol), one week before cell inoculation.
Prostate-specific PKCε transgenic mice (PB-PKCε), Pten+/−, and PB-PKCε;Pten+/− are described elsewhere (10, 19) Male mice were fed with rofecoxib starting at 6 months of age, and were sacrificed at 12 months of age. Determination of rofecoxib plasma concentrations was done by mass spectrometry, as previously described (56). All animal studies were carried out in strict accordance with IACUC institutional guidelines.
Immunohistochemistry
Immunohistochemical analysis on 5 μm thick paraffin-embedded mice prostate tissue sections was performed as described (10). The following primary antibodies (1:50 dilution) were used: anti-phospho-NF-κB (Santa Cruz Biotechnology), anti-COX-2 (Cayman), and anti-CD31 (Pharmingen). In the case of COX-2 and phospho-NF-κB stainings, sections were incubated with Envision plus system-HRP labeled polymer anti-rabbit (Dako) while in the case of CD31, after primary antibody treatment, sections were incubated with biotinylated secondary anti-rat antibody (Abcam) followed by peroxidase-conjugated avidin/biotin complex (vectastain ABC Kit, Vector laboratories). Reaction products in all cases were visualized using diaminobenzidine and Meyer’s hematoxylin counterstaining.
For immunohistochemical analysis of human specimens, we used a TMA with 20 cases, constructed at the Department of Pathology and Laboratory Medicine (University of Pennsylvania). Each case was represented in triplicate in order to account for variability. All 20 cases were anonymized and there was no association with patient information. Immunohistochemical stains were evaluated using a semiquantitative method. For calculation of the H score, the intensity of staining was graded on a scale of 0 to 3 with 0 being no staining and 3 being strongest staining. The percentage of tumor cells staining was calculated over 10 high power fields in the region over the entire tumor. The staining was normalized to compare different tumors by multiplying the intensity of staining with the percentage of tumor cells staining.
Statistical analysis
Sample sizes for cellular studies for each experimental condition were three in most cases, based on established reproducibility of the assays, and is indicated in figure legends. Experiments were replicated at least three times. Data were analyzed using either a Student’s t test or one-way analysis of variance (ANOVA) with post hoc testing. For tumor growth rate analysis, data were represented on a semi-logarithmic scale and fitted by linear regression. The number of animals per group, which were randomly selected, is indicated in the corresponding figure legend or table, and was estimated by power analysis. Sample analysis was carried blindly. Slopes for each growth curve were analyzed using a Mann Whitney U-test.
Supplementary Material
Acknowledgments
This work was supported by grants R01-CA089202, R01-CA189765, R01-CA196232 (NIH), and PC130641 (DOD) to M.G.K., and W81XWH-12-1-0009 (DOD) to R.G. This study made use of the Research Animal Support Facility at MD Anderson Cancer Center, Smithville, including Laboratory Animal Genetic Services and Mutant Mouse Pathology Services, which are supported by DHHS/NCI Cancer Center Support grant P30 CA016672.
Footnotes
CONFLICT OF INTEREST
The authors have nothing to disclose.
References
- 1.Siegel RL, Miller KD, Jemal A. Cancer Statistics. 2017;67(1):7–30. doi: 10.3322/caac.21387. [DOI] [PubMed] [Google Scholar]
- 2.Garg R, Benedetti LG, Abera MB, Wang H, Abba M, Kazanietz MG. Protein kinase C and cancer: what we know and what we do not. Oncogene. 2014;33(45):5225–37. doi: 10.1038/onc.2013.524. [DOI] [PMC free article] [PubMed] [Google Scholar]
- 3.Jain K, Basu A. The Multifunctional Protein Kinase C-epsilon in Cancer Development and Progression. Cancers (Basel) 2014;6(2):860–78. doi: 10.3390/cancers6020860. [DOI] [PMC free article] [PubMed] [Google Scholar]
- 4.Gorin MA, Pan Q. Protein kinase C epsilon: an oncogene and emerging tumor biomarker. Mol Cancer. 2009;8:9. doi: 10.1186/1476-4598-8-9. [DOI] [PMC free article] [PubMed] [Google Scholar]
- 5.Aziz MH, Manoharan HT, Church DR, Dreckschmidt NE, Zhong W, Oberley TD, et al. Protein kinase Cepsilon interacts with signal transducers and activators of transcription 3 (Stat3), phosphorylates Stat3Ser727, and regulates its constitutive activation in prostate cancer. Cancer Res. 2007;67(18):8828–38. doi: 10.1158/0008-5472.CAN-07-1604. [DOI] [PubMed] [Google Scholar]
- 6.Griner EM, Kazanietz MG. Protein kinase C and other diacylglycerol effectors in cancer. Nat Rev Cancer. 2007;7(4):281–94. doi: 10.1038/nrc2110. [DOI] [PubMed] [Google Scholar]
- 7.Caino MC, Lopez-Haber C, Kim J, Mochly-Rosen D, Kazanietz MG. Proteins kinase Cvarepsilon is required for non-small cell lung carcinoma growth and regulates the expression of apoptotic genes. Oncogene. 2012;31(20):2593–600. doi: 10.1038/onc.2011.428. [DOI] [PMC free article] [PubMed] [Google Scholar]
- 8.Pan Q, Bao LW, Kleer CG, Sabel MS, Griffith KA, Teknos TN, et al. Protein kinase C epsilon is a predictive biomarker of aggressive breast cancer and a validated target for RNA interference anticancer therapy. Cancer Res. 2005;65(18):8366–71. doi: 10.1158/0008-5472.CAN-05-0553. [DOI] [PubMed] [Google Scholar]
- 9.Hafeez BB, Zhong W, Weichert J, Dreckschmidt NE, Jamal MS, Verma AK. Genetic ablation of PKC epsilon inhibits prostate cancer development and metastasis in transgenic mouse model of prostate adenocarcinoma. Cancer Res. 2011;71(6):2318–27. doi: 10.1158/0008-5472.CAN-10-4170. [DOI] [PMC free article] [PubMed] [Google Scholar]
- 10.Benavides F, Blando J, Perez CJ, Garg R, Conti CJ, DiGiovanni J, et al. Transgenic overexpression of PKCepsilon in the mouse prostate induces preneoplastic lesions. Cell Cycle. 2011;10(2):268–77. doi: 10.4161/cc.10.2.14469. [DOI] [PMC free article] [PubMed] [Google Scholar]
- 11.Garg R, Blando J, Perez CJ, Wang H, Benavides FJ, Kazanietz MG. Activation of Nuclear Factor kappaB (NF-kappaB) in Prostate Cancer Is Mediated by Protein Kinase C {epsilon} (PKC{epsilon}) J Biol Chem. 2012;287(44):37570–82. doi: 10.1074/jbc.M112.398925. [DOI] [PMC free article] [PubMed] [Google Scholar]
- 12.Diaz-Meco MT, Moscat J. The atypical PKCs in inflammation: NF-kappaB and beyond. Immun Rev. 2012;246(1):154–67. doi: 10.1111/j.1600-065X.2012.01093.x. [DOI] [PMC free article] [PubMed] [Google Scholar]
- 13.Holden NS, Squires PE, Kaur M, Bland R, Jones CE, Newton R. Phorbol ester-stimulated NF-kappaB-dependent transcription: roles for isoforms of novel protein kinase C. Cell Signal. 2008;20(7):1338–48. doi: 10.1016/j.cellsig.2008.03.001. [DOI] [PubMed] [Google Scholar]
- 14.Lu ZG, Liu H, Yamaguchi T, Miki Y, Yoshida K. Protein kinase Cdelta activates RelA/p65 and nuclear factor-kappaB signaling in response to tumor necrosis factor-alpha. Cancer Res. 2009;69(14):5927–35. doi: 10.1158/0008-5472.CAN-08-4786. [DOI] [PubMed] [Google Scholar]
- 15.Satoh A, Gukovskaya AS, Nieto JM, Cheng JH, Gukovsky I, Reeve JR, Jr, et al. PKC-delta and -epsilon regulate NF-kappaB activation induced by cholecystokinin and TNF-alpha in pancreatic acinar cells. Am J Physio Gastro Liver Physiol. 2004;287(3):G582–91. doi: 10.1152/ajpgi.00087.2004. [DOI] [PubMed] [Google Scholar]
- 16.Garg R, Caino MC, Kazanietz MG. Regulation of Transcriptional Networks by PKC Isozymes: Identification of c-Rel as a Key Transcription Factor for PKC-Regulated Genes. PLoS One. 2013;8(6):e67319. doi: 10.1371/journal.pone.0067319. [DOI] [PMC free article] [PubMed] [Google Scholar]
- 17.Ishiguro H, Akimoto K, Nagashima Y, Kojima Y, Sasaki T, Ishiguro-Imagawa Y, et al. aPKClambda/iota promotes growth of prostate cancer cells in an autocrine manner through transcriptional activation of interleukin-6. Proc Natl Acad Sci. 2009;106(38):16369–74. doi: 10.1073/pnas.0907044106. [DOI] [PMC free article] [PubMed] [Google Scholar]
- 18.Wang S, Liu Z, Wang L, Zhang X. NF-kappaB signaling pathway, inflammation and colorectal cancer. Cell Mol Immunol. 2009;6(5):327–34. doi: 10.1038/cmi.2009.43. [DOI] [PMC free article] [PubMed] [Google Scholar]
- 19.Garg R, Blando JM, Perez CJ, Abba MC, Benavides F, Kazanietz MG. Protein Kinase C Epsilon Cooperates with PTEN Loss for Prostate Tumorigenesis through the CXCL13-CXCR5 Pathway. Cell reports. 2017;19(2):375–88. doi: 10.1016/j.celrep.2017.03.042. [DOI] [PMC free article] [PubMed] [Google Scholar]
- 20.Gupta S, Srivastava M, Ahmad N, Bostwick DG, Mukhtar H. Over-expression of cyclooxygenase-2 in human prostate adenocarcinoma. Prostate. 2000;42(1):73–8. doi: 10.1002/(sici)1097-0045(20000101)42:1<73::aid-pros9>3.0.co;2-g. [DOI] [PubMed] [Google Scholar]
- 21.Howe LR. Inflammation and breast cancer. Cyclooxygenase/prostaglandin signaling and breast cancer. Breast Cancer Res. 2007;9(4):210. doi: 10.1186/bcr1678. [DOI] [PMC free article] [PubMed] [Google Scholar]
- 22.Ogino S, Kirkner GJ, Nosho K, Irahara N, Kure S, Shima K, et al. Cyclooxygenase-2 expression is an independent predictor of poor prognosis in colon cancer. Clin Cancer Res. 2008;14(24):8221–7. doi: 10.1158/1078-0432.CCR-08-1841. [DOI] [PMC free article] [PubMed] [Google Scholar]
- 23.Yoshimura R, Sano H, Masuda C, Kawamura M, Tsubouchi Y, Chargui J, et al. Expression of cyclooxygenase-2 in prostate carcinoma. Cancer. 2000;89(3):589–96. [PubMed] [Google Scholar]
- 24.Richardsen E, Uglehus RD, Due J, Busch C, Busund LT. COX-2 is overexpressed in primary prostate cancer with metastatic potential and may predict survival. A comparison study between COX-2, TGF-beta, IL-10 and Ki67. Cancer Epidemiol. 2010;34(3):316–22. doi: 10.1016/j.canep.2010.03.019. [DOI] [PubMed] [Google Scholar]
- 25.Gowda R, Madhunapantula SV, Desai D, Amin S, Robertson GP. Selenium-containing histone deacetylase inhibitors for melanoma management. Cancer Biol Ther. 2012;13(9):756–65. doi: 10.4161/cbt.20558. [DOI] [PMC free article] [PubMed] [Google Scholar]
- 26.Masferrer JL, Leahy KM, Koki AT, Zweifel BS, Settle SL, Woerner BM, et al. Antiangiogenic and antitumor activities of cyclooxygenase-2 inhibitors. Cancer Res. 2000;60(5):1306–11. [PubMed] [Google Scholar]
- 27.Harris RE. Cyclooxygenase-2 (cox-2) blockade in the chemoprevention of cancers of the colon, breast, prostate, and lung. Inflammopharmacology. 2009;17(2):55–67. doi: 10.1007/s10787-009-8049-8. [DOI] [PubMed] [Google Scholar]
- 28.Narayanan BA, Reddy BS, Bosland MC, Nargi D, Horton L, Randolph C, et al. Exisulind in combination with celecoxib modulates epidermal growth factor receptor, cyclooxygenase-2, and cyclin D1 against prostate carcinogenesis: in vivo evidence. Clin Cancer Res. 2007;13(19):5965–73. doi: 10.1158/1078-0432.CCR-07-0744. [DOI] [PubMed] [Google Scholar]
- 29.Abedinpour P, Baron VT, Welsh J, Borgstrom P. Regression of prostate tumors upon combination of hormone ablation therapy and celecoxib in vivo. Prostate. 2011;71(8):813–23. doi: 10.1002/pros.21297. [DOI] [PMC free article] [PubMed] [Google Scholar]
- 30.Wang D, Dubois RN. The role of COX-2 in intestinal inflammation and colorectal cancer. Oncogene. 2010;29(6):781–8. doi: 10.1038/onc.2009.421. [DOI] [PMC free article] [PubMed] [Google Scholar]
- 31.Khor LY, Bae K, Pollack A, Hammond ME, Grignon DJ, Venkatesan VM, et al. COX-2 expression predicts prostate-cancer outcome: analysis of data from the RTOG 92-02 trial. Lancet Oncol. 2007;8(10):912–20. doi: 10.1016/S1470-2045(07)70280-2. [DOI] [PMC free article] [PubMed] [Google Scholar]
- 32.Howe LR, Dannenberg AJ. COX-2 inhibitors for the prevention of breast cancer. J Mammary Gland Biol Neoplasia. 2003;8(1):31–43. doi: 10.1023/a:1025731204719. [DOI] [PubMed] [Google Scholar]
- 33.Hu Z, Yang Y, Zhao Y, Huang Y. The prognostic value of cyclooxygenase-2 expression in patients with esophageal cancer: evidence from a meta-analysis. Onco Targets Ther. 2017;10:2893–901. doi: 10.2147/OTT.S134599. [DOI] [PMC free article] [PubMed] [Google Scholar]
- 34.Jain S, Chakraborty G, Raja R, Kale S, Kundu GC. Prostaglandin E2 regulates tumor angiogenesis in prostate cancer. Cancer Res. 2008;68(19):7750–9. doi: 10.1158/0008-5472.CAN-07-6689. [DOI] [PubMed] [Google Scholar]
- 35.Jiang J, Dingledine R. Prostaglandin receptor EP2 in the crosshairs of anti-inflammation, anti-cancer, and neuroprotection. Trends Pharmacol Sci. 2013;34(7):413–23. doi: 10.1016/j.tips.2013.05.003. [DOI] [PMC free article] [PubMed] [Google Scholar]
- 36.Hanaka H, Pawelzik SC, Johnsen JI, Rakonjac M, Terawaki K, Rasmuson A, et al. Microsomal prostaglandin E synthase 1 determines tumor growth in vivo of prostate and lung cancer cells. Proc Natl Acad Sci. 2009;106(44):18757–62. doi: 10.1073/pnas.0910218106. [DOI] [PMC free article] [PubMed] [Google Scholar]
- 37.Finetti F, Terzuoli E, Giachetti A, Santi R, Villari D, Hanaka H, et al. mPGES-1 in prostate cancer controls stemness and amplifies epidermal growth factor receptor-driven oncogenicity. Endocr Relat Cancer. 2015;22(4):665–78. doi: 10.1530/ERC-15-0277. [DOI] [PMC free article] [PubMed] [Google Scholar]
- 38.Liao X, Lochhead P, Nishihara R, Morikawa T, Kuchiba A, Yamauchi M, et al. Aspirin use, tumor PIK3CA mutation, and colorectal-cancer survival. N Engl J Med. 2012;367(17):1596–606. doi: 10.1056/NEJMoa1207756. [DOI] [PMC free article] [PubMed] [Google Scholar]
- 39.Tougeron D, Sha D, Manthravadi S, Sinicrope FA. Aspirin and colorectal cancer: back to the future. Clin Cancer Res. 2014;20(5):1087–94. doi: 10.1158/1078-0432.CCR-13-2563. [DOI] [PMC free article] [PubMed] [Google Scholar]
- 40.Veitonmaki T, Tammela TL, Auvinen A, Murtola TJ. Use of aspirin, but not other non-steroidal anti-inflammatory drugs is associated with decreased prostate cancer risk at the population level. Eur J Cancer. 2013;49(4):938–45. doi: 10.1016/j.ejca.2012.09.030. [DOI] [PubMed] [Google Scholar]
- 41.Terry MB, Gammon MD, Zhang FF, Tawfik H, Teitelbaum SL, Britton JA, et al. Association of frequency and duration of aspirin use and hormone receptor status with breast cancer risk. Jama. 2004;291(20):2433–40. doi: 10.1001/jama.291.20.2433. [DOI] [PubMed] [Google Scholar]
- 42.Garcia M, Velez R, Romagosa C, Majem B, Pedrola N, Olivan M, et al. Cyclooxygenase-2 inhibitor suppresses tumour progression of prostate cancer bone metastases in nude mice. BJU Int. 2014;113(5b):E164–77. doi: 10.1111/bju.12503. [DOI] [PubMed] [Google Scholar]
- 43.Walter B, Rogenhofer S, Vogelhuber M, Berand A, Wieland WF, Andreesen R, et al. Modular therapy approach in metastatic castration-refractory prostate cancer. World J Urol. 2010;28(6):745–50. doi: 10.1007/s00345-010-0567-x. [DOI] [PubMed] [Google Scholar]
- 44.Zheng X, Cui XX, Gao Z, Zhao Y, Lin Y, Shih WJ, et al. Atorvastatin and celecoxib in combination inhibits the progression of androgen-dependent LNCaP xenograft prostate tumors to androgen independence. Cancer Prev Res (Phila) 2010;3(1):114–24. doi: 10.1158/1940-6207.CAPR-09-0059. [DOI] [PMC free article] [PubMed] [Google Scholar]
- 45.Narayanan BA, Narayanan NK, Pttman B, Reddy BS. Adenocarcina of the mouse prostate growth inhibition by celecoxib: downregulation of transcription factors involved in COX-2 inhibition. Prostate. 2006;66(3):257–65. doi: 10.1002/pros.20331. [DOI] [PubMed] [Google Scholar]
- 46.Kashiwagi E, Shiota M, Yokomizo A, Inokuchi J, Uchiumi T, Naito S. EP2 signaling mediates suppressive effects of celecoxib on androgen receptor expression and cell proliferation in prostate cancer. Prostate Cancer Prostatic Dis. 2014;17(1):10–7. doi: 10.1038/pcan.2013.53. [DOI] [PubMed] [Google Scholar]
- 47.Dandekar DS, Lopez M, Carey RI, Lokeshwar BL. Cyclooxygenase-2 inhibitor celecoxib augments chemotherapeutic drug-induced apoptosis by enhancing activation of caspase-3 and -9 in prostate cancer cells. Int J Cancer. 2005;115(3):484–92. doi: 10.1002/ijc.20878. [DOI] [PubMed] [Google Scholar]
- 48.James ND, Sydes MR, Mason MD, Clarke NW, Anderson J, Dearnaley DP, et al. Celecoxib plus hormone therapy versus hormone therapy alone for hormone-sensitive prostate cancer: first results from the STAMPEDE multiarm, multistage, randomised controlled trial. Lancet Oncol. 2012;13(5):549–58. doi: 10.1016/S1470-2045(12)70088-8. [DOI] [PMC free article] [PubMed] [Google Scholar]
- 49.Armstrong AJ. The STAMPEDE trial and celecoxib: how to adapt? Lancet Oncol. 2012;13(5):443–5. doi: 10.1016/S1470-2045(12)70111-0. [DOI] [PubMed] [Google Scholar]
- 50.Turturro SB, Najor MS, Ruby CE, Cobleigh MA, Abukhdeir AM. Mutations in PIK3CA sensitize breast cancer cells to physiologic levels of aspirin. Breast Cancer Res Treat. 2016;156(1):33–43. doi: 10.1007/s10549-016-3729-8. [DOI] [PMC free article] [PubMed] [Google Scholar]
- 51.Henry WS, Laszewski T, Tsang T, Beca F, Beck AH, McAllister SS, et al. Aspirin Suppresses Growth in PI3K-Mutant Breast Cancer by Activating AMPK and Inhibiting mTORC1 Signaling. Cancer Res. 2017;77(3):790–801. doi: 10.1158/0008-5472.CAN-16-2400. [DOI] [PMC free article] [PubMed] [Google Scholar]
- 52.Wang H, Gutierrez-Uzquiza A, Garg R, Barrio-Real L, Abera MB, Lopez-Haber C, et al. Transcriptional Regulation of Oncogenic Protein Kinase C (PKC) by STAT1 and Sp1 Proteins. J Biol Chem. 2014;289(28):19823–38. doi: 10.1074/jbc.M114.548446. [DOI] [PMC free article] [PubMed] [Google Scholar]
- 53.Jiao J, Wang S, Qiao R, Vivanco I, Watson PA, Sawyers CL, et al. Murine cell lines derived from Pten null prostate cancer show the critical role of PTEN in hormone refractory prostate cancer development. Cancer Res. 2007;67(13):6083–91. doi: 10.1158/0008-5472.CAN-06-4202. [DOI] [PubMed] [Google Scholar]
- 54.Adhami VM, Malik A, Zaman N, Sarfaraz S, Siddiqui IA, Syed DN, et al. Combined inhibitory effects of green tea polyphenols and selective cyclooxygenase-2 inhibitors on the growth of human prostate cancer cells both in vitro and in vivo. Clin Cancer Res. 2007;13(5):1611–9. doi: 10.1158/1078-0432.CCR-06-2269. [DOI] [PubMed] [Google Scholar]
- 55.Cai Y, Lee YF, Li G, Liu S, Bao BY, Huang J, et al. A new prostate cancer therapeutic approach: combination of androgen ablation with COX-2 inhibitor. Int J Cancer. 2008;123(1):195–201. doi: 10.1002/ijc.23481. [DOI] [PubMed] [Google Scholar]
- 56.Fries S, Grosser T, Price TS, Lawson JA, Kapoor S, DeMarco S, et al. Marked interindividual variability in the response to selective inhibitors of cyclooxygenase-2. Gastroenterology. 2006;130(1):55–64. doi: 10.1053/j.gastro.2005.10.002. [DOI] [PubMed] [Google Scholar]
- 57.Wu D, Foreman TL, Gregory CW, McJilton MA, Wescott GG, Ford OH, et al. Protein kinase cepsilon has the potential to advance the recurrence of human prostate cancer. Cancer Res. 2002;62(8):2423–9. [PubMed] [Google Scholar]
- 58.Denkert C, Thoma A, Niesporek S, Weichert W, Koch I, Noske A, et al. Overexpression of cyclooxygenase-2 in human prostate carcinoma and prostatic intraepithelial neoplasia-association with increased expression of Polo-like kinase-1. Prostate. 2007;67(4):361–9. doi: 10.1002/pros.20467. [DOI] [PubMed] [Google Scholar]
- 59.Kim BH, Kim CI, Chang HS, Choe MS, Jung HR, Kim DY, et al. Cyclooxygenase-2 overexpression in chronic inflammation associated with benign prostatic hyperplasia: is it related to apoptosis and angiogenesis of prostate cancer? Kor J Urol. 2011;52(4):253–9. doi: 10.4111/kju.2011.52.4.253. [DOI] [PMC free article] [PubMed] [Google Scholar]
- 60.Kirschenbaum A, Klausner AP, Lee R, Unger P, Yao S, Liu XH, et al. Expression of cyclooxygenase-1 and cyclooxygenase-2 in the human prostate. Urology. 2000;56(4):671–6. doi: 10.1016/s0090-4295(00)00674-9. [DOI] [PubMed] [Google Scholar]
- 61.Gupta S, Adhami VM, Subbarayan M, MacLennan GT, Lewin JS, Hafeli UO, et al. Suppression of prostate carcinogenesis by dietary supplementation of celecoxib in transgenic adenocarcinoma of the mouse prostate model. Cancer Res. 2004;64(9):3334–43. doi: 10.1158/0008-5472.can-03-2422. [DOI] [PubMed] [Google Scholar]
- 62.Jiang J, Dingledine R. Role of prostaglandin receptor EP2 in the regulations of cancer cell proliferation, invasion, and inflammation. J Pharmacol Exp Ther. 2013;344(2):360–7. doi: 10.1124/jpet.112.200444. [DOI] [PMC free article] [PubMed] [Google Scholar]
- 63.Kashiwagi E, Shiota M, Yokomizo A, Itsumi M, Inokuchi J, Uchiumi T, et al. Prostaglandin receptor EP3 mediates growth inhibitory effect of aspirin through androgen receptor and contributes to castration resistance in prostate cancer cells. Endocr Relat Cancer. 2013;20(3):431–41. doi: 10.1530/ERC-12-0344. [DOI] [PubMed] [Google Scholar]
- 64.Xuan YT, Guo Y, Zhu Y, Wang OL, Rokosh G, Messing RO, et al. Role of the protein kinase C-epsilon-Raf-1-MEK-1/2-p44/42 MAPK signaling cascade in the activation of signal transducers and activators of transcription 1 and 3 and induction of cyclooxygenase-2 after ischemic preconditioning. Circulation. 2005;112(13):1971–8. doi: 10.1161/CIRCULATIONAHA.105.561522. [DOI] [PMC free article] [PubMed] [Google Scholar]
- 65.Mesquita RF, Paul MA, Valmaseda A, Francois A, Jabr R, Anjum S, et al. Protein kinase Cepsilon-calcineurin cosignaling downstream of toll-like receptor 4 downregulates fibrosis and induces wound healing gene expression in cardiac myofibroblasts. Mol Cell Biol. 2014;34(4):574–94. doi: 10.1128/MCB.01098-13. [DOI] [PMC free article] [PubMed] [Google Scholar]
- 66.Caino MC, Lopez-Haber C, Kissil JL, Kazanietz MG. Non-small cell lung carcinoma cell motility, rac activation and metastatic dissemination are mediated by protein kinase C epsilon. PloS one. 2012;7(2):e31714. doi: 10.1371/journal.pone.0031714. [DOI] [PMC free article] [PubMed] [Google Scholar]
- 67.O’Callaghan G, Houston A. Prostaglandin E2 and the EP receptors in malignancy: possible therapeutic targets? Br J Pharmacol. 2015;172(22):5239–50. doi: 10.1111/bph.13331. [DOI] [PMC free article] [PubMed] [Google Scholar]
- 68.Claudino RF, Kassuya CA, Ferreira J, Calixto JB. Pharmacological and molecular characterization of the mechanisms involved in prostaglandin E2-induced mouse paw edema. J Pharmacol Exp Ther. 2006;318(2):611–8. doi: 10.1124/jpet.106.102806. [DOI] [PubMed] [Google Scholar]
- 69.Nirodi CS, Crews BC, Kozak KR, Morrow JD, Marnett LJ. The glyceryl ester of prostaglandin E2 mobilizes calcium and activates signal transduction in RAW264.7 cells. Proc Natl Acad Sci. 2004;101(7):1840–5. doi: 10.1073/pnas.0303950101. [DOI] [PMC free article] [PubMed] [Google Scholar]
- 70.Fernandez-Marcos PJ, Abu-Baker S, Joshi J, Galvez A, Castilla EA, Canamero M, et al. Simultaneous inactivation of Par-4 and PTEN in vivo leads to synergistic NF-kappaB activation and invasive prostate carcinoma. Proc Natl Acad Sci. 2009;106(31):12962–7. doi: 10.1073/pnas.0813055106. [DOI] [PMC free article] [PubMed] [Google Scholar]
- 71.Lessard L, Begin LR, Gleave ME, Mes-Masson AM, Saad F. Nuclear localisation of nuclear factor-kappaB transcription factors in prostate cancer: an immunohistochemical study. Br J Cancer. 2005;93(9):1019–23. doi: 10.1038/sj.bjc.6602796. [DOI] [PMC free article] [PubMed] [Google Scholar]
- 72.Harris RE, Beebe J, Alshafie GA. Reduction in cancer risk by selective and nonselective cyclooxygenase-2 (COX-2) inhibitors. J Exp Pharmacol. 2012;4:91–6. doi: 10.2147/JEP.S23826. [DOI] [PMC free article] [PubMed] [Google Scholar]
- 73.Gutierrez-Uzquiza A, Lopez-Haber C, Jernigan DL, Fatatis A, Kazanietz MG. PKCepsilon Is an Essential Mediator of Prostate Cancer Bone Metastasis. Mol Cancer Res. 2015;13(9):1336–46. doi: 10.1158/1541-7786.MCR-15-0111. [DOI] [PMC free article] [PubMed] [Google Scholar]
Associated Data
This section collects any data citations, data availability statements, or supplementary materials included in this article.