
Figure 5. Differential sensitivity of PKCε overexpressing and Pten-depleted prostate epithelial cells to COX-2 inhibitors.
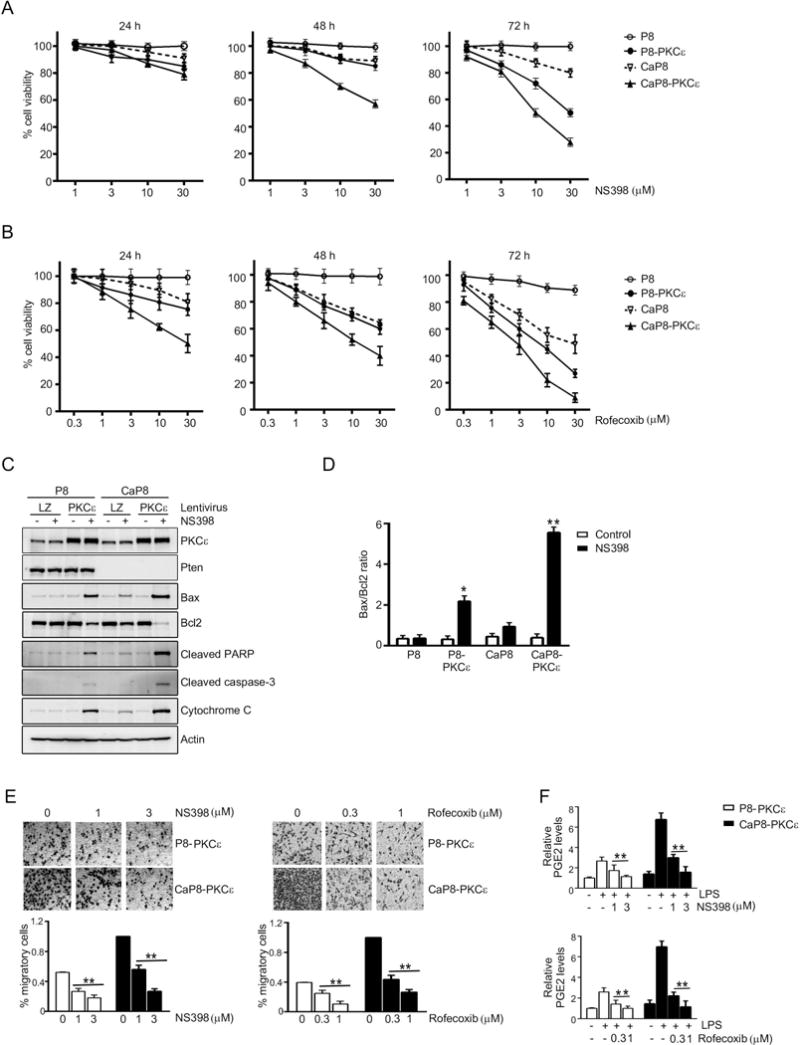
(A) P8 and CaP8 cells with or without stable PKCε overexpression were treated with different concentrations of NS398, and cell viability was determined after 24, 48, or 72 h of treatment using the MTT assay.
(B) P8 and CaP8 cells with or without stable PKCε overexpression were treated with different concentrations of rofecoxib, and cell viability was determined after 24, 48, or 72 h of treatment using the MTT assay.
(C) Cells were treated with NS398 (30 μM, 24 h), and subjected to Western blot analysis of the indicated apoptotic markers.
(D) Bax/Bcl2 ratio was determined after densitometric analysis of Western blot of Bax and Bcl2 protein. *, p< 0.05 and **, p< 0.01 vs. control.
(E) Migration of P8-PKCε and CaP8-PKCε cells after treatment with different concentrations of NS398 or rofecoxib was determined using a Boyden chamber. Top: Representative images. Bottom: Quantification of migrating cells. **, p< 0.01 vs. untreated (no treatment of NS398 or rofecoxib).
(F) Effect of NS398 or rofecoxib on PGE2 levels in the culture medium, as determined by enzyme immune assay. **, p< 0.01 vs. LPS, no NS398 or rofecoxib.
In (A), (B), (D), (E), and (F), results were expressed as mean ± S.D. of triplicate measurements. Similar results were observed in two additional experiments.