Abstract
Background
Epidermal growth factor receptor (EGFR) is reportedly overexpressed in most esophageal tumors, but most targeted therapies showed no efficacy in non-selected patients. This study aims at investigating the adaptive cetuximab subset in a cohort of esophageal squamous cell carcinoma (ESCC) patient-derived xenografts (PDXs).
Methods
A large panel of ESCC PDXs has been established. The copy number, mRNA expression and immunohistochemistry (IHC) of key EGFR pathways have been examined along with cetuximab response. A preclinical trial on a randomly selected cohort of 16 ESCC PDXs was conducted, and the genomic annotations of these models were compared against the efficacy readout of the mouse trial.
Results
The trial identified that 7 of 16 (43.8%) responded to cetuximab (ΔT/ΔC <0 as responders). The gene amplification and expression analysis indicated that EGFR copy number ≥5 (P=0.035), high EGFR mRNA expression (P=0.001) and IHC score of 2–3 (P=0.034) are associated with tumor growth inhibition by cetuximab, suggesting EGFR may function as a single predictive biomarker for cetuximab response in ESCC.
Conclusions
Overall, our results suggest that an ESCC subtype with EGFR amplification and overexpression benefits from cetuximab treatment, which warrants further clinical confirmation.
Keywords: Biomarker, patient-derived xenograft (PDX), epidermal growth factor receptor (EGFR), cetuximab, esophageal squamous cell carcinoma (ESCC)
Introduction
Esophageal cancer (EC) is the sixth leading cause of cancer death in the world (1). The prognosis of EC remains poor even with significant advancements in new surgical techniques and other treatment approaches (2). Due to the high recurrence post esophagectomy or definitive chemoradiotherapy (3), additional strategies are thus needed to increase systemic treatment options. Over the past decades, drugs targeting specific oncogenic alterations have been developed to treat cancers, with much success particularly for lung, breast and colorectal cancers. However, adaptive targeted treatment has not yet been approved for treating EC, which is an unmet and urgent need.
Epidermal growth factor receptor (EGFR) (ERBB1) is a member of the ERBB receptor tyrosine kinase family, also including ERBB2, ERBB3 and ERBB4 (4). EGFR is reported to be overexpressed in many types of tumors including head and neck (90%), colorectal (72%), lung (50%), bladder (65%) and esophageal (92%) (5-7), which correlates with poor prognosis. Cetuximab, a mouse-human chimeric antibody, binds to EGFR blocking phosphorylation and activation of EGFR (8). Over the past years, cetuximab has been approved in treating head and neck squamous carcinoma and KRAS-mutation metastatic colorectal cancer (9,10). For esophageal squamous cell carcinoma (ESCC), the EGFR inhibitor down regulates the level of EGFR and correlated downstream genes to inhibit the growth of EGFR overexpressed cells and increase cell sensitivity to chemo-/radiotherapy in some in vitro studies (11,12). For EGFR tyrosine kinase inhibitors (TKIs), five small clinical phase 2 trials reported the objective response rate in unselected patients with advanced EC was 2.8% to 16.7% (13-17). In the COG trial, the only randomized phase 3 study of second line therapy in EC, the progression free survival and patient reported outcome were improved in the gefitinib group (18). Moreover, in biomarker analysis, EGFR copy number and overexpression might potentially be used in predicting the efficacy in patients treated with EGFR TKIs (19,20). However, the randomized phase 2/3 and 3 clinical trials of SCOPE1 and RTOG 0436 showed that the addition of cetuximab to concurrent chemoradiotherapy did not improve overall survival for non-selected ESCC (21,22). As for the other EGFR monoclonal antibody, the EORTC power trial also revealed that the addition of panitumumab to chemotherapy provided no additional benefit and the biomarker analysis is on going (23). So far, most studies investigated the efficacy of cetuximab in combination with chemo-/radiotherapy, no suitable ESCC subtype was confirmed to cetuximab treatment and no established biomarkers were reported to predict tumor response to cetuximab.
Patient-derived tumor xenografts (PDXs) are used in predicting clinical activity of drugs and exploring biomarkers (24-27). We previously reported the discovery of a predictive biomarker for cetuximab response in CRC (28,29) and gastric (30) carcinoma via mouse clinical trial (MCT) using cohorts of PDXs. In this present study, we set out to investigate the activity of cetuximab in ESCC PDXs. We established 16 ESCC-PDXs by transplanting untreated tumor tissues from patients into immunocompromised BALB/c nude mice via subcutaneous inoculation, followed by extensive characterization and tests for response to cetuximab in an MCT. After therapeutic responders and non-responders were identified, candidate biomarkers were then assessed by genomic/phenotypical properties.
Methods
PDX establishment
The engraftment of transplant patient tumor fragments to mice was previously reported (31). In brief, freshly surgically resected ESCC tumor samples that are in excess of surgical pathologic diagnosis were obtained from the patients in Shanghai Cancer Hospital with the Institutional Review Boards of the hospital and the informed consents from patients. Tumor tissues were cut into 3×3×3 mm3 fragments mixed with 10% Matrigel at 4 °C and subcutaneously implanted into immune deficient mice (BALB/c nude, 6 to 8 weeks old female mice,), followed by expansion, banking, histopathology and molecular characterizations, and pharmacology characterization as previously described (31). Most procedures for genomic and histopathology analysis have been thoroughly described before (30,31). All animal procedures were conducted at Crown Bioscience SPF facility and in strict accordance with the Guide for the Care and Use of Laboratory Animals of the National Institutes of Health. The protocol was approved by the Committee of the Ethics of Animal Experiments of Crown Bioscience (Crown Bioscience IACUC Committee).
PDX therapeutic treatment
MCTs using cohorts of PDXs have also been described previously (28,30). When tumors reached on average 100–150 mm3, mice were grouped equally by tumor volume into treatment and control groups, each group comprising 5 mice. Vehicle controls received PBS intraperitoneal injection weekly, while the treatment group received weekly intraperitoneal injection with cetuximab (50 mg/kg, Merck KGaA). Both groups received the treatment for 3 weeks. Tumor volume was measured twice weekly, the mice were sacrificed when the volume reached 2,000 mm3 or after 30 days-post treatment. ΔT/ΔC value was calculated for assessing tumor response to the treatment (ΔT = tumor volume change in the treatment group and ΔC = tumor volume change in the control group). At the end point, tumors were fixed in formalin for pathological examination, and snap-frozen banking in liquid nitrogen for gene analysis occurred.
Gene copy number and mutation analysis
For copy number assay using Affymetrix SNP 6.0 chips, genomic DNA was isolated and purified using the Genomic DNA Tissue and Blood Isolation Kit (Qiagen) following manufacturer’s instruction. DNA processing was performed following a standard Affymetrix protocol (http://media.affymetrix.com/support/down-loads/manuals/genomewidesnp6_manual.pdf). Gene copy number analysis was performed by PICNIC and/or PennCNV methods and a copy number ≥5 is considered positive. The confirmation of hotspot mutations was conducted for some mutation alleles as previously described (31).
IHC analysis
For all of the samples, the relative EGFR protein expression level was determined by immunohistochemistry (IHC), anti-human antibodies including EGFR (CST, Beverly, MA, USA), P-EGFR (Abcam, Cambridge, MA, USA), HER3 (CST, Beverly, MA, USA), P-HER3 (CST, Beverly, MA, USA), MET (CST, Beverly, MA, USA), P-MET (CST, Beverly, MA, USA), Akt (CST, Beverly, MA, USA), P-Akt (CST, Beverly, MA, USA), ERK (CST, Beverly, MA, USA), P-ERK (CST, Beverly, MA, USA) were applied to stain the positive sections. The test specimens were then scored independently by three investigators in a blinded fashion per the following criteria: score 0 representing no specific section staining within the tumor while 1+, 2+, 3+ represent different staining intensity of the nucleus or membrane.
Statistical analysis
Pearson correlation tests and linear regression were applied for comparing the data of the two groups. All data analyzes were completed using SPSS (version 19.0, SPSS Inc., Chicago, IL, USA), P<0.05 was considered statistically significant.
Results
Characterization of patients and PDXs
One hundred and ten surgically removed ESCC patient tumor tissues were implanted into immunocompromised mice, and 61 of 110 were found to grow: take-rate of 55.5%. None of the patients received neoadjuvant treatment before surgery. The summary of patient information for the randomly selected 16 patients with PDX established/enrolled in this study is shown in Table 1. Among them, 10 (62.5%) were stages I–II, 6 (37.5%) were stages III–IV, there were no material bias in patients’ stage. As 1 (6.3%) was low-middle differentiation, 7 (43.8%) were middle differentiation, 4 (25%) were middle-high differentiation and 4 (25%) were high differentiation, the distributions of differentiation were basically equal.
Table 1. Summary of the patient information of the enrolled cohort of ESCC-PDXs in the present study.
| Characteristic | Numbers, n (%) |
|---|---|
| Age, median [range] years | 59 [53–76] |
| Gender | |
| Male | 8 [50] |
| Female | 8 [50] |
| Stage* | |
| I–II | 10 (62.5) |
| III–IV | 6 (37.5) |
| Differentiation | |
| Low-middle | 1 (6.3) |
| Middle | 7 (43.8) |
| Middle-high | 4 [25] |
| High | 4 [25] |
| Tumor location | |
| Cervical + upper thoracic | 1 (6.3) |
| Middle + lower thoracic | 14 (87.5) |
| Double/multiple primary tumor | 1 (6.3) |
| Tumor length, median (range) cm | 5 (3–7.5) |
| Neoadjuvant treatment | |
| Yes | 0 (0) |
| No | 16 [100] |
*, UICC 6th. ESCC, esophageal squamous cell carcinoma; PDXs, patient-derived xenografts.
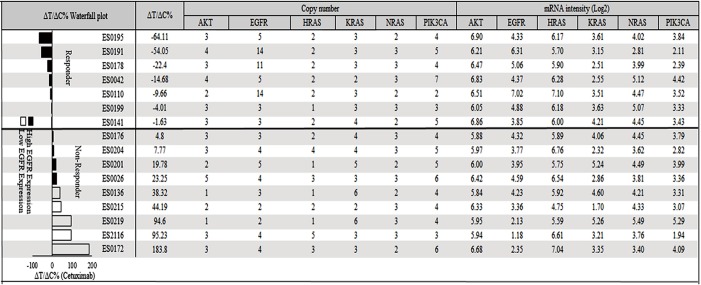
Many of these PDX tumors were then extensively characterized, including the 16 PDXs enrolled in the study, e.g., histopathology confirmed, transcriptome sequenced, SNP 6.0 analyzed (gene copy number), IHC analyzed (protein expression), etc. In particular, the activated oncogenic pathways commonly seen in cancers were carefully examined using these profiling data. Specifically, only a few oncogenic mutation alleles were identified by transcriptome sequencing (RNAseq) (also confirmed by hotspot mutation analyses), with a few oncogene amplifications also revealed by SNP 6.0 GeneChip analysis (Figure 1), among the commonly activated pathways in cancers (e.g., EGFR, HRAS, AKT, KRAS, NRAS, PI3KC). The expression or overexpression of the relevant genes have also been examined per RNAseq and IHC, as summarized in Table 2.
Figure 1.
The copy number and mRNA levels of EGFR pathway genes (AKT, HRAS, KRAS, NRAS and PIK3CA) were not significant related with cetuximab response. EGFR, epidermal growth factor receptor.
Table 2. Correlation between protein level and tumor response.
| Protein | Expression level | Tumor response (−ΔT/ΔC%) | P value | |
|---|---|---|---|---|
| Low | High | |||
| EGFR | Low | 5 | 0 | 0.034* |
| High | 4 | 7 | ||
| p-EGFR | Low | 7 | 1 | 0.041* |
| High | 2 | 6 | ||
| HER3 | Low | 7 | 3 | 0.302 |
| High | 2 | 4 | ||
| p-HER3 | Low | 6 | 6 | 0.585 |
| High | 3 | 1 | ||
| MET | Low | 7 | 2 | 0.126 |
| High | 2 | 5 | ||
| p-MET | Low | 4 | 4 | 1 |
| High | 4 | 4 | ||
| Akt | Low | 4 | 6 | 0.145 |
| High | 5 | 1 | ||
| p-Akt | Low | 5 | 6 | 0.308 |
| High | 4 | 1 | ||
| Erk | Low | 6 | 4 | 1 |
| High | 3 | 3 | ||
| p-Erk | Low | 3 | 4 | 0.615 |
| High | 6 | 3 | ||
*, P<0.05. IHC results of EGFR were divided into 2 categories: high expression (score 2–3) and low expression (score 0–1), the EGFR protein level associated with tumor response. IHC, immunohistochemistry; EGFR, epidermal growth factor receptor.
A subset of ESCC-PDXs responded to cetuximab
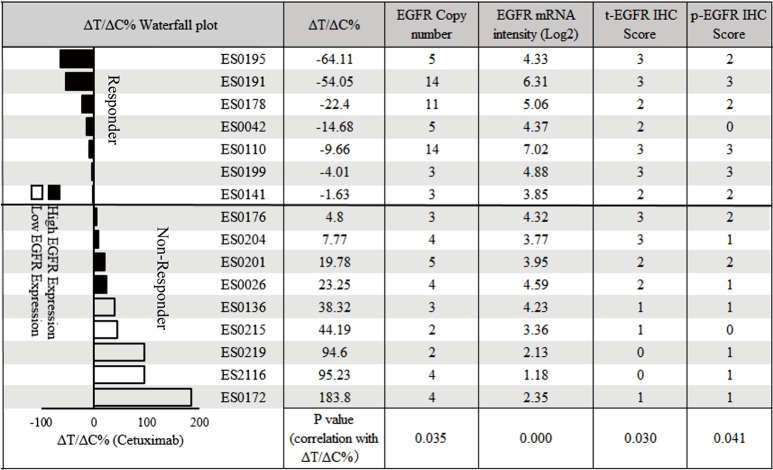
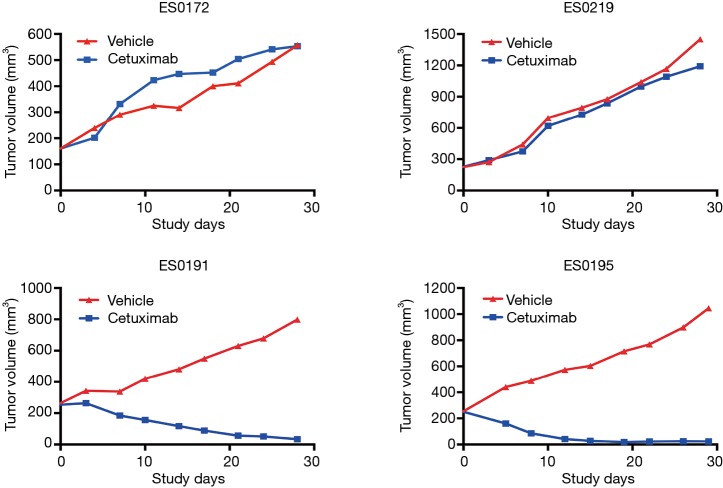
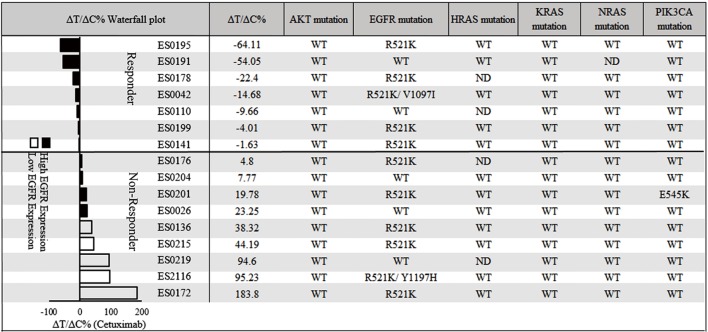
An MCT on the cohort of 16 ESCC-PDXs, randomly enrolled from 61 PDXs, was conducted (“n=10 format”: 10 mice per arm, two arms: vehicle and cetuximab treatment; 1 mg per mouse, once weekly for 3 weeks, initiated when tumor volume reached 150–200 mm3) to assess cetuximab efficacy. The tumor response to cetuximab was quantified by ΔT/ΔC, as summarized in Figure 2. The tested ESCC-PDXs fell into two distinct categories according to the drug activities: 7 of 16 (43.8%) responded to cetuximab treatment (ΔT/ΔC <0); 9 of 16 (56.3%) did not, with ΔT/ΔC >0. Among the responders, 2 of 7 (28.6%) reached nearly complete response (ΔT/ΔC =−64.11%/−54.05%) while the other 5 showed partial response (ΔT/ΔC ranged from −22 to 0). Representative tumor response curves are shown in Figure 3. ES0191 and ES0195 are examples of cetuximab sensitive models, while ES0172 and ES0219 are resistant models. Our data clearly suggests that a subset of patients might potentially benefit from cetuximab treatment in EC, or in other words, EGFR is an oncogenic driver for these patients, at least for maintaining their disease state.
Figure 2.
ΔT/ΔC% of cetuximab in 16 ESCC-PDX models significantly correlated with EGFR amplification (copy number: P=0.035) and expression (mRNA: P=0.000, t-EGFR: P=0.030). EGFR, epidermal growth factor receptor.
Figure 3.
Growth curve of 4 representative mice. ES0172 and ES0219: 2 models did not respond to cetuximab; ES0191 and ES0195: 2 models nearly reached complete response.
EGFR expression seems to positively predict cetuximab response in ESCC-PDXs
Cetuximab targets surface expressed EGFR, therefore it is reasonable to first suspect that the status of EGFR could be related to drug response. We previously reported similar studies of cetuximab treatment on cohorts of CRC (28) and gastric (30) cancers, where the status of EGFR played completely different roles. While little role was seen in CRC, EGFR amplification and/or overexpression clearly demonstrates positive correlation to drug response in gastric cancer (30). It would be interesting to determine whether the status of EGFR in ESCC plays a role in response to cetuximab.
We first tested the copy number of EGFR by Affymetrix SNP 6.0, demonstrating amplification rate of 37.5% (or 6/16), similar to those previously reported (19,20,32). More importantly, the EGFR amplification was significantly correlated with the ESCC-PDXs response to cetuximab (P value of 0.035, Figure 2).
We next examined whether there is a correlation between EGFR mRNA levels and ΔT/ΔC. As shown in Figure 2, the majority of ESCC (13/16) expressed some degree of EGFR mRNA (Log2 >3), as is known in ESCC patients. Interestingly, the higher expressors are all responders (P value of 0.00). Furthermore, EGFR mRNA levels had a negative correlation with ΔT/ΔC (correlation coefficient: −0.748; P=0.001) (Figure 4). The linear regression analysis showed the same results as R2=0.559 (P=0.001), indicating that a higher EGFR mRNA expression showed a better tumor response to cetuximab (Figure 4).
Figure 4.
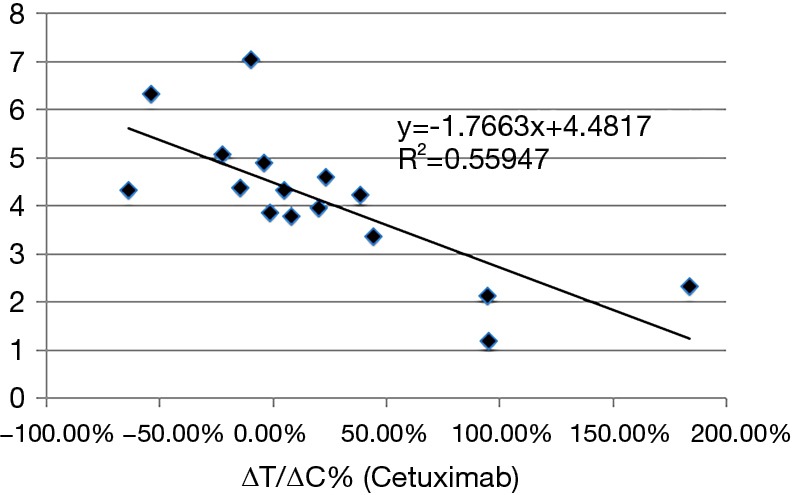
Linear regression analysis of EGFR mRNA level and cetuximab efficacy. The result of linear regression analysis: R2=0.559 (P=0.001), indicating that a higher mRNA expression of EGFR had a better tumor response to cetuximab. EGFR, epidermal growth factor receptor.
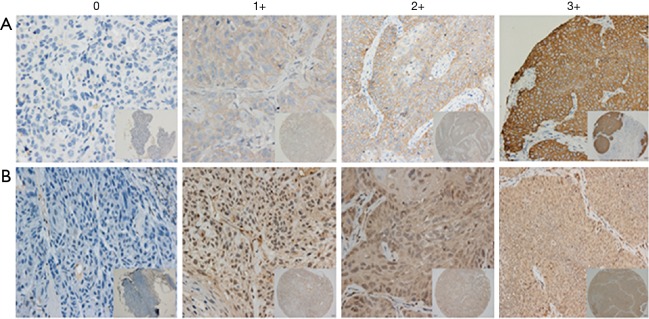
We next examined protein levels of EGFR by IHC and their correlation with drug response. The tumor tissue microarray of these models was stained by either anti-EGFR or anti-pEGFR antibodies. The signals were semi-quantitatively determined using a score system. The results showed positive EGFR and pEGFR immunostaining in 14/16 (87.5%) models. Among EGFR positive models, 3/16 had staining intensity score of 1+, 5/16 of 2+, 6/16 of 3+, while 6/16 of 1+, 5/16 of 2+ and 3/16 of 3+ were observed for pEGFR staining. The typical EGFR staining of score 0–3+ is shown in Figure 5. To further explore the correlation between tumor protein expression and cetuximab response, the IHC results of EGFR and pEGFR were divided into 2 categories: high expression [2–3] and low expression [0–1]. By Chi-square test, the P value was 0.034 for EGFR and 0.041 for pEGFR, indicating that the IHC scores for EGFR and pEGFR associated with tumor response. For EGFR protein expression, its predictive accuracy was 75% (12/16), high expression of EGFR predictive accuracy of 63.6% (7/11), low expression of EGFR predictive accuracy was 100% (5/5). These IHC observations are consistent with the mRNA data, although less significant and consistent, likely due to IHC providing poorer quantitation than mRNA. Overall, EGFR may function as a single predictive biomarker for cetuximab response in ESCC, with similarity to that seen in gastric carcinoma but not in CRC. In this study, we also explored the relationship between expression of different proteins. EGFR was associated with the expression of p-EGFR (P=0.004) and HER3 (P=0.036), but not of other molecules. The expression of p-EGFR was not only related to the expression of EGFR, but also related to the expression of HER3 (6/16, P=0.002) and MET (7/16, P=0.002).
Figure 5.
Typical EGFR and Akt staining of score 0–3+. EGFR and Akt staining as determined by immunohistochemistry. Panels show representative examples of esophageal tumor specimens stained for total EGFR (A) and Akt (B). EGFR, epidermal growth factor receptor.
As EGFR copy number and protein expression were correlated with cetuximab response in ESCC, we further combined EGFR copy number and IHC data to see whether there was increased predictive value. We found it was significantly correlated with ESCC-PDXs response to cetuximab (P value =0.021, Table 3).
Table 3. The cetuximab response was significantly correlated with both EGFR amplification and t-EGFR IHC.
| Status of EGFR copy number and t-EGFR IHC | Non-responder | Responder | P value |
|---|---|---|---|
| Both positive | 1 | 5 | 0.021 |
| Only one positive | 3 | 2 | |
| Both negative | 5 | 0 |
IHC, immunohistochemistry; EGFR, epidermal growth factor receptor.
Evaluation of other common oncogenes as potential predictive biomarkers
It is possible that other commonly seen oncogenes may also play roles in cetuximab response as in CRC (28), therefore the 5 most reported genes (MET, HGF, ERBB2, ERBB3, IGF1R) and 4 main downstream effectors (AKT1, AKT2, MAPK1, MAPK3) were also analyzed. The oncogene mutation alleles were found to be less frequent (Figure 6) than in CRC, similar to those in gastric cancers (30). These mutations thus seem to playing minor roles in cetuximab response in ESCC, or also as likely as predictive biomarker. There also seems no apparent role of gene copy numbers or expression levels of these oncogenes as well (Figure 1), although there is differential expression of ERBB and MET mRNA among the 16 models with a standard deviation (SD) >1.
Figure 6.
The oncogene mutation alleles of ESCC were not frequent. ESCC, esophageal squamous cell carcinoma.
Whether mRNA level and gene amplification of the same gene had a relationship was detected by Pearson correlation test. Statistically, EGFR, ERBB2, ERBB3 and MET were considered correlated in mRNA and gene amplification, while the upstream genes (HGF, MAPK) and downstream (AKT1, AKT2, MAPK1, MAPK2) were not. The correlation between upstream and downstream gene expression was also tested. MET and MAPK1 were reported as positively correlated (correlation coefficient: 0.684; P=0.003) while IGF1R and MAPK3 had negative correlation (correlation coefficient: −0.628; P=0.009). No expression of other molecules was found to be correlated (ERBB2, ERBB3, HGF, IGFR, MET, MET, AKT1/2, MAPK1/3).
Discussion
To our knowledge, this is the first study to use PDX models to investigate the effectiveness of cetuximab in EC, and to establish a subgroup of patients who are sensitive to cetuximab therapy. In this study, 16 PDX models of EC were established and 7 of 16 (43.8%) responded to cetuximab monotherapy.
Our data found that EGFR amplification was closely correlated to cetuximab response and EGFR expression, which was similar to the observation in the gastric MCT described previously (30). Moreover, our data clearly confirmed a strong positive correlation between cetuximab response in ESCC and EGFR mRNA expression levels, which is also confirmed for protein levels per IHC staining, albeit to a lesser degree. The fact that no low-EGFR expression models responded to cetuximab also confirmed the conclusion above. The certain degree of discrepancy in the correlation between protein and mRNA is likely due to the semi-quantitative nature of IHC. Furthermore, the combination of EGFR copy number and IHC analysis could predict cetuximab response more precisely.
PDX closely mimic the original patient in both histology and molecular pathology (33), and also with demonstrated similar drug response (34,35). A cohort of ESCC-PDXs representing diversity of the disease could be potentially useful in assessing the activity of cetuximab on ESCC and in determining potential predictive biomarkers through an MCT in the preclinical setting. The PDX trial may also have actual advantages over a human trial for clearly demonstrating drug activity by defined experimental conditions and minimized individual differences, e.g., patients’ general conditions and different PK among individuals, etc. The present MCT study seems to confirm cetuximab activity in ESCC and identify EGFR as a predictive biomarker, which warrants further clinical confirmation.
Although many ESCC express EGFR, EGFR monoclonal antibodies, such as cetuximab, have yet to be confirmed effective in non-selective ESCC in the clinic (13-17). In ESCC, an EGFR inhibitor could downregulate the level of EGFR and correlated downstream genes, to inhibit high EGFR expressed cell growth, and to increase cell sensitivity to chemo-/radiotherapy in some in vitro studies (11,12). For clinical trials, a phase 2 study from Lorenzen et al. is the only randomized clinical trial to confirm the efficacy of cetuximab in high-EGFR expressed ESCC patients. 62 patients were enrolled in the study, 32 receiving cetuximab plus CF (cisplatin + 5-flurouracil) and 30 CF only. With a median follow up of 21.5 months, the median overall survival was 9.5 and 5.5 months for cetuximab + CF and CF respectively (P=0.32). However, considering the poor prognosis of high EGFR expressed ESCC patients (PFS: 3.6 months, OS: 5.5 months), the efficacy of group cetuximab + CF was encouraging (36). Several retrospective studies also suggested cetuximab-combined therapy increased overall survival of high EGFR ESCC patients, even better than EGFR negative patients who were supposed to have a better prognosis (37,38). However, none of these studies have definitely confirmed activity in the EGFR-high expressors with statistical significance, which could be due to small number of subjects involved in the trials, or the retrospective nature of study.
For EGFR TKIs, in the phase 3 COG trial, gefitinib improved the PFS (median PFS, 1.57 vs. 1.17 months, P=0.020) both in adenocarcinomas and squamous cell carcinomas over placebo. In the gefitinib subgroup, the EGFR FISH-positive patients had longer PFS and OS, which was similar to other TKIs therapies in gastric or gastroesophageal carcinoma (18). Consistent with COG, a phase 2 trial showed that icotinib had favorable activity in ESCC patients with EGFR overexpression or amplification (16). In our study, we confirmed the predictive value of EGFR amplification (P=0.035) and overexpression (mRNA: P=0.001; IHC: P=0.034) in cetuximab treatment in ESCC patients, and also found the combination of EGFR copy number and IHC results could increase the predictive value (P=0.021), which was similar to the findings in ESCC EGFR TKIs therapy.
Compared with a higher frequency of EGFR/KRAS mutations in CRC and non-small cell lung cancer, these commonly seen oncogene mutations are rarely detected in ESCC tumors (39,40). In the present study, no effective EGFR/KRAS/HRAS/NRAS mutations were detected in 16 PDX models and the overexpression of EGFR also seemed to have little correlation with increased EGFR copy number. One of 16 (6.3%) patients had a PIK3CA mutation, whose frequency was similar to that previously reported 7.4% (41).
MET and HER3 activation have been reported to effect tumor resistance to EGFR inhibitors. During anti-EGFR therapy of CRC, MET amplification was significantly correlated with resistance to that EGFR blockade, which could be reversed by a MET inhibitor (42). In Engelman’s team, the same conclusion has been reached, and it has also been shown that MET amplification causes tumor resistance to EGFR inhibitors by activation of HER3 (43). In the present study, we investigated the relationship between EGFR, MET and HER3 by Spearman correlation test. The expression of p-EGFR correlated not only with EGFR (P=0.004), but also with HER3 (P=0.002) and MET (P=0.002). The results were similar to those previously reported. PI3K/Akt and MAPK/Erk are two main downstream pathways of EGFR and PI3K/Akt, which are closely related with cell apoptosis and tumor prognosis. In Li’s study, a higher level of p-Akt was observed in 5-FU resistant ESCC and the inhibition of the PI3K/Akt pathway could repress cell proliferation (44). This study also investigated copy number, mRNA and IHC levels of these common EGFR downstream oncogenes, however, none seemed to be a promising biomarker of cetuximab efficacy.
Of course, there are still many deficiencies in our study, such as the small sample size. We are expanding the number of PDXs to verify our results and improving the SNP method to measure gene copy number more accurately. At the same time, we are starting to conduct clinical trials based on this result and explore the favorable subtype of cetuximab treatment which is still on going.
In conclusion, our results suggest that an ESCC subtype with overexpression of EGFR copy number, mRNA and protein levels benefits from cetuximab treatment, which warrants further clinical confirmation.
Acknowledgements
The authors would like to thank the patients who donated their tissues for this study, and to thank the technicians from the Division of Translational Oncology and Animal Center at Crown Bioscience for technical support of this work. The authors would also like to thank Dr. Jody Barbeau for careful reading and editing of this manuscript.
Funding: This study was financially supported by the National Natural Science Foundation of China Research, China (grant number: 21172043, 21441010), National Key R&D Plan in China (grant number: MOST-2016YFC1303200), and National Key R&D Program of China (Grant No. 2016YFC1303200).
Ethical Statement: The study was approved by the ethics committee of Fudan University Shanghai Cancer Center (ID: 1605160-2), and the informed consents from patients were obtained.
Footnotes
Conflicts of Interest: The authors have no conflicts of interest to declare.
References
- 1.Ferlay J. GLOBOCAN 2000. Cancer Incidence, Mortality and Prevalence Worldwide, Version 1.0. 2001.
- 2.Enzinger PC, Mayer RJ. Esophageal cancer. New Engl J Med 2003;349:2241-52. 10.1056/NEJMra035010 [DOI] [PubMed] [Google Scholar]
- 3.Burtness BA. Preoperative chemoradiation for esophageal cancer. Cancer J Sci Am 1999;5:73-4. [PubMed] [Google Scholar]
- 4.Mendelsohn J, Howley PM, Israel MA. The molecular basis of cancer. Saunders/Elsevier, 2008. [Google Scholar]
- 5.Grandis JR, Tweardy DJ. Elevated levels of transforming growth factor alpha and epidermal growth factor receptor messenger RNA are early markers of carcinogenesis in head and neck cancer. Cancer Res 1993;53:3579-84. [PubMed] [Google Scholar]
- 6.Ciardiello F, Tortora G. Epidermal growth factor receptor (EGFR) as a target in cancer therapy: understanding the role of receptor expression and other molecular determinants that could influence the response to anti-EGFR drugs. Eur J Cancer 2003;39:1348-54. 10.1016/S0959-8049(03)00235-1 [DOI] [PubMed] [Google Scholar]
- 7.Kitamura H, Kyazawa O. Cancer stem cell: Implications in cancer biology and therapy with special reference to lung cancer. Lung Cancer 2009;66:275-81. 10.1016/j.lungcan.2009.07.019 [DOI] [PubMed] [Google Scholar]
- 8.Goldstein NI, Prewett M, Zuklys K, et al. Biological efficacy of a chimeric antibody to the epidermal growth factor receptor in a human tumor xenograft model. Clin Cancer Res 1995;1:1311-8. [PubMed] [Google Scholar]
- 9.Bonner JA, Harari PM, Giralt J, et al. Radiotherapy plus cetuximab for locoregionally advanced head and neck cancer: 5-year survival data from a phase 3 randomised trial, and relation between cetuximab-induced rash and survival. Lancet Oncol 2010;11:21-8. 10.1016/S1470-2045(09)70311-0 [DOI] [PubMed] [Google Scholar]
- 10.Misale S, Yaeger R, Hobor S, et al. Emergence of KRAS mutations and acquired resistance to anti-EGFR therapy in colorectal cancer. Nature 2012;486:532-6. 10.1038/nature11156 [DOI] [PMC free article] [PubMed] [Google Scholar]
- 11.Gong JH, Liu XJ, Li Y, et al. Pingyangmycin downregulates the expression of EGFR and enhances the effects of cetuximab on esophageal cancer cells and the xenograft in athymic mice. Cancer Chemother Pharmacol 2012;69:1323-32. 10.1007/s00280-012-1827-9 [DOI] [PubMed] [Google Scholar]
- 12.Jing Z, Gong L, Xie CY, et al. Reverse resistance to radiation in KYSE-150R esophageal carcinoma cell after epidermal growth factor receptor signal pathway inhibition by cetuximab. Radiother Oncol 2009;93:468-73. 10.1016/j.radonc.2009.08.008 [DOI] [PubMed] [Google Scholar]
- 13.Adelstein DJ, Rybicki LA, Ives DI, et al. A phase II trial of gefitinib for recurrent or metastatic cancer of the esophagus or gastroesophageal junction. Invest New Drugs 2012;30:1684-9. 10.1007/s10637-011-9736-z [DOI] [PubMed] [Google Scholar]
- 14.Ilson DH, Kelsen D, Shah M, et al. A phase 2 trial of erlotinib in patients with previously treated squamous cell and adenocarcinoma of the esophagus. Cancer 2011;117:1409-14. 10.1002/cncr.25602 [DOI] [PMC free article] [PubMed] [Google Scholar]
- 15.Ferry DR, Anderson M, Beddard K, et al. A phase II study of gefitinib monotherapy in advanced esophageal adenocarcinoma: evidence of gene expression, cellular, and clinical response. Clin Cancer Res 2007;13:5869-75. 10.1158/1078-0432.CCR-06-1970 [DOI] [PubMed] [Google Scholar]
- 16.Huang J, Fan Q, Lu P, et al. Icotinib in Patients with Pretreated Advanced Esophageal Squamous Cell Carcinoma with EGFR Overexpression or EGFR Gene Amplification: A Single-Arm, Multicenter Phase 2 Study. J Thorac Oncol 2016;11:910-7. 10.1016/j.jtho.2016.02.020 [DOI] [PubMed] [Google Scholar]
- 17.Janmaat ML, Gallegos-Ruiz MI, Rodriguez JA, et al. Predictive factors for outcome in a phase II study of gefitinib in second-line treatment of advanced esophageal cancer patients. J Clin Oncol 2006;24:1612-9. 10.1200/JCO.2005.03.4900 [DOI] [PubMed] [Google Scholar]
- 18.Dutton SJ, Ferry DR, Blazeby JM, et al. Gefitinib for oesophageal cancer progressing after chemotherapy (COG): a phase 3, multicentre, double-blind, placebo-controlled randomised trial. Lancet Oncol 2014;15:894-904. 10.1016/S1470-2045(14)70024-5 [DOI] [PubMed] [Google Scholar]
- 19.Petty RD, Dahle-Smith A, Daj S, et al. Gefitinib and EGFR Gene Copy Number Aberrations in Esophageal Cancer. J Clin Oncol 2017;35:2279-87. 10.1200/JCO.2016.70.3934 [DOI] [PubMed] [Google Scholar]
- 20.Wang X, Niu H, Fan Q, et al. Predictive value of EGFR overexpression and gene amplification on icotinib efficacy in patients with advanced esophageal squamous cell carcinoma. Oncotarget 2016;7:24744-51. [DOI] [PMC free article] [PubMed] [Google Scholar]
- 21.Crosby T, Hurt CN, Falk S, et al. Chemoradiotherapy with or without cetuximab in patients with oesophageal cancer (SCOPE1): A multicentre, phase 2/3 randomised trial. Lancet Oncol 2013;14:627-37. 10.1016/S1470-2045(13)70136-0 [DOI] [PubMed] [Google Scholar]
- 22.Suntharalingam M, Winter K, Ilson D, et al. The Initial Report of Local Control on RTOG 0436: A Phase 3 Trial Evaluating the Addition of Cetuximab to Paclitaxel, Cisplatin, and Radiation for Patients With Esophageal Cancer Treated Without Surgery. Int J Radiat Oncol Biol Phys 2014;90:S3 10.1016/j.ijrobp.2014.06.022 [DOI] [Google Scholar]
- 23.Markus HM, Peter CTP, Baruch B, et al. Cisplatin/5-FU (CF) +/- panitumumab (P) for patients (pts) with non-resectable, advanced, or metastatic esophageal squamous cell cancer (ESCC): An open-label, randomized AIO/TTD/BDGO/EORTC phase III trial (POWER). J Clin Oncol 2017;35:4011 10.1200/JCO.2017.35.15_suppl.4011 [DOI] [Google Scholar]
- 24.Némati F, Sastre-Garau X, Laurent C, et al. Establishment and characterization of a panel of human uveal melanoma xenografts derived from primary and/or metastatic tumors. Clin Cancer Res 2010;16:2352-62. 10.1158/1078-0432.CCR-09-3066 [DOI] [PubMed] [Google Scholar]
- 25.Némati F, Daniel C, Arvelo F, et al. Clinical relevance of human cancer xenografts as a tool for preclinical assessment: example of in-vivo evaluation of topotecan-based chemotherapy in a panel of human small-cell lung cancer xenografts. Anticancer Drugs 2010;21:25-32. 10.1097/CAD.0b013e3283300a29 [DOI] [PubMed] [Google Scholar]
- 26.Fichtner I, Rolff J, Soong R, et al. Establishment of patient-derived non-small cell lung cancer xenografts as models for the identification of predictive biomarkers. Clin Cancer Res 2008;14:6456-68. 10.1158/1078-0432.CCR-08-0138 [DOI] [PubMed] [Google Scholar]
- 27.Marangoni E, Vincent-Salomon A, Auger N, et al. A new model of patient tumor-derived breast cancer xenografts for preclinical assays. Clin Cancer Res 2007;13:3989-98. 10.1158/1078-0432.CCR-07-0078 [DOI] [PubMed] [Google Scholar]
- 28.Chen D, Huang X, Cai J, et al. A set of defined oncogenic mutation alleles seems to better predict the response to cetuximab in CRC patient-derived xenograft than KRAS 12/13 mutations. Oncotarget 2015;6:40815-21. 10.18632/oncotarget.5886 [DOI] [PMC free article] [PubMed] [Google Scholar]
- 29.Guo S, Chen D, Huang X, et al. Cetuximab response in CRC patient-derived xenografts seems predicted by an expression based RAS pathway signature. Oncotarget 2016;7:50575-81. 10.18632/oncotarget.10499 [DOI] [PMC free article] [PubMed] [Google Scholar]
- 30.Zhang L, Yang J, Cai J, et al. A subset of gastric cancers with EGFR amplification and overexpression respond to cetuximab therapy. Sci Rep 2013;3:2992. 10.1038/srep02992 [DOI] [PMC free article] [PubMed] [Google Scholar]
- 31.Yang M, Shan B, Li Q, et al. Overcoming erlotinib resistance with tailored treatment regimen in patient-derived xenografts from naive Asian NSCLC patients. Int J Cancer 2013;132:E74-84. 10.1002/ijc.27813 [DOI] [PubMed] [Google Scholar]
- 32.Guo K, Wang WP, Jiang T, et al. Assessment of epidermal growth factor receptor mutation/copy number and K-ras mutation in esophageal cancer. J Thorac Dis 2016;8:1753. 10.21037/jtd.2016.06.17 [DOI] [PMC free article] [PubMed] [Google Scholar]
- 33.Guo S, Qian W, Cai J, et al. Molecular Pathology of Patient Tumors, Patient-Derived Xenografts, and Cancer Cell Lines. Cancer Res 2016;76:4619-26. 10.1158/0008-5472.CAN-15-3245 [DOI] [PubMed] [Google Scholar]
- 34.Corcoran RB, Atreya CE, Falchook GS, et al. Combined BRAF and MEK Inhibition With Dabrafenib and Trametinib in BRAF V600–Mutant Colorectal Cancer. J Clin Oncol 2015;33:4023-31. 10.1200/JCO.2015.63.2471 [DOI] [PMC free article] [PubMed] [Google Scholar]
- 35.Gao H, Korn JM, Ferretti S, et al. High-throughput screening using patient-derived tumor xenografts to predict clinical trial drug response. Nat Med 2015;21:1318-25. 10.1038/nm.3954 [DOI] [PubMed] [Google Scholar]
- 36.Lorenzen S, Schuster T, Porschen R, et al. Cetuximab plus cisplatin-5-fluorouracil versus cisplatin-5-fluorouracil alone in first-line metastatic squamous cell carcinoma of the esophagus: a randomized phase II study of the Arbeitsgemeinschaft Internistische Onkologie. Ann Oncol 2009;20:1667-73. 10.1093/annonc/mdp069 [DOI] [PubMed] [Google Scholar]
- 37.Wang CY, Deng JY, Cai XW, et al. High EGFR and low p-Akt expression is associated with better outcome after nimotuzumab-containing treatment in esophageal cancer patients: preliminary clinical result and testable hypothesis. Oncotarget 2015;6:18674-82. [DOI] [PMC free article] [PubMed] [Google Scholar]
- 38.Chen Y, Wu X, Bu S, et al. Promising outcomes of definitive chemoradiation and cetuximab for patients with esophageal squamous cell carcinoma. Cancer Sci 2012;103:1979-84. 10.1111/j.1349-7006.2012.02393.x [DOI] [PMC free article] [PubMed] [Google Scholar]
- 39.Gao YB, Chen ZL, Li JG, et al. Genetic landscape of esophageal squamous cell carcinoma. Nat Genet 2014;46:1097-102. 10.1038/ng.3076 [DOI] [PubMed] [Google Scholar]
- 40.Song Y, Li L, Ou Y, et al. Identification of genomic alterations in oesophageal squamous cell cancer. Nature 2014;509:91-5. 10.1038/nature13176 [DOI] [PubMed] [Google Scholar]
- 41.Wang L, Shan L, Zhang S, et al. PIK3CA Gene Mutations and Overexpression: Implications for Prognostic Biomarker and Therapeutic Target in Chinese Esophageal Squamous Cell Carcinoma. Plos One 2014;9:e103021. 10.1371/journal.pone.0103021 [DOI] [PMC free article] [PubMed] [Google Scholar]
- 42.Bardelli A, Corso S, Bertotti A, et al. Amplification of the MET receptor drives resistance to anti-EGFR therapies in colorectal cancer. Cancer Discov 2013;3:658-73. 10.1158/2159-8290.CD-12-0558 [DOI] [PMC free article] [PubMed] [Google Scholar]
- 43.Engelman JA, Zejnullahu K, Mitsudomi T, et al. MET Amplification Leads to Gefitinib Resistance in Lung Cancer by Activating ERBB3 Signaling. Science 2007;316:1039-43. 10.1126/science.1141478 [DOI] [PubMed] [Google Scholar]
- 44.Li B, Li J, Xu WW, et al. Suppression of esophageal tumor growth and chemoresistance by directly targeting the PI3K/AKT pathway. Oncotarget 2014;5:11576-87. [DOI] [PMC free article] [PubMed] [Google Scholar]


