Abstract
Objective
This study aims at assessing post-transcatheter aortic valve(TAV) replacement hemodynamics and turbulence where a same-size SAPIEN3 and Medtronic Evolut are implanted in a rigid aortic root with physiological dimensions and in a representative root with calcific leaflets obtained from patient CT scans.
Methods
TAV hemodynamics were studied by placing a SAPIEN3 26mm and an Evolut 26mm in rigid aortic roots and representative root with calcific leaflets under physiological conditions. Hemodynamics were assessed using high-fidelity particle-image-velocimetry and high-speed imaging. Transvalvular pressure gradients (PG), pin-wheeling indices (PI) and Reynolds shear stress(RSS) were calculated.
Results
(a) PGs obtained with the Evolut and the SAPIEN3 were comparable among the different models (10.5±0.15mmHg vs. 7.76±0.083mmHg in the rigid model along with 13.9±0.19mmHg vs. 5.0±0.09mmHg in representative root with calcific leaflets obtained from patient CT scans respectively); (b) more pinwheeling was found in the SAPIEN3 than the Evolut (0.231±0.057 vs. 0.201±0.05 in the representative root with calcific leaflets and 0.366±0.067 vs. 0.122±0.045 in the rigid model), (c) Higher RSS were found in the Evolut (161.27±3.45 vs. 122.84±1.76Pa in representative root with calcific leaflets and 337.22±7.05 vs. 157.91±1.80Pa in rigid models). More lateral fluctuations were found in representative root with calcific leaflets.
Conclusion
(a) Comparable PGs were found among the TAVs in different models (b) PIs were found different between both TAVs; (b) Turbulence patterns among both TAVs translated by RSS were different. Rigid aortic models yield more conservative estimates of turbulence; (c) Both TAVs exhibit peak maximal RSS that exceeds platelet activation 100Pa threshold limit.
Keywords: Transcatheter Aortic Valve, Turbulence, Hemodynamics, platelet activation
Graphical Abstract
Introduction
Transcatheter aortic valve (TAV) replacement (TAVR) emerged as a percutaneous alternative procedure for surgical aortic valve replacement procedures especially for high-risk patients(1,2). To date, all known heart valve prostheses have been associated with clinical complications and adverse effects resulting from the non-physiological flow patterns caused by their implantation(3,4). Elevated post-procedural pressure gradients, paravalvular leakage, TAV thrombosis and many other degenerative effects particularly on the leaflets are some of these adverse outcomes(5). The relatively rapid degeneration of TAVs compromise their durability due to the mechanical forces exerted on the leaflets as they interact with the pulsatile blood flow and lead to having the patient go through another probable implant(3,4,6).
Transcatheter aortic valves commonly used can be categorized into two distinct types: balloon-expandable, and self-expandable. Clinical studies have shown several significant differences between the two types, including significantly lower frequency of reduced leaflet motion with self-expandable TAVs such as CoreValve or Evolut (4%–6%) compared to 16% for balloon-expandable SAPIEN 3(7) while demonstrating significantly higher rate of moderate to severe paravalvular leakage, significantly higher need for permanent pacemaker implantation, and significantly lower radial force exerted by self-expandable TAVs(4,8–13). The distinct physical differences such as leaflet thickness, leaflet shape, stent frame curvature, and stent profile alters TAV hemodynamics and imposes limitations for both devices(14).
Turbulence distal to heart valves during forward flow is the fundamental fluid dynamics phenomenon responsible for pressure gradient as well as hemolysis and platelet activation. It is a phenomenon fundamental to any fluid where there is shearing (velocity changing significantly lateral to the direction of flow). Specifically turbulence occurs when the velocity is high enough that viscosity is unable to diffuse and damp any local fluctuations in velocity leading to an exponential rise of spatial and temporal fluctuations in velocity. These turbulent fluctuations in velocity lead to significantly strong shear stresses that blood cells and platelets experience compared to laminar flows(15–17) and is dependent on the valve geometry (smoothness of inflow, stent elements etc.), leaflet performance (such as flutter), and distal diameter of the aorta relative to the valve orifice area. These turbulent stresses are referred to as Reynolds stresses and have been well known to correlate with hemolysis and platelet activation. Non-physiological turbulent flow after valve implantation was associated with blood damage ranging from platelet activation (to probably thrombosis) and hemolysis(18–22). Several in-vitro studies investigated the risk of platelet activation post-TAVR and set some thresholds that mark the onset of platelet activation from 10 to 100 Pa(3,6,23–30). Some of these in-vitro studies include Hung et al. who reported platelet damage at 100–165 dynes/cm2 with an exposure time of 102s(31). Williams et al found the onset of platelet activation at 130 dynes/cm2 under an exposure time of 1023s(32). Ramstack et al. reported that platelets get activated at 300–1000 dynes/cm2 at an exposure time of 10s(33). Given all these data and keeping in mind the basic differences between the SAPIEN and the Evolut TAVs, it is thus crucial to assess the turbulence engendered after TAVR with these two distinct TAV types.
In this study, the turbulence engendered immediately downstream of a TAVR valve is evaluated when a SAPIEN and when a Medtronic Evolut are implanted in a rigid aortic root with physiological dimensions and in a calcified representative root with calcific leaflets obtained from patient CT scans. The purpose of the latter is to assess the impact of more realistic deployment conditions for the two TAVs on the turbulence of the forward flow distal to the valves. To our knowledge no comparative study of in vitro leaflet kinematic assessment and Reynolds shear stress characterization have been performed across different TAVs. Such a comparison is essential to improve future TAV designs and may provide a rationale behind adverse clinical outcomes (34–37).
Materials and Methods
Valve selection and deployment
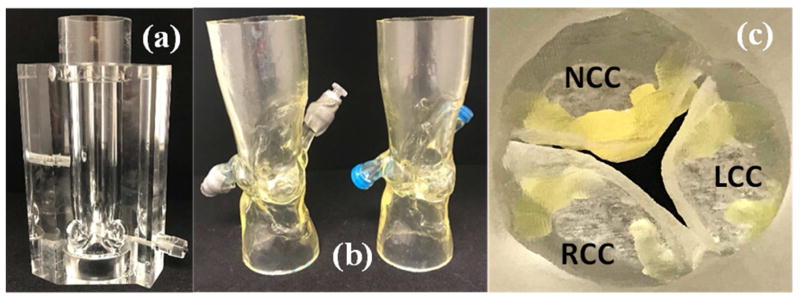
To evaluate post TAVR hemodynamics and turbulence using self-expanding and balloon expandable TAVs, measurements described below were conducted with a 26mm Medtronic Evolut and a 26mm Edwards SAPIEN 3 implanted in rigid aortic roots and representative root with calcific leaflets obtained from patient CT scans shown in Figure 1. The ascending diameter of the aorta in the rigid model is 31.75mm which allows for the Evolut – whose upper part diameter is 32 mm – not to be compressed. The selection of the appropriate aortic root models matched each of the TAV sizes and was based on the recommendations of Kasel et al(38). Distensible extensions were added to the roots to connect to our experimental flow loop setup. Leaflet calcification is shown in Figure 1c and is used to assess the impact of calcification on the hemodynamic performance of the TAVs.
Figure 1.
(a) Rigid aortic valve chamber with sinuses (b) Patient-specific aortic root models with end extensions and (c) Aortic side view of the 3D printed leaflet calcifications in the patient-specific models.
Hemodynamic assessment
Hemodynamic parameters were evaluated under pulsatile flow conditions created by a left heart simulator yielding physiological flow and pressure curves as previously described(39,40). The working fluid in this study was a blood-analogue mixture of water-glycerine (99% pure glycerine) producing a density of 1060Kg/m3 and a kinematic viscosity of 3.5cSt. Sixty consecutive cardiac cycles of aortic pressure, ventricular pressure and flow rate data were recorded at a sampling rate of 100Hz. The mean transvalvular pressure gradient (PG) is defined as the average of positive pressure difference between the ventricular and aortic pressure curves during forward flow.
The effective orifice area (EOA) is an important parameter to evaluate valve orifice opening. EOA was computed using the Gorlin’s equation:
| (1) |
Where Q represents the root mean square aortic valve flow over the same averaging interval of the PG.
The pinwheeling index (PI) is an indication with implications on leaflet durability and resilience(41–43). It is computed from still frames obtained from high-speed imaging as follows and in accordance with Midha et al:
| (2) |
Where Lactual represents the deflected free edge of the leaflet and Lideal represents the unconstrained ideal configuration of the leaflet free edge.
Particle Image Velocimetry (PIV)
For PIV, the flow was seeded with fluorescent PMMA-Rhodamine B particles with diameters ranging from 1 to 20 μm. For all cases, the velocity field within the distal flow region were measured using high spatial and temporal resolution PIV. Briefly, this involved illuminating the flow region using a laser sheet created by pulsed Nd:YLF single cavity diode pumped solid state laser coupled with external spherical and cylindrical lenses; while acquiring high-speed images of the fluorescent particles within the region. Time-resolved PIV images were acquired with a resulting spatial and temporal resolutions of 0.0723mm/pixel and 1000Hz respectively. Phase locked measurements were recorded for 4 phases of the cardiac cycle (acceleration, peak, deceleration and diastole) repetitively 250 times with a spatial resolution of 0.0723mm/pixel. Refraction was corrected using a calibration in DaVis particle image velocimetry software (DaVis 7.2, LaVision Germany). Velocity vectors were calculated using adaptive cross-correlation algorithms. Further details of PIV measurements can be found in Hatoum et al(4).
Vorticity Dynamics
Using the velocity measurements from PIV, vorticity dynamics were also evaluated distal to the valve. Vorticity is the curl of the velocity field and therefore captures rotational components of the blood flow shearing as well as visualizing turbulent eddies. Regions of high vorticity along the axis perpendicular to the plane indicate both shear and rotation of the fluid particles. Vorticity was computed using the following equation:
| (3) |
Where ωz is the vorticity component with units of s−1; Vx and Vy are the x and y components of the velocity vector with units of m/s. The x and y directions are axial and lateral respectively with the z direction being out of measurement plane.
Reynolds shear stress (RSS) and turbulent kinetic energy (TKE)
Reynolds shear stress has been widely correlated to turbulence and platelet activation(18,19). It is a statistical quantity that measures the shear stress between fluid layers when fluid particles decelerate or accelerate while changing direction(26). TKE is a measurement of the kinetic energy of eddies and indicates turbulence intensity(26).
| (4) |
Where ρ is the blood density and u′ and v′ are the instantaneous velocity fluctuations in the x and y directions respectively.
| (5) |
Statistics
Statistical analysis in this study was performed using JMP® Pro, 13.0.0, (SAS Institute Inc., Cary, NC). All data are presented as mean ± SE. Student’s t test was used to compare the means and p < 0.05 was considered statistically significant. Analyses were performed over 60 replicates.
Results
Hemodynamic parameters
Table 1 shows hemodynamic parameters obtained from flow and pressure data for the different valves in the different models. In the rigid model, the Evolut yielded higher pressure gradient (10.5±0.15 mmHg) thus lower EOA (1.8±0.036cm2) compared with the SAPIEN 3 (7.76±0.083mmHg and 2.1±0.025cm2 respectively) (p<0.001). In the representative root with calcific leaflets model, similarly, the Evolut yielded higher pressure gradient (13.9±0.19mmHg) thus lower EOA (1.5±0.004cm2) compared with the SAPIEN 3 (5.0±0.009mmHg and 1.7±0.011cm2 respectively) (p<0.001).
Table 1.
Average hemodynamic parameters of the different valves. Values are reported ± standard deviation.
| Valve Type | Model Type | ΔP (mmHg) | EOA (cm2) | RF (%) | Pinwheeling Index | Peak RSS (Pa) |
|---|---|---|---|---|---|---|
| Evolut | Patient-Specific | 13.9±0.19 | 1.5±0.004 | 32.10±0.70 | 0.201±0.05 | 161.27±3.45 |
| Rigid | 10.5±0.15 | 1.8±0.036 | 15.74±0.73 | 0.122±0.045 | 337.22±7.05 | |
| SAPIEN 3 | Patient-Specific | 5.0±0.09 | 1.7±0.011 | 23.75±0.75 | 0.231±0.057 | 122.84±1.76 |
| Rigid | 7.76±0.083 | 2.1±0.025 | 10.92±0.11 | 0.366±0.067 | 157.91±1.80 |
The Evolut and the SAPIEN3 yielded different PGs in the representative root with calcific leaflets models compared to the rigid ones (13.9±0.19mmHg vs. 10.5±0.15mmHg; for the Evolut and 5.0±0.09mmHg vs. 7.76±0.083mmHg for the SAPIEN) (p<0.001).
Leaflet kinematics and pinwheeling index
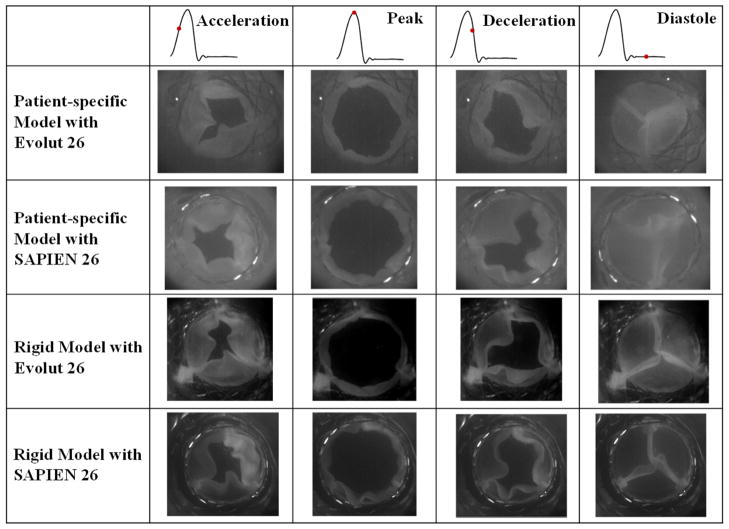
Figure 2 shows en-face images of every valve in each of the representative root with calcific leaflets and rigid models at 4 phases of the cardiac cycle based on flow: acceleration, peak, deceleration and diastole. Video 1 shows the valve leaflets deformations and the significant central coaptation region twisting or pinwheeling. In the representative root with calcific leaflets model, the onset of the opening and the closure starts with one leaflet (bottom right leaflet) followed by the two others with the Evolut. However for the SAPIEN 3, the opening and closing mechanism is symmetrical. Both valves nevertheless fully open at peak systole. In the rigid model, the Evolut and the SAPIEN 3 open and close fully and symmetrically with all three leaflets together. In both models, the Evolut leaflets show more flutter compared to the SAPIEN 3.
Figure 2.
En-face imaging of the valves at different phases in the cardiac cycle.
Video 1.
En-face imaging views of the valves throughout the cardiac cycle.
The pinwheeling indices are tabulated in Table 1. The SAPIEN 3 showed higher pinwheeling indices in both representative root with calcific leaflets and rigid models compared to the Evolut (0.231±0.057 vs. 0.201±0.05 in the representative root with calcific leaflets model and 0.366±0.067 vs. 0.122±0.045 in the rigid model). The coaptation mismatch in the SAPIEN 3 led to warping of the leaflets’ edges. The Evolut yielded higher pinwheeling index in the representative root with calcific leaflets model than in the rigid one (0.201±0.05 vs. 0.122±0.045 in the representative root with calcific leaflets model vs. rigid one). However the differences were not significant (p = 0.12). The SAPIEN 3 on the other hand showed the opposite (0.231±0.057 vs. 0.366±0.067 in the representative root with calcific leaflets model vs. rigid one), however the differences were not significant (p = 0.06).
Flow velocity field
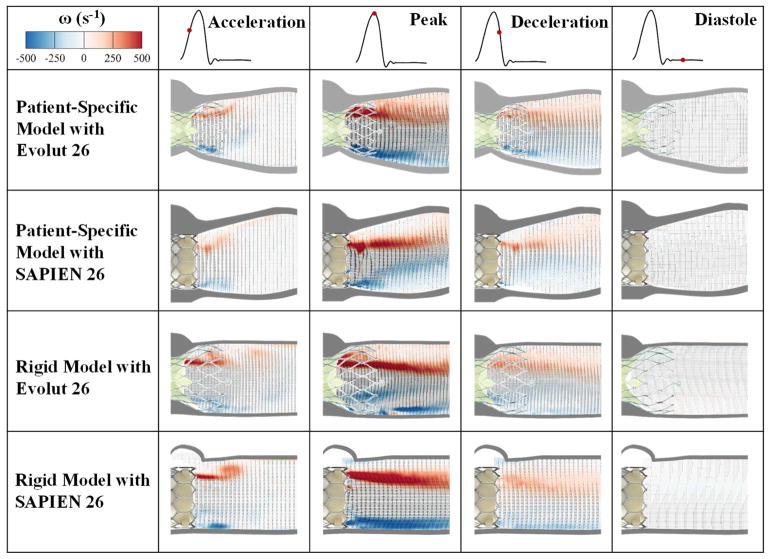
Flow velocity field is an important indicator of the velocity and vorticity state of the flow highlighting high-velocity and high-rotation regions. The flow velocity field clearly shows the differences after implantation of many different TAVs. As velocity is an important factor in evaluating post-TAVR dynamics clinically, velocity fields provide this comprehensive information. Figure 3 shows the phase averaged velocity vectors and vorticity contours at the four different phases in the cardiac cycle for the different valves and models. Video 2 shows an animation of the flow field development (vorticity contours and velocity vectors) throughout one cardiac cycle for each model and valve and Video 3 shows the fluid particles streaks for every valve case in every model over the cardiac cycle. The dark streaks of red and blue vorticity contours represent the shear layers corresponding to the jet boundaries and the distance between them represents the width of the jet. Shear layers appear during acceleration phase.
Figure 3.
Phase averaged velocity vectors and vorticity contours at different phases in the cardiac cycle.
Video 2.
Ensemble averaged velocity vectors and vorticity contours for the valves.
Video 3.
Main flow streak visualization of the different valves.
Comparing the representative root with calcific leaflets models, the velocity with the Evolut starts at 0.88m/s during acceleration to reach 2.3m/s at peak systole, then 1.3m/s during deceleration. With the SAPIEN 3, the velocity starts at 0.46 m/s during acceleration, reaches 1.65m/s at peak systole, then 0.62 m/s during deceleration. The velocity is near zero during diastole for both cases reaching a maximum of 0.2m/s. It is clear that in the representative root with calcific leaflets models, the shear layers at peak systole are seen to diffuse laterally along the flow direction with more diffusion seen distal to the Evolut.
Comparing the rigid models, the velocity with the Evolut starts at 1.00m/s during acceleration to reach 2.45m/s at peak systole, then 1.37m/s during deceleration. With the SAPIEN 3, the velocity starts at 0.86m/s during acceleration, reaches 2.10m/s at peak systole, then 0.94m/s during deceleration. The velocity is near zero during diastole reaching a maximum of 0.19m/s for both cases.
Compared to the representative root with calcific leaflets models, the shear layers and vortical structures in the rigid models with both valves exhibit a more stable and steady behavior especially during peak systole. Lateral turbulent diffusion however is more prevalent in the Evolut in accordance with the results observed in the representative root with calcific leaflets models. The peak vorticity was calculated to be 565s−1 for the Evolut in the representative root with calcific leaflets model, 668s−1 for the SAPIEN with representative root with calcific leaflets model, 676s−1 for the Evolut with the rigid model and 851s−1 for the SAPIEN with the rigid model. Parallelism of the shear layers (tendency of the shear layers to remain parallel to each other) is more maintained in the rigid models, particularly with the SAPIEN.
Reynolds shear stress (RSS) fields
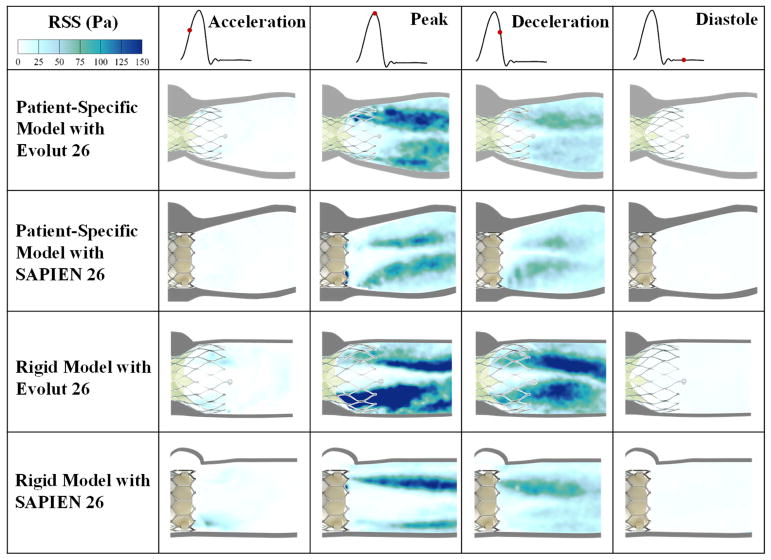
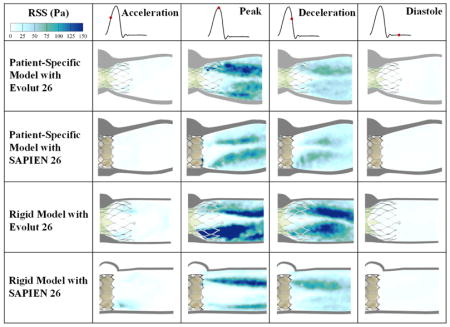
The importance of RSS arises from its connection to platelet activation and its account of the turbulent fluctuations of the blood velocity(18–22). Figure 4 shows the principal Reynolds shear stresses at different phases in the cardiac cycle for the different valves and models. The contour plots of the RSS mirror those of the vortical shear layer structures in Figure 3 with RSS peaking in areas with more diffused shear layer vorticity.
Figure 4.
Principal Reynolds shear stresses at different phases in the cardiac cycle.
The Evolut and the SAPIEN 3 valves exhibit higher RSS in the acceleration phase with the rigid model than the representative root with calcific leaflets model. Peak RSS in that phase reaches 46.05Pa for the rigid model with Evolut and 59.9Pa for the rigid model with SAPIEN. While the RSS was calculated to be 9.40 and 8.87Pa in the representative root with calcific leaflets model for Evolut and SAPIEN respectively.
During peak systole, the Evolut shows higher RSS distributions and magnitudes compared to the SAPIEN in both representative root with calcific leaflets and rigid models. Table 1 encompasses the peak RSS values. In the representative root with calcific leaflets models, RSS were equal to 161.27Pa and 122.84Pa with the Evolut and SAPIEN respectively. In the rigid model, RSS were equal to 337.22Pa and 157.91Pa with the Evolut and SAPIEN respectively. It is also clear that the rigid models show higher RSS magnitudes with both valves.
After the peak, RSS decrease throughout deceleration and diastole. During deceleration, the maximum RSS obtained was with the Evolut in the rigid model (164.5Pa).
Turbulent kinetic energy (TKE)
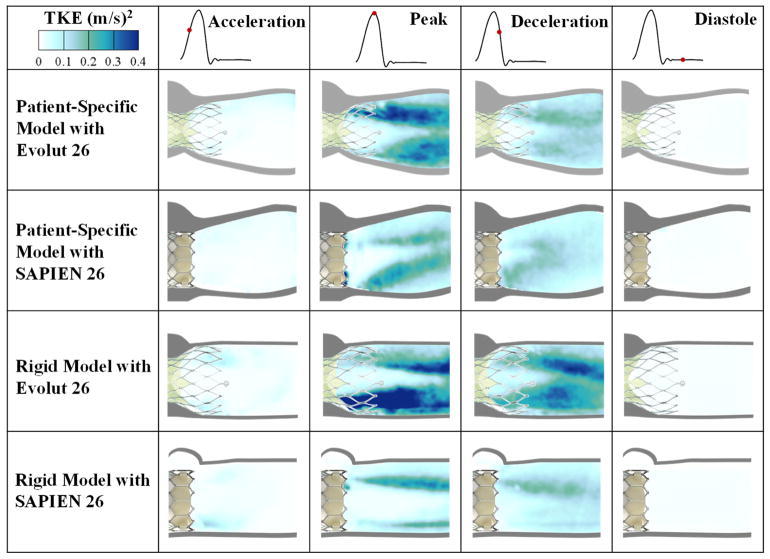
TKE is the energy in velocity fluctuations and is dissipated by viscous forces through intense temporal events of blood shearing. It indicates how turbulent the blood flow is thus giving an idea about the performance of the TAV implanted. Turbulent kinetic energy contour plots mirror those of the RSS. Thus, the Evolut exhibits the highest TKE levels compared to the SAPIEN in both models particularly at peak systole. In the representative root with calcific leaflets model with Evolut, peak TKE was calculated to be 0.39 m2/s2 while the SAPIEN in the same model exhibited a TKE of 0.29m2/s2. In the rigid model with Evolut, TKE was calculated to be 0.59m2/s2 while the SAPIEN gave a value of 0.30m2/s2.
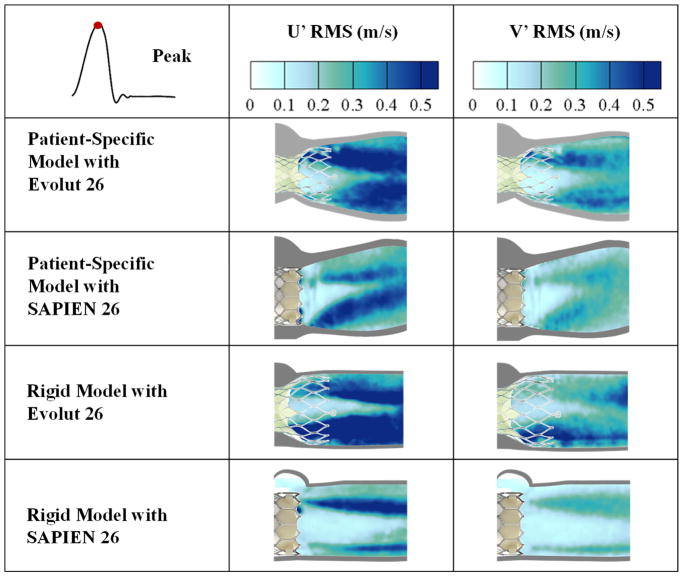
Turbulent velocity fluctuations (U′RMS and V′RMS)
Velocity fluctuations are characteristics of turbulent flow. These fluctuations give an indication about how turbulent the blood flow is thus providing an assessment of the TAV performance. Figure 6 shows the standard deviation contour plots of the turbulent velocity fluctuations U′ and V′ for the different valves and models at peak systole. As is the case for RSS and TKE, a large U′RMS or V′RMS indicate a higher level of turbulence. U′RMS and V′RMS are highest with the Evolut in both representative root with calcific leaflets and rigid models (0.55m/s and 0.44m/s versus 0.76m/s and 0.51m/s respectively).
Figure 6.
Standard deviation contour plots of the random velocity fluctuations U′ and V′ for the different valve models at peak systole.
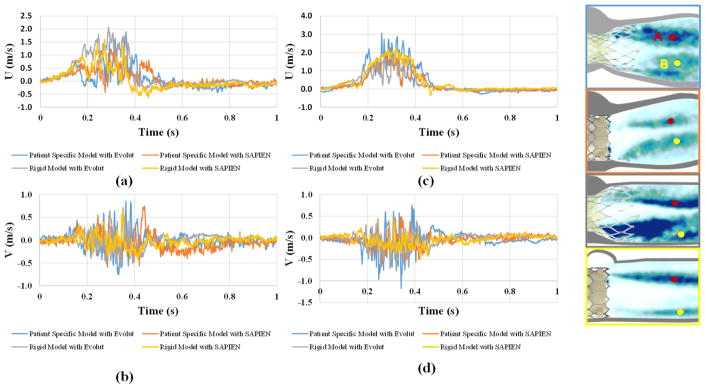
To better assess the turbulent velocity fluctuations, the instantaneous velocity taken at 2 different points (labeled A and B) on the respective shear layers of the 4 valve cases are plotted versus the cardiac cycle time in the x direction and y directions. The plots are shown in Figure 7 and a summary of the values is given in Table 2. Time fluctuations are assessed in terms of the standard deviations of these plots and are associated with the degree of turbulence. The plots show clearly that at point A, the rigid model with the Evolut valve shows more spread out fluctuations in the x direction (standard deviation 0.58m/s) and the representative root with calcific leaflets model with the Evolut shows more fluctuations in the y direction (standard deviation 0.194m/s). At point B, the representative root with calcific leaflets model with Evolut shows higher fluctuations in both the x and y directions (0.752m/s and 0.211m/s respectively). The fluctuations in the y direction are higher in the representative root with calcific leaflets models with both valves compared with those of the rigid models at both points A and B.
Figure 7.
(a, c) Instantaneous velocity in the x direction (U) and (c, d) Instantaneous velocity in the y direction (V) plots of the different valve combinations through the cardiac cycle at points A and B respectively in the shear layers.
Table 2.
Standard deviations of the velocities in the x and y directions (U and V respectively) at points A and B for the different valve combinations during the cardiac cycle.
| Patient Specific Model | Rigid Model | |||||
|---|---|---|---|---|---|---|
| Evolut | SAPIEN | Evolut | SAPIEN | |||
| Standard Deviation (m/s) | x direction | Point A | 0.389 | 0.303 | 0.580 | 0.394 |
| Point B | 0.752 | 0.541 | 0.522 | 0.750 | ||
| y direction | Point A | 0.194 | 0.187 | 0.149 | 0.128 | |
| Point B | 0.211 | 0.143 | 0.159 | 0.136 | ||
Discussion
In this study, the differences engendered as a result of the two different TAVs (Evolut and SAPIEN) was assessed through looking at (a) hemodynamic parameters and (b) turbulence in two different models one rigid and another representative root with calcific leaflets. The importance of studying turbulence post-TAVR stems from its effect on platelet activation, hemolysis, and effects on pressure drop and recovery. Also, the importance of studying the idealized vs realistic aortic root is to assess how baseline design of these valves does not necessarily translate to in-situ setting.
Effect of anatomically realistic valve mounting on hemodynamic parameters
The different TAVs yielded different hemodynamic parameters specifically in terms of pressure gradients. The most striking differences are seen between the representative root with calcific leaflets models and the rigid models with the main difference being that in the rigid model the valves were deployed in an idealistic manner and reach their full potential in an idealized circular orifice. However, in the representative root with calcific leaflets models the valves were deployed in an anatomically realistic configuration. The non-circular anatomy and calcification on and around the leaflets in the representative root with calcific leaflets models clearly play an important role in the apposition of the TAV thus its sealing(4,44,45). The leaflet stiffness in this model also plays a role in the valve shape post-deployment as non-circular final shape may be a consequence, in addition to the distribution of the calcium adding to this stiffness and helping the non-circular and non-complete apposition of the TAV. Since the SAPIEN is balloon-expandable, PGs were lower as the radial force exerted by the balloon gives SAPIEN3 advantage in this case(4,44,45).
Leaflet kinematics and pinwheeling index
PI is a dimensionless index used to quantify valve leaflet deformation severity and coaptation mismatch. High PIs are often associated with low durability therefore accelerated failure of valve leaflets(41–43). The SAPIEN showed higher pinwheeling indices than the Evolut in both representative root with calcific leaflets and rigid models. This may be due to the higher compression near the region of the leaflets in the SAPIEN compared to the supra-annular design of the Evolut where stresses are not as much(43). Chakravarty et al(7) have shown in-vivo data with more leaflet thrombosis prevalent in the SAPIEN than Evolut. In Video 1, it is clear that during peak flow, the SAPIEN3 leaflets almost touch the stent inhibiting flow in the neo-sinus(46) contrary to the Evolut where the supra-annular leaflet position along with the curved stent design allow for washout. It should be noted that pinwheeling is root and native valve calcium induced geometry specific. The values shown in this study cannot be generalized and actual pinwheeling will be very patient-dependent. But it is interesting that the SAPIEN valve pinwheeled more despite its advantage in orifice opening underpinning some fundamental design influences in how the leaflets are shaped and mounted in the two valves. Further studies are clearly needed to assess which valve is more “robust” to avoid pinwheeling. Pinwheeling is also dependent upon the maximum expansion allowed and the extent of eccentricity of the orifice.
Flow velocity field and vorticity dynamics
The flow velocity fields and shear layers are different among the different valves and the models. The better apposition of the SAPIEN in the calcified aortic root as previously explained provides more flow area thus lower jet velocity compared to the Evolut in the representative root with calcific leaflets models. In the rigid models, the SAPIEN yields lower velocities. This comes in concordance with the pressure gradient data explained above.
Turbulence is characterized by high levels of fluctuating vorticity. For this reason, vorticity dynamics play an essential role in the description of turbulent flows(47). Turbulent flows always exhibit high levels of fluctuating vorticity as is evident in Figure 3 contours and Video 2. In addition, shear layers in both TAVs seem to dissipate and to exhibit an unsteady behavior more quickly in the representative root with calcific leaflets models compared to the rigid ones. The reason behind that may be attributed to the flexible and more complex boundaries in the representative root with calcific leaflets models. In a flexible medium, flow waves tend to be stabilized when the boundary has a compliant response to them but it was found that the effect of internal friction in the flexible medium may be destabilizing(48,49).
Reynolds shear stress (RSS) field
The importance of RSS arises from its connection to platelet activation and its account of the turbulent fluctuations of the blood velocity(18–22). Reynolds stress is produced when fluid particles decelerate or accelerate while changing direction(22).
The SAPIEN yielded lower RSS in both representative root with calcific leaflets and rigid models compared with the Evolut specifically at peak systole. This difference may be attributed to the distal meshed stent frame of the Evolut that protrudes along the Sinotubular junction. Turbulence studies have emphasized the effect of porous media on increasing the flow turbulence, unsteadiness and chaos(50,51). In addition, studies have shown that the presence of grids enhances turbulence, promotes rapid decay and diffusion axially, and increases skewness of the velocity fluctuation(52). This highlights the effect of the Evolut stent on the higher RSS calculated in both representative root with calcific leaflets and rigid models.
In addition, the representative root with calcific leaflets models provide lower RSS values compared with the rigid ones. The reason is because of the compliant walls cause fluctuations thus dissipating RSS (48).
Based on the peak RSS values calculated, it seems that both TAVs cross the threshold of 100Pa defined as the onset of platelet activation(3,33,53), whether in the representative root with calcific leaflets or the rigid models, with the rigid models yielding more conservative – as in higher – estimates. The SAPIEN’s peak values come in accordance with those found in a similar study by Gunning et al(26). One in-vitro study highlighted the impact of the SAPIEN structure on enhancing platelet activation thus thrombus formation(54). Ultimately, given that all cases exceed 100Pa, TAV leaflet thrombosis is dependent on many factors besides RSS, mainly sinus washout(40,55).
Turbulent kinetic energy (TKE) and velocity fluctuations effect
TKE and U′RMS and V′RMS are closely related as introduced in the methodology. Because the velocity fluctuations in the x direction occur prevalently in both models with both SAPIEN and Evolut TAVs, the main element of focus here is the fluctuation in the lateral (y) direction. The fluctuations in the y-direction are tightly related to the unsteadiness explained in the velocity and vorticity fields above. Given that in the representative root with calcific leaflets models unsteadiness prevails compared with the rigid models, it is intuitive to have high lateral direction fluctuations. Similarly, as discussed above, the Evolut stent yields more unsteadiness causing the higher fluctuations with the Evolut than the SAPIEN. TKE contours reinforce these results. In addition, the more significant leaflet flutter observed in Video 1 with Evolut in both models comes in agreement with these lateral fluctuations and enhance the generated turbulence.
Limitations
The experiments conducted in this study look into 2 distinct valves of the same size 26mm: A Medtronic Evolut and an Edwards SAPIEN. Although not anticipated, valve-to-valve variability (for the same size) is not addressed in this study. That said, the lack of a curved aorta is an additional limitation. Future studies are needed for capturing the influence of aortic curvature on any modification of turbulence distal to the valve. Another limitation may be related to the precise interaction between the valve stent and the 3D printed native leaflets as there is large variability between patients in the stiffness of the leaflets. Short axis PIV is also lacking and studies using stereo capabilities or tomographic PIV systems are needed.
Conclusion
The hemodynamic performance and turbulence of two 26mm TAVs (Medtronic Evolut and Edwards SAPIEN3) in rigid and representative root with calcific leaflets obtained from patient CT scans models were assessed and compared in this study. The main hemodynamic parameters in terms of pressure gradients were of the same order while pinwheeling indices were higher with the SAPIEN3. The flow among both TAVs was different in terms of velocity fields, shear layer characteristics, RSS values and contours along with velocity fluctuations. While the SAPIEN3 showed higher pinwheeling, it was accompanied by lower RSS compared with the Evolut due to the Evolut’s distal stent structure interacting with the flow. Despite achieving less RSS, the SAPIEN still exhibits RSS that exceeds the threshold for platelet activation which may explain the higher thrombosis risk found in-vivo.
Supplementary Material
Figure 5.
Turbulent kinetic energy at different phases in the cardiac cycle.
Acknowledgments
Funding: The research done was partly supported by National Institutes of Health (NIH) under Award Number R01HL119824.
GLOSSARY OF ABBREVIATIONS
- TAV
Transcatheter Aortic Valve
- TAVR
Transcatheter Aortic Valve Replacement
- RSS
Reynolds Shear Stress
- PI
Pinwheeling Index
- PIV
Particle Image Velocimetry
- EOA
Effective Orifice Area
- PG
Pressure Gradients
Footnotes
Conflict of Interest: Dr. Crestanello reports having grants from Medtronic, Boston Scientific and Abbot in addition to being part of the advisory board for Medtronic. Dr. Dasi and Ms. Yousefi report having two patent applications on novel surgical and transcatheter valves. No other conflicts were reported.
Publisher's Disclaimer: This is a PDF file of an unedited manuscript that has been accepted for publication. As a service to our customers we are providing this early version of the manuscript. The manuscript will undergo copyediting, typesetting, and review of the resulting proof before it is published in its final citable form. Please note that during the production process errors may be discovered which could affect the content, and all legal disclaimers that apply to the journal pertain.
References
- 1.Padala M, Sarin EL, Willis P, et al. An engineering review of transcatheter aortic valve technologies. Cardiovascular Engineering and Technology. 2010;1:77–87. [Google Scholar]
- 2.Rodés-Cabau J. Transcatheter aortic valve implantation: current and future approaches. Nature Reviews Cardiology. 2012;9:15. doi: 10.1038/nrcardio.2011.164. [DOI] [PubMed] [Google Scholar]
- 3.Dasi LP, Simon HA, Sucosky P, Yoganathan AP. Fluid mechanics of artificial heart valves. Clinical and experimental pharmacology and physiology. 2009;36:225–237. doi: 10.1111/j.1440-1681.2008.05099.x. [DOI] [PMC free article] [PubMed] [Google Scholar]
- 4.Dasi LP, Hatoum H, Kheradvar A, et al. On the mechanics of transcatheter aortic valve replacement. Annals of biomedical engineering. 2017;45:310–331. doi: 10.1007/s10439-016-1759-3. [DOI] [PMC free article] [PubMed] [Google Scholar]
- 5.Mylotte D, Piazza N. Transcatheter aortic valve replacement failure: deja vu ou jamais vu? Am Heart Assoc. 2015:1–4. doi: 10.1161/CIRCINTERVENTIONS.115.002531. [DOI] [PubMed] [Google Scholar]
- 6.Yoganathan AP, Chandran K, Sotiropoulos F. Flow in prosthetic heart valves: state-of-the-art and future directions. Annals of biomedical engineering. 2005;33:1689–1694. doi: 10.1007/s10439-005-8759-z. [DOI] [PubMed] [Google Scholar]
- 7.Chakravarty T, Søndergaard L, Friedman J, et al. Subclinical leaflet thrombosis in surgical and transcatheter bioprosthetic aortic valves: an observational study. The Lancet. 2017;389:2383–2392. doi: 10.1016/S0140-6736(17)30757-2. [DOI] [PubMed] [Google Scholar]
- 8.van der Boon RM, Van Mieghem NM, Theuns DA, et al. Pacemaker dependency after transcatheter aortic valve implantation with the self-expanding Medtronic CoreValve System. International journal of cardiology. 2013;168:1269–1273. doi: 10.1016/j.ijcard.2012.11.115. [DOI] [PubMed] [Google Scholar]
- 9.Erkapic D, De Rosa S, Kelava A, Lehmann R, Fichtlscherer S, Hohnloser SH. Risk for permanent pacemaker after transcatheter aortic valve implantation: a comprehensive analysis of the literature. Journal of cardiovascular electrophysiology. 2012;23:391–397. doi: 10.1111/j.1540-8167.2011.02211.x. [DOI] [PubMed] [Google Scholar]
- 10.Steinberg BA, Harrison JK, Frazier-Mills C, Hughes GC, Piccini JP. Cardiac conduction system disease after transcatheter aortic valve replacement. American heart journal. 2012;164:664–671. doi: 10.1016/j.ahj.2012.07.028. [DOI] [PubMed] [Google Scholar]
- 11.Généreux P, Head SJ, Hahn R, et al. Paravalvular leak after transcatheter aortic valve replacement: the new Achilles’ heel? A comprehensive review of the literature Journal of the American College of Cardiology. 2013;61:1125–1136. doi: 10.1016/j.jacc.2012.08.1039. [DOI] [PubMed] [Google Scholar]
- 12.Binder RK, Schäfer U, Kuck K-H, et al. Transcatheter aortic valve replacement with a new self-expanding transcatheter heart valve and motorized delivery system. JACC: Cardiovascular Interventions. 2013;6:301–307. doi: 10.1016/j.jcin.2013.01.129. [DOI] [PubMed] [Google Scholar]
- 13.Del Trigo M, Dahou A, Webb JG, et al. Self-expanding Portico valve versus balloon-expandable SAPIEN XT valve in patients with small aortic annuli: comparison of hemodynamic performance. Revista Española de Cardiología (English Edition) 2016;69:501–508. doi: 10.1016/j.rec.2015.08.019. [DOI] [PubMed] [Google Scholar]
- 14.Fanning JP, Platts DG, Walters DL, Fraser JF. Transcatheter aortic valve implantation (TAVI): Valve design and evolution. International Journal of Cardiology. 168:1822–1831. doi: 10.1016/j.ijcard.2013.07.117. [DOI] [PubMed] [Google Scholar]
- 15.Morshed KN, Bark D, Jr, Forleo M, Dasi LP. Theory to predict shear stress on cells in turbulent blood flow. PloS one. 2014;9:e105357. doi: 10.1371/journal.pone.0105357. [DOI] [PMC free article] [PubMed] [Google Scholar]
- 16.Yun BM, Dasi L, Aidun C, Yoganathan A. Highly resolved pulsatile flows through prosthetic heart valves using the entropic lattice-Boltzmann method. Journal of Fluid Mechanics. 2014;754:122–160. [Google Scholar]
- 17.Dasi LP, Morshed KN, Forleo M. Phenomenology of Hemolysis in Turbulent Flows. ASME 2013 Summer Bioengineering Conference: American Society of Mechanical Engineers; 2013; pp. 1–20. [Google Scholar]
- 18.Giersiepen M, Wurzinger L, Opitz R, Reul H. Estimation of shear stress-related blood damage in heart valve prostheses--in vitro comparison of 25 aortic valves. The International journal of artificial organs. 1990;13:300–306. [PubMed] [Google Scholar]
- 19.Nygaard H, Giersiepen M, Hasenkam J, et al. Two-dimensional color-mapping of turbulent shear stress distribution downstream of two aortic bioprosthetic valves in vitro. Journal of biomechanics. 1992;25:437–440. doi: 10.1016/0021-9290(92)90262-y. [DOI] [PubMed] [Google Scholar]
- 20.Hanle D, Harrison E, Yoganathan A, Corcoran W. Turbulence downstream from the Ionescu-Shiley bioprosthesis in steady and pulsatile flow. Medical and Biological Engineering and Computing. 1987;25:645–649. doi: 10.1007/BF02447332. [DOI] [PubMed] [Google Scholar]
- 21.Schoephoerster RT, Chandran KB. Velocity and turbulence measurements past mitrial valve prostheses in a model left ventricle. Journal of biomechanics. 1991;24:549–562. doi: 10.1016/0021-9290(91)90288-x. [DOI] [PubMed] [Google Scholar]
- 22.Jones SA. A relationship between Reynolds stresses and viscous dissipation: implications to red cell damage. Annals of biomedical engineering. 1995;23:21–28. doi: 10.1007/BF02368297. [DOI] [PubMed] [Google Scholar]
- 23.Wurzinger L, Opitz R, Wolf M, Schmid-Schönbein H. “Shear induced platelet activation”-A critical reappraisal. Biorheology. 1985;22:399–413. doi: 10.3233/bir-1985-22504. [DOI] [PubMed] [Google Scholar]
- 24.Claiborne TE, Slepian MJ, Hossainy S, Bluestein D. Polymeric trileaflet prosthetic heart valves: evolution and path to clinical reality. Expert review of medical devices. 2012;9:577–594. doi: 10.1586/erd.12.51. [DOI] [PMC free article] [PubMed] [Google Scholar]
- 25.Puri R, Auffret V, Rodés-Cabau J. Bioprosthetic valve thrombosis. Journal of the American College of Cardiology. 2017;69:2193–2211. doi: 10.1016/j.jacc.2017.02.051. [DOI] [PubMed] [Google Scholar]
- 26.Gunning PS, Saikrishnan N, McNamara LM, Yoganathan AP. An in vitro evaluation of the impact of eccentric deployment on transcatheter aortic valve hemodynamics. Annals of biomedical engineering. 2014;42:1195–1206. doi: 10.1007/s10439-014-1008-6. [DOI] [PubMed] [Google Scholar]
- 27.Saikrishnan N, Gupta S, Yoganathan AP. Hemodynamics of the Boston Scientific Lotus™ valve: an in vitro study. Cardiovascular Engineering and Technology. 2013;4:427–439. [Google Scholar]
- 28.Sutera SP. Flow-induced trauma to blood cells. Circulation research. 1977;41:2–8. doi: 10.1161/01.res.41.1.2. [DOI] [PubMed] [Google Scholar]
- 29.Alemu Y, Bluestein D. Flow-induced platelet activation and damage accumulation in a mechanical heart valve: numerical studies. Artificial organs. 2007;31:677–688. doi: 10.1111/j.1525-1594.2007.00446.x. [DOI] [PubMed] [Google Scholar]
- 30.Sirois E, Mao W, Li K, Calderan J, Sun W. Simulated Transcatheter Aortic Valve Flow: Implications of Elliptical Deployment and Under-Expansion at the Aortic Annulus. Artificial organs. 2018;0:0–0. doi: 10.1111/aor.13107. [DOI] [PMC free article] [PubMed] [Google Scholar]
- 31.Hung T, Hochmuth R, Joist J, Sutera S. Shear-induced aggregation and lysis of platelets. ASAIO Journal. 1976;22:285–290. [PubMed] [Google Scholar]
- 32.Williams A. Release of serotonin from human platelets by acoustic microstreaming. The Journal of the Acoustical Society of America. 1974;56:1640–1643. doi: 10.1121/1.1903490. [DOI] [PubMed] [Google Scholar]
- 33.Ramstack J, Zuckerman L, Mockros L. Shear-induced activation of platelets. Journal of biomechanics. 1979;12:113–125. doi: 10.1016/0021-9290(79)90150-7. [DOI] [PubMed] [Google Scholar]
- 34.Mack MJ, Leon MB, Smith CR, et al. 5-year outcomes of transcatheter aortic valve replacement or surgical aortic valve replacement for high surgical risk patients with aortic stenosis (PARTNER 1): a randomised controlled trial. The Lancet. 2015;385:2477–2484. doi: 10.1016/S0140-6736(15)60308-7. [DOI] [PubMed] [Google Scholar]
- 35.Barbanti M, Petronio AS, Ettori F, et al. 5-year outcomes after transcatheter aortic valve implantation with CoreValve prosthesis. JACC: Cardiovascular interventions. 2015;8:1084–1091. doi: 10.1016/j.jcin.2015.03.024. [DOI] [PubMed] [Google Scholar]
- 36.Webb J, Gerosa G, Lefèvre T, et al. Multicenter evaluation of a next-generation balloon-expandable transcatheter aortic valve. Journal of the American College of Cardiology. 2014;64:2235–2243. doi: 10.1016/j.jacc.2014.09.026. [DOI] [PubMed] [Google Scholar]
- 37.Toggweiler S, Humphries KH, Lee M, et al. 5-year outcome after transcatheter aortic valve implantation. Journal of the American College of Cardiology. 2013;61:413–419. doi: 10.1016/j.jacc.2012.11.010. [DOI] [PubMed] [Google Scholar]
- 38.Kasel AM, Cassese S, Bleiziffer S, et al. Standardized imaging for aortic annular sizing. JACC: Cardiovascular Imaging. 2013;6:249–262. doi: 10.1016/j.jcmg.2012.12.005. [DOI] [PubMed] [Google Scholar]
- 39.Forleo M, Dasi LP. Effect of hypertension on the closing dynamics and lagrangian blood damage index measure of the B-Datum Regurgitant Jet in a bileaflet mechanical heart valve. Annals of biomedical engineering. 2014;42:110–122. doi: 10.1007/s10439-013-0896-1. [DOI] [PubMed] [Google Scholar]
- 40.Hatoum H, Moore BL, Maureira P, Dollery J, Crestanello JA, Dasi LP. Aortic sinus flow stasis likely in valve-in-valve transcatheter aortic valve implantation. The Journal of thoracic and cardiovascular surgery. 2017;154:32–43 e1. doi: 10.1016/j.jtcvs.2017.03.053. [DOI] [PMC free article] [PubMed] [Google Scholar]
- 41.Martin C, Sun W. Simulation of long-term fatigue damage in bioprosthetic heart valves: effects of leaflet and stent elastic properties. Biomechanics and modeling in mechanobiology. 2014;13:759–770. doi: 10.1007/s10237-013-0532-x. [DOI] [PMC free article] [PubMed] [Google Scholar]
- 42.Doose C, Kütting M, Egron S, et al. Valve-in-valve outcome: design impact of a pre-existing bioprosthesis on the hydrodynamics of an Edwards Sapien XT valve. European Journal of Cardio-Thoracic Surgery. 2016:ezw317. doi: 10.1093/ejcts/ezw317. [DOI] [PubMed] [Google Scholar]
- 43.Gunning PS, Saikrishnan N, Yoganathan AP, McNamara LM. Total ellipse of the heart valve: the impact of eccentric stent distortion on the regional dynamic deformation of pericardial tissue leaflets of a transcatheter aortic valve replacement. Journal of The Royal Society Interface. 2015;12:20150737. doi: 10.1098/rsif.2015.0737. [DOI] [PMC free article] [PubMed] [Google Scholar]
- 44.Bianchi M, Ghosh RP, Marom G, Slepian MJ, Bluestein D. Simulation of transcatheter aortic valve replacement in patient-specific aortic roots: effect of crimping and positioning on device performance. Engineering in Medicine and Biology Society (EMBC), 2015 37th Annual International Conference of the IEEE; IEEE; 2015. pp. 282–285. [DOI] [PubMed] [Google Scholar]
- 45.Morganti S, Conti M, Aiello M, et al. Simulation of transcatheter aortic valve implantation through patient-specific finite element analysis: two clinical cases. Journal of biomechanics. 2014;47:2547–2555. doi: 10.1016/j.jbiomech.2014.06.007. [DOI] [PubMed] [Google Scholar]
- 46.Midha PA, Raghav V, Sharma R, et al. The Fluid Mechanics of Transcatheter Heart Valve Leaflet Thrombosis in the Neo-Sinus. Circulation. 2017 doi: 10.1161/CIRCULATIONAHA.117.029479. CIRCULATIONAHA. 117.029479. [DOI] [PubMed] [Google Scholar]
- 47.Laufer J. New trends in experimental turbulence research. Annual Review of Fluid Mechanics. 1975;7:307–326. [Google Scholar]
- 48.Benjamin TB. Effects of a flexible boundary on hydrodynamic stability. Journal of Fluid Mechanics. 1960;9:513–532. [Google Scholar]
- 49.Landahl MT. On the stability of a laminar incompressible boundary layer over a flexible surface. Journal of Fluid Mechanics. 1962;13:609–632. [Google Scholar]
- 50.Antohe B, Lage J. A general two-equation macroscopic turbulence model for incompressible flow in porous media. International Journal of Heat and Mass Transfer. 1997;40:3013–3024. [Google Scholar]
- 51.Mößner M, Radespiel R. Flow simulations over porous media–Comparisons with experiments. Computers & Fluids. 2017;154:358–370. [Google Scholar]
- 52.Yang SK, Chung MK. Turbulent flow through spacer grids in rod bundles. Journal of Fluids Engineering. 1998;120:786–791. [Google Scholar]
- 53.Liu J, Lu P, Chu S. Turbulence characteristics downstream of bileaflet aortic valve prostheses. Journal of biomechanical engineering. 2000;122:118–124. doi: 10.1115/1.429643. [DOI] [PubMed] [Google Scholar]
- 54.Richardt D, Haban-Rackebrandt SL, Stock S, Scharfschwerdt M, Sievers H-H. A matter of thrombosis: different thrombus-like formations in balloon-expandable transcatheter aortic valve prostheses. European Journal of Cardio-Thoracic Surgery. 2018;0(2018):1–5. doi: 10.1093/ejcts/ezy033. [DOI] [PubMed] [Google Scholar]
- 55.Hatoum H, Dollery J, Lilly SM, Crestanello JA, Dasi LP. Implantation Depth and Rotational Orientation Effect on Valve-in-Valve Hemodynamics and Sinus Flow. The Annals of thoracic surgery. 2018;106:1–26. doi: 10.1016/j.athoracsur.2018.01.070. [DOI] [PMC free article] [PubMed] [Google Scholar]
Associated Data
This section collects any data citations, data availability statements, or supplementary materials included in this article.


