

Summary
The mitigation of biofouling has received significant research attention, with particular focus on non‐toxic and sustainable strategies. Here, we investigated quorum sensing inhibitor (QSI) bacteria as a means of controlling biofouling in a laboratory‐scale system. Approximately, 200 strains were isolated from coral (Pocillopora damicornis) and screened for their ability to inhibit quorum sensing (QS). Approximately, 15% of the isolates exhibited QSI activity, and a typical coral symbiotic bacterium, H12‐Vibrio alginolyticus, was selected in order for us to investigate quorum sensing inhibitory activity further. Confocal microscopy revealed that V. alginolyticus extract inhibited biofilm formation from Pseudomonas aeruginosa PAO1. In addition, the secondary metabolites of V. alginolyticus inhibited PAO1 virulence phenotypes by downregulating motility ability, elastase activity and rhamnolipid production. NMR and MS spectrometry suggested that the potential bioactive compound involved was rhodamine isothiocyanate. Quantitative real‐time PCR indicated that the bacterial extract induced a significant downregulation of QS regulatory genes (lasB, lasI, lasR, rhlI, rhlR) and virulence‐related genes (pqsA, pqsR). The possible mechanism underlying the action of rhodamine isothiocyanate analogue involves the disruption of the las and/or rhl system of PAO1. Our results highlight coral microbes as a bioresource pool for developing QS inhibitors and identifying novel antifouling agents.
Introduction
Marine biofouling, defined as the rapid and extensive growth of marine organisms on submerged inanimate and living surfaces, is a severe problem worldwide. The establishment of biofilms in the aquatic environment typically begins with the settlement of microorganisms (bacteria and unicellular eukaryotes), followed by the recruitment of macrofouling species (invertebrate larvae and algal spores) (Dobretsov, 2009) whose accumulation leads to considerable economic consequences for aquaculture equipment, naval vessels and a variety of industrial structures (Braithwaite and McEvoy, 2005; Schultz et al., 2011; Fitridge et al., 2012). Although biocide treatments, including antifouling paints (such as tributyltin and copper), are effective against biofouling, many of these toxins are highly destructive pollutants when used in marine ecosystems (Voulvoulis et al., 2002; Yebra et al., 2004; Thomas and Brooks, 2010). Consequently, there is a need to pursue novel, environmental‐friendly, and non‐toxic compounds that are capable of inhibiting the development of marine biofilms.
The fouling process is often thought of as a general sequence of colonization in terms of settlement and the establishment of a complex community, with the irreversible attachment of bacteria and the formation of a complex film‐like structure as the two key initial steps. The latter are being increasingly recognized for their important roles in the fouling process, and inhibitors of biofilm formation or interference with bacterial signalling processes can mitigate the development of biofilm or even lead to biofilm decline without any toxic effects on the microbes (Deziel et al., 2001). For example, nitric oxide (NO), an intracellular signalling molecule, has been shown to induce a reduction in biofilm (Barraud et al., 2006).
Another more important aspect of signalling is quorum sensing (QS), which regulates the formation and maturation of biofilm during its development (Labbate et al., 2004). Research targeting the bacterial QS system has paid significant attention to the identification of effective QS or biofilm inhibition agents. Therefore, using QS inhibitors or QSI compounds that degrade signalling molecules to mitigate biofilm fouling represents a significant breakthrough (Dobretsov, 2009). Since then, several studies have demonstrated that QSI compounds are capable of reducing the formation of biofilm and further inhibit the development of biofouling (Cushnie and Lamb, 2011; Dobretsov et al., 2011; Karina et al., 2013). Some antifouling substances have recently been identified in microbes and plants (and even animals); these are peptide compounds, such as quorum‐quenching enzyme and small‐molecule compounds (Huang et al., 2016; Bzdrenga et al., 2017). Of particular note, is furanone, a traditional inhibitor that is a potent antagonist of Gram‐negative bacteria (Hentzer et al., 2003), and a type of long‐chain fatty aldehyde, identified as pentadecanal, which acts against Staphylococcus epidermidis biofilm (Casillo et al., 2017), as well as the 2‐sufonylpyrimidines which can significantly inhibit Pseudomonas aeruginosa biofilm (Thomann et al., 2016).
The marine environment is a rich storehouse of natural products possessing antibiofilm properties, and accumulating evidence has confirmed the existence of a diverse array of active compounds in coral, bryozoans, sponge and pyrosomida (Skindersoe et al., 2008; Tello et al., 2012). Furthermore, studies increasingly point to types of planktonic marine bacteria, such as Bacillus spp., Pseudomonas spp., Pseudoalteromonsa spp., and Vibrio spp., as frequent sources for the production of QSI compounds (Teasdale et al., 2009; Mangwani et al., 2015; Benneche et al., 2016; Casillo et al., 2017). Compared with the planktonic environment, coral ecosystems have a much higher biodiversity and represent a potential source from which to isolate QS inhibitors. Indeed, several studies have described the QSI or antibiofilm potential of several natural compounds originating from coral, including the soft coral Antillogorgia elisabethae, the black coral Antipathes dichotoma, the octocoral Eunicea knighti and the cave coral Acropora millepora (Tello et al., 2012; Karina et al., 2013; Diana et al., 2016). The wide existence of QSI bacteria in coral environments invites us to explore the feasibility of QSI‐based biofouling control methods. We hypothesize that coral‐associated bacteria, and their metabolic substances, offer an effective antibiofouling resource in the marine environment.
Despite the abundance of bioactive compounds originating from coral symbiotic organisms, detailed information on the identification of these compounds has yet to be described (Bakkiyaraj et al., 2013). This present study emphasizes the importance of coral‐associated bacteria as a potential model for obtaining naturally occurring products with QSI properties. Given the limited knowledge available on their production by coral bacteria, the aim of our study was to gain a clearer understanding of the ecological relevance of QSI substances secreted by coral‐symbiotic microbes. Here, we used coral as the source material to screen QSI bacteria, and explored isolated bacteria for their QSI potential. Importantly, the bioactive compounds from these bacteria were identified, the expression levels of functional genes were analysed, and the possible antifouling mechanism of action was inferred.
Results
Isolation and identification of QSI bacteria from coral
We screened a total of 30 potential QSI isolates, which all caused colour reduction in Chromobacterium violaceum ATTC12472 (Table S1); representative results are shown in Fig. 1. Some isolates showed promising QSI activity and a clear inhibition of pigment was observed in the 24‐well plate containing the reference strain C. violaceum 12472; in contrast, the zone of inhibition was not detected with the negative control (LB medium) (Fig. 1). The activity of positive isolates was recorded as either strong (+++), medium (++), or weak (+) based on the extent of visible colourlessness by the biosensor (Table S1). The isolate H12 caused a relatively significant reduction, in that the purple pigment of C. violaceum ATTC12472 was completely eliminated (Fig. 1).
Figure 1.
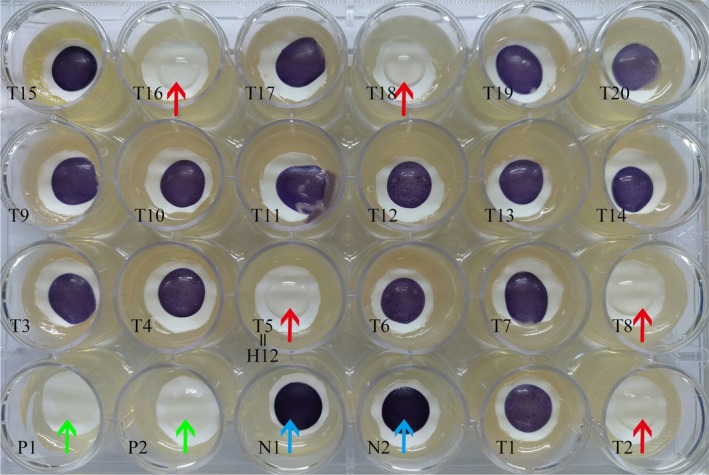
Screening of QSI strains on a 24‐well plate. The plate contained the biosensor strain, C. violaceum 12472 and filter paper with an aperture of 0.22 μm was used for sample detection. LB medium (blue arrows) and furanone (green arrows) served as negative and positive controls respectively. The absence of purple, or the formation of pigment inhibition, was considered indicative of potential QSI positive isolates. The test samples (red arrows, T2, T5, T8, T16 and T18) point to the positive QSI strains and pigment inhibition can be observed on a clear background on the plate. P1 & P2, as well as N1 & N2, represent the two positive controls and two negative controls respectively. T1 to T20 represent the test samples; T5 is the strain H12 used in this study.
Most of the representative isolates shared a 99% 16s RNA sequence similarity with their respective reference strains. After filtering out the low‐quality sequences, and any duplicates from the thirty positive isolates, five representative QSI strains (Vibrio alginolyticus, Staphylococcus hominis, Lysinibacillus fusiform, Staphylococcus warneri and Bacillus cereus) were screened. Their bacterial sequences were submitted to the GenBank Database under the accession numbers MG761744–MG761748. Of the five strains, the isolated strain H12 caused significant colourlessness; this strain had 100% sequence similarity to V. alginolyticus (GenBank number JX566662.1). We tentatively described this as V. alginolyticus 12. Since this was the most active QSI agent, we focused on V. alginolyticus 12 for all subsequent experiments.
Growth and violacein production
None of the tested strains (V. alginolyticus, L. fusiform, S. hominis, B. cereus, and S. warneri) had any apparent effect on the colony‐forming units of C. violaceum 12472 (Fig. 2A). However, we observed that these five bacterial species significantly lowered violacein content, especially V. alginolyticus12 (which reduced violacein production by 95.7%, P < 0.01) (Fig. 2B). Therefore, the reduced production of violacein by bacterial culture was not due to the reduction of the ‘quorum’, but rather because ‘sensing’ was somehow interrupted.
Figure 2.
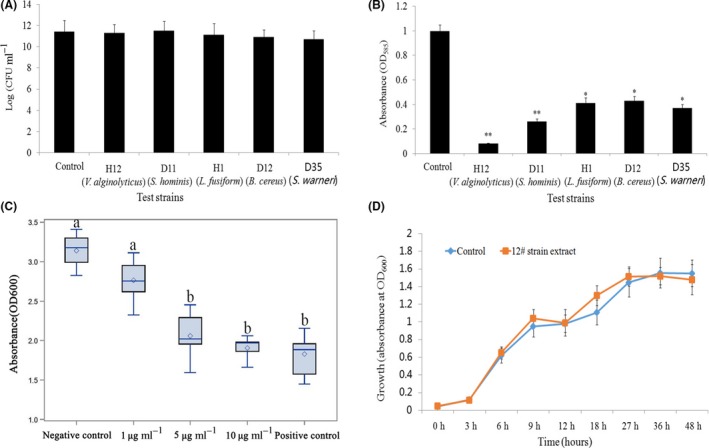
Effect on the colony growth of C. violaceum 12472.
A. Bacterial cell counts from the flask incubation assay. The five tested strains were H12 (V. alginolyticus), D11 (S. hominis), H1 (L. fusiform), D12 (B. cereus) and D35 (S. warneri). CV12472 was incubated for 16 h, with 100 μl of the bacteria, adjusted to an OD 600 nm of 0.1, spread onto the LB plates. Bacterial growth inhibition was compared with corresponding controls. Data are shown as the logarithm of mean CFU ml−1 ± SD.
B. Inhibition of violacein production by the test strains. Violacein production was measured spectrophotometrically (refer to Materials and Methods). Data are shown as the mean ± SD of absorbance at 585 nm. The * and ** represent statistical differences from controls at the P < 0.05 and P < 0.01 level respectively.
C. Biofilm dispersal activity (crystal violet assay) of extracts from the isolated strain V. alginolyticus 12. Bacterial extracts at different concentrations (1, 5 and 10 μg ml−1, w/v) were tested against a biofilm‐forming reference strain, P. aeruginosa PAO1. Tests performed with furanone and methanol only (solvent carrier) acted as the positive and negative controls respectively. Different letters (a or b) indicate a statistically significant difference between experimental groups and the control (P. aeruginosa culture).
D. Effects of the QSI compound on P. aeruginosa PAO1 growth in LB media, with (yellow line) and without (blue line) the 12# strain extract (10 μg ml−1). The extract did not affect the bacterial growth rates. Data are shown as means ± SD (n = 3).
Extract V. alginolyticus 12 inhibited the formation of biofilm
For inhibitory ability, the extract (V. alginolyticus 12) at 1 and 5 μg ml−1 had little effect on the existing biomass of P. aeruginosa PAO1 biofilms after treatment for 24 h (Fig. S1A). At 10 μg ml −1, the extract exhibited a significant direct biofilm reduction effect, although bacterial counts were not affected (Fig. S1B), perhaps because the H12 extract did not exert direct bactericidal effects on pre‐existing P. aeruginosa in the biofilm. Subsequently, the antibiofilm activity of the potent extract (V. alginolyticus 12) was tested against the wild‐type of the widely used biofilm forming isolate P. aeruginosa PAO1. Figure 2C shows the quantitative analysis of PAO1 biofilm inhibition. A dose‐dependent pattern of inhibition was observed with PAO1 biofilm in response to V. alginolyticus 12 extract treatment. The most significant effect appeared at a concentration of 10 μg ml−1, which caused the biofilm formation to decrease by 37.5% (P < 0.05). Visualization attachment analysis by light microscopy also revealed a considerable reduction in biofilm intensity (Fig. S2). Interestingly, we found no statistically significant effect upon the growth of P. aeruginosa in the presence of bacterial extracts (Fig. 2D).
Confocal laser scanning microscopy (CLSM) z‐stack three‐dimensional images provided us with a precise evaluation of the structure of the P. aeruginosa PAO1 biofilm at different time points (12 and 36 h). This revealed reductions in the total biomass and thickness of the biofilm in the group treated with H12 strain extract. Considering its topology, a well‐grown biofilm with adherent bacterial cells was observed in the negative controls (i.e. a normal biofilm developed by P. aeruginosa PAO1), whereas dispersed bacterial cells were observed in the positive control (Fig. S3, b1 and b2) and the treated sample (Fig. S3, a1 and c1). Extremely thick biofilms (containing more cells and polysaccharides) were formed in the negative control relative to those of the experimental group. Furthermore, images clearly showed a disrupted surface topology and height distribution profile of the biofilm that developed in the presence of the V. alginolyticus 12 extract when compared with the control biofilm (taking 36 h as an example; Fig. S3, a2 and c2). In the negative control group, P. aeruginosa PAO1 developed a thick, dense biofilm after 12 h, whereas on a surface coated with the V. alginolyticus 12 bioactive crude extract, biofilm formation and bacterial adherence were prevented (Fig. S3, a1 and c1). At 36 h, corresponding to the mature period of biofilm, viable P. aeruginosa cells accounted for a larger proportion than found in the negative control, which confirmed that strain H12 extract was not toxic to cells within the biofilm. Furthermore, the large proportion of live cells also demonstrated that the QSI extract delayed the biofilm's development (Fig. S3, a2 and c2).
Extract V. alginolyticus 12 reduced the production of QS‐regulated virulence factors
The effects of H12 extract on the swarming motility of P. aeruginosa were determined by inoculating overnight cultures of P. aeruginosa PAO1 onto motility plates; results are shown in Fig. 3A. P. aeruginosa PAO1 exhibited swarming motility on soft agar plates (blank control and negative control) at the point of inoculation with a swarming diameter between 32.4 and 62.5 mm. In the presence of H12 extract (10 μg ml−1) (test group), the results were similar to the positive control (furanone) and the rhodamine isothiocyanate standard in that the swarming ability was significantly reduced (P < 0.01) – only a small colony was formed in the centre with a diameter of approximately 5 mm. In addition, we failed to observe tendril formation, or other features indicative of swarming motility.
Figure 3.
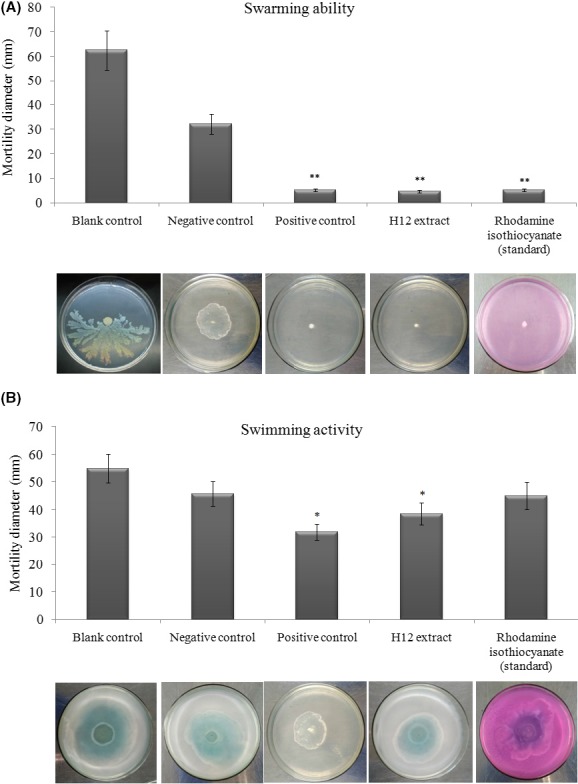
Effects of H12 extract on P. aeruginosa PAO1 motility.
A. swarming ability and (B) swimming ability. The assay was conducted on plates containing 0.3% agar in the absence of H12 extract (10 μg ml−1). Blank control (ddH20), negative control (methanol only), positive control (furanone) and rhodamine isothiocyanate (standard) were also assayed at the same time. Swarming and swimming motility diameters were measured using a caliper. The data represent mean values from three independent experiments performed in duplicate. Values represent means ± standard deviation. The * and ** are statistically different from the negative control at the P < 0.05 and P < 0.01 level respectively.
For the swimming motility (Fig. 3B), in the absence of H12 extract (10 μg ml−1), the swimming motility zone for P. aeruginosa PAO1 was 40.1 ± 6.6 mm. This diameter was lower (P < 0.05) than that observed for the blank control in its normal state (55.9 ± 7.4 mm for swimming). The presence of furanone (the positive control) resulted in a significant reduction (P < 0.05) in swimming motility to 31.9 ± 4.2 mm. However, the rhodamine isothiocyanate standard did not inhibit the swimming ability of P. aeruginosa PAO1 compared with the control; at best, it exerted a weak inhibitory effect that was not statistically significant (P > 0.05) (Fig. 3B).
Another two forms of QS‐related virulence factors, elastase and rhamnolipid, were also analysed spectrophotometrically to assess the effects of H12 extract on the QS system of P. aeruginosa. As shown in Fig. 4, the production of the two QS‐relevant virulence factors was significantly reduced by 10 μg ml−1 of H12 extract. H12 extract clearly reduced elastase activity in the supernatant of treated PAO1, compared with the untreated PAO1 supernatant (blank control and negative control) (P < 0.05) (Fig. 4A). Similarly, the production of rhamnolipid by PAO1 cells was also inhibited by 45.5% in the presence of target extract (Fig. 4B).
Figure 4.
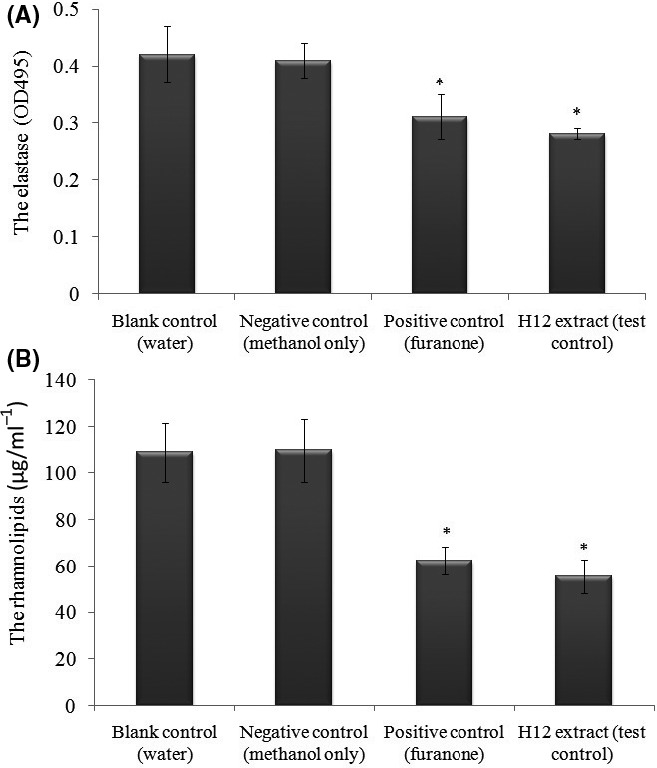
Effect of H12 extract on elastase activity (A) and rhamnolipid product (B) in Pseudomonas aeruginosa PAO1. Error bars indicate the standard deviations of three measurements. *P < 0.05 compared with the negative control group.
Identification of QSI compounds
After separating crude extracts from the pre‐HPLC, two main peaks were collected and re‐detected individually for their QSI activity (Fig. 5A). Fraction peak 2, collected via the C18 cartridge with 60% methanol, showed a bioactivity zone of inhibition; consequently, it was selected for further characterization by ultra‐performance liquid chromatography (UPLC) analysis: the chromatogram showed a single peak at a retention time of 3.54 min (Fig. 5B). A mass spectral peak, detected at positive m/z 458.242 and negative m/z 166.122, was considered to be the corresponding experimental mass of the active fraction (Fig. 5, C&D). Combining the GC‐MS analysis with nuclear magnetic resonance (NMR) (C13 and H1) (Fig. 6, A and B), the calculated (or theoretical) molecular mass of the compound was 500.6. The molecular mass of the active fraction was further confirmed by two‐dimensional heteronuclear multiple quantum correlation (HMQC) and heteronuclear multiple bond correlation (HMBC) (Fig. 6, C and D). The elemental proportions of C, N, H and S were 60.959%, 7.842%, 6.817% and 3.928%, respectively and detected spectra resembled rhodamine isothiocyanate (C29H30N3O3S). The identified target product was tentatively referred to as rhodamine isothiocyanate analogue.
Figure 5.
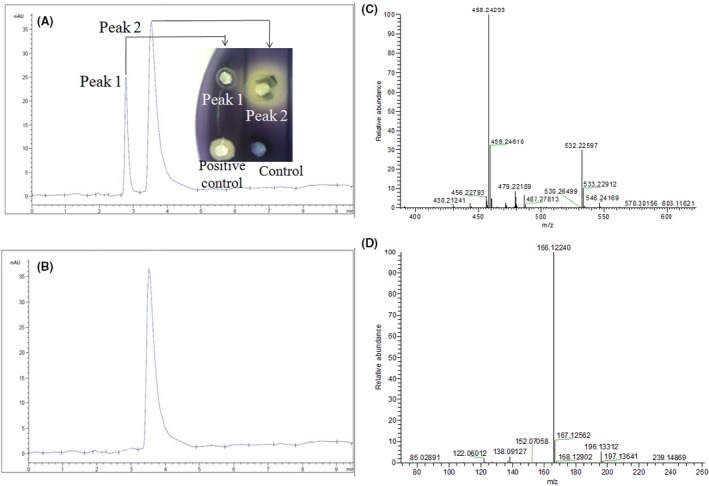
Analysis of bioactive fractions showing quorum‐sensing inhibition. Pre‐HPLC (A) and UPLC (B) analysis of the V. lyticus 12 extract. The chromatogram shows its two main active fractions. The inset image in (A) is the re‐test of QSI activity of the two peak compounds. In the inset image, the “60% methanol + collected extract” and “60% methanol only” represented the positive and negative controls respectively. The GC/MS chromatograms (positive ions) (C) and GC/MS chromatograms (negative ions) (D) of the active fraction (peak 2) of the V. alginolyticus12 extract. Peaks represent a function of intensity measured in milli‐absorption units over time (min).
Figure 6.
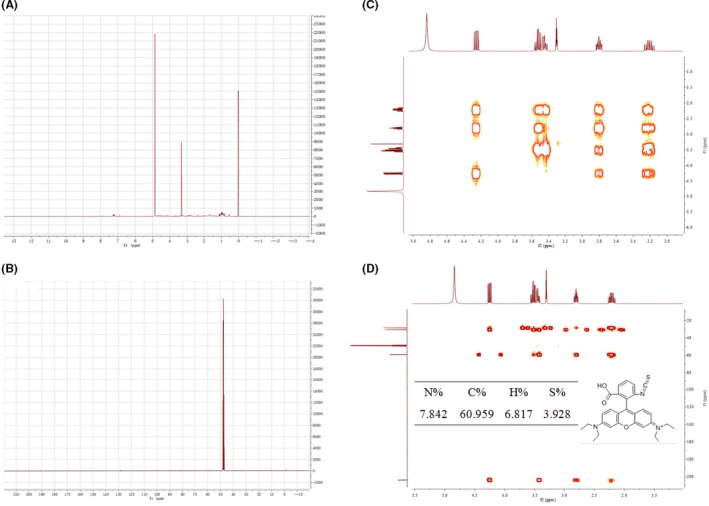
Nuclear magnetic resonance spectroscopy analysis of H12 extract.
A. 1H‐NMR spectrum of compounds in methanol‐d4 at 400 MHz.
B. 13C‐NMR spectrum of compounds in methanol‐d4 at 100 MHz.
C. and (D) show the 2D‐HMQC and 2D‐HMBC chromatograms respectively. The inset picture in (D) shows the elemental composition and possible chemical structure of rhodamine isothiocyanate (re‐drawn using ChemBioDraw Ultra v12.0).
To confirm that the QS inhibitory activity produced by strain V. alginolyticus 12 was elicited by the target compound, rhodamine isothiocyanate standard was purchased from Sigma (Sigma, St. Louis, MO, USA, CAS No. 36877‐69‐7). This commercial product's QSI activity was tested using the same methodology described in Experimental Procedures section (determination of growth and violacein production). As Fig. 7A shows, a concentration‐dependent inhibitory activity was observed, and all of the tested concentrations (1, 5, 10, 50 and 100 μg ml−1) of rhodamine isothiocyanate significantly inhibited the violacein content (range of reduction: 43.7–78.1%).
Figure 7.
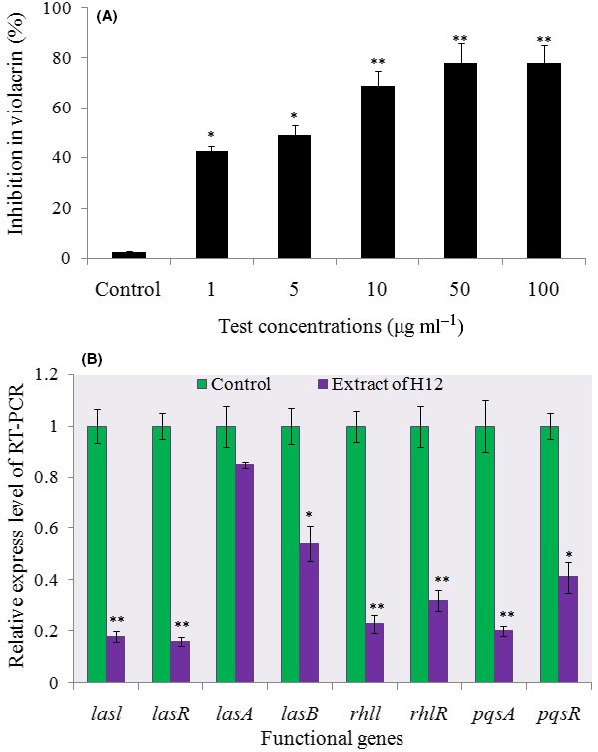
A. The violacein Inhibitory activity analysis. The proportion (%) of violacein inhibition in response to pure rhodamine isothiocyanate applied at six different concentrations (0, 1, 5, 10, 50 and 100 μg ml−1). Data shown are the mean ± SD of three replicates. The * and ** denote statistical differences from the control at the P < 0.05 and P < 0.01 level respectively.
B. Expression profiling of some QSI regulatory genes from P. aeruginosa under V. alginolyticus 12 extract (10 μg ml−1), as measured by qRT‐PCR. The results are based on three independent experiments. The mRNA expression of these genes in the absence of the extract served as a control. Data are presented as means ± SD (n = 3). *P < 0.05 or **P < 0.01 in comparison with the control.
Expression analysis by qRT‐PCR
A near 1.82‐ to 6.23‐fold downregulation of the genes responsible for base‐AHL (acyl‐homoserine lactone) biofilm formation (lasB, lasI, lasR, pqsA and pqsR) was observed in the P. aeruginosa strain (P < 0.05 or P < 0.01) (Fig. 7B). The expression of two virulence‐related genes, rhlI and rhlR, was also significantly reduced, by 75.4% and 68.2% respectively (P < 0.01). The expression of the lasA gene in PAO1 was slight decrease and was not significantly different when compared between experimental and control groups (Fig. 7B).
Discussion
Biofouling is a serious global problem in marine environments, causing extensive material and economic costs worldwide. Early antifouling strategies relied on physical cleaning, or the use of antibacterial compounds, detergents, aldehydes, oxidizing agents or diverse biocides such as tributyltin. All of these compounds, especially when used in large amounts, or in confined environments, pose serious health and environmental problems due to their toxicity or ecotoxicity (Voulvoulis et al., 2002; Yebra et al., 2004; Thomas and Brooks, 2010). The search for QSI compounds has since turned to the ocean and its abundant variety of organisms, many of which are already known to produce useful bioactive compounds, such as halogenated furanones produced by the red alga D. pulchra (Rasmussen et al., 2000), brominated alkaloids from Flustra foliacea (Peters et al., 2003), and kojic acid from E. knighti (Dobretsov et al., 2011). More recently, the culture supernatant from Antarctic marine bacterium P. haloplanktis TAC125 was shown to impair the formation of S. epidermidis biofilm (Papa et al., 2013; Parrilli et al., 2015). These findings demonstrate that QSI compounds are valuable antifouling agents in that they could serve as potential effective additives to environmentally friendly commercial antifouling paints due to their non‐toxicity (Tello et al., 2012).
The biofouling process begins with bacteria that permanently attach themselves and form complex biofilms. Because this bacterial biofilm formation is, in part, controlled by QS, various QSI strategies have been harnessed from marine microorganisms as compounds which could be used to interfere with bacterial QS, and thus represent novel forms of antifouling agents (Qian and Dahms, 2008; Dobretsov et al., 2011). Among the array of marine niches, screening for antifouling compounds from coral symbiotic microbes is of particular interest because of their high biodiversity and rich secondary metabolism (Mohamed et al., 2008; Fusetani, 2011; Karina et al., 2013). In our present study, we found that 15% of coral‐associated bacteria exhibited inhibition activity against C. violaceum 12472. Previous studies reported that approximately 11–24% of the coral‐associated bacteria sampled were capable of QS inhibition activity against E. coli pSB1075, C. violaceum CV026 and A. tumefaciens KYC55 indicator strains (Romero et al., 2011; Karina et al., 2013). Our results are in line with these proportions and further suggest that coral ecosystems represent an ideal reservoir from which to develop QSI products.
Previous studies also suggested that coral‐associated Vibrio spp. can interfere with QS and subsequently inhibit the formation of biofilms (Tait et al., 2010; Alagely et al., 2011). Indeed, in the present study, strain H12 stood out in particular and the presence of 16s rRNA confirmed that this strain belonged to the Vibrio genus (hence, we named this strain V. alginolyticus 12). Using fermentation broth extract from this particular strain, we observed a 37.5% inhibition of the biofilm's biomass at the highest concentration of H12 extract (Fig. 2C). This result indicates that bioactivity exudates were potentially present in the extracellular matrix, and that QSI activity compounds are capable of interfering with the QS system to influence the formation of biofilm in the model G− strain PAO1. Interestingly, V. alginolyticus 12 did not affect the growth of P. aeruginosa (Fig. 2D). Similarly, when the cytotoxic effects of isothiocyanate on the mammalian cell line L929 were investigated, they also showed no cytotoxic effects (Borges et al., 2014). These characteristics suggest that the target compounds are relatively safe antifouling agents, which should promote their broad‐scale development and application as QSI compounds.
HPLC and GC‐MS identified rhodamine isothiocyanate (C29H30N3O3S) analogue as the bioactive fraction (Fig. 6D). When this compound was applied as a treatment, it caused a significant reduction in biofilm density and thickness in the form of a flattened biofilm lacking structural heterogeneity, whereas P. aeruginosa formed a highly structured biofilm in the absence of this compound. Z‐stack images from confocal laser scanning microscopy showed this reduction clearly (Fig. S3). Light microscopy also revealed a considerable effect upon the mean thickness and roughness coefficient in the treatment group (data not shown). To the best of our knowledge, this is the first report of rhodamine isothiocyanate, or its analogue, functioning as an antibiofilm agent from marine Vibrio spp. From the analysis of chemical structure, it is evident that the hexatomic ring appears in several types of AHL signal, such as HHQ and PQS (Grandclement et al., 2016). The inhibition properties of this agent may arise from competitive binding with the transport protein that interrupts the transcription of the AHL signal. Several types of isothiocyanate‐benzylisothiocyanate (BITC), 2‐phenylethylisothiocyanate (PEITC) have been reported to exhibit QSI activity and are also known to affect the QS system, based on the high structural similarity among signal molecules (Borges et al., 2014). This result supported our hypothesis that AHL‐based analogues can operate as QS modulators or antibiofilm agents. Because the QSI activity was confirmed when pure commercial rhodamine isothiocyanate was used, it led us to propose that the QS inhibitory activity produced by strain H12 is driven by rhodamine isothiocyanate or its analogue.
We should highlight that most of the known antibiofilm molecules also exhibit antibacterial activity (bactericidal or bacteriostatic). Some studies have demonstrated that both QSI activity and antimicrobial activity may co‐occur (Busetti et al., 2014). Our results indicated that the absence of violacein was mainly caused by QS disruption (Fig. 2B), especially since the presence of rhodamine isothiocyanate reduced the biofilm biomass without affecting the viability of PAO1 cells living in the biofilm (Fig. S3). This would suggest that the target compound affects adhesive properties of the biofilm without affecting its bacterial viability. This property makes rhodamine isothiocyanate particularly interesting to couple with other conventional antifouling agents in a synergistic framework.
To further understand the QSI and antibiofilm potential of rhodamine isothiocyanate at the molecular level, and to lend support to the outcome of our in vitro results, we followed up with qRT‐PCR analysis. We know that QS genes play a crucial role in the synthesis of EPS, the most critical component of biofilm, and in biofilm maturation. In particular, lasI regulates the expression of several genes involved in the production of the glucose rich EPS‐matrix. In the PAO1 system, lasI and rhlI are involved in autoinducer synthesis, while lasR and rhlR code for transcriptional activators (Sharma et al., 2014). In our study, the expression of lasB, lasI, lasR, rhlI and rhlR was reduced considerably (Fig. 7B), thus indicating that the V. alginolyticus 12 extract is able to inhibit both the las‐ and rhl‐regulatory systems. This also points to a plausible mechanism for its QSI activity, perhaps through an interaction with the las‐ and rhl‐ donor or receptor. Work by Vattem et al. (2007) achieved a similar result to ours with Kigelia africana extracts. In addition to its antibiofilm activity, our extract also inhibited the production of P. aeruginosa AI‐2 factors, such as the pqs genes (Fig. 7B). Our prior work had revealed the inhibition of elastase activity and siderophore production by Rhizobium spp. NAO1 occurs via interference with QS activity, because these virulence factors are under the control of the lasI‐lasR and rhlI‐rhlR systems (Chang et al., 2017). Overall, these studies suggest that the potential target (rhodamine isothiocyanate) exhibits QSI activity against P. aeruginosa PAO 1 via a significant reduction in the QS cascades via downregulated AI‐1 or AI‐2 genes.
The common mechanisms underlying QS interference include the inhibition of signal biosynthesis, enzymatic signal degradation, and disruption of reception signal molecules (Song et al., 2018). Based on our results, we propose a model, shown in Fig. 8, to explain the transcriptional regulation of QSI in P. aeruginosa. It is possible to infer that the QSI effect in the C. violaceum 12472 systems, with rhodamine isothiocyanate or its analogue, may be mediated by interference with the synthesis or activity of AHL molecules. This model indicates that the target compound would disrupt the las and rhl pathways, there by influencing protein activities downstream (such as the function of protease, elastase, pyocyanin and rhamnolipid), eventually reducing the production of biofilm in combination with the pqs pathway. Indeed, we saw a reduction in elastase activity and rhamnolipid production (Fig. 4), thus providing supporting evidence for our model. Therefore, QSI activity can arise from a combination of two mechanisms: interference with the activity of CV12472 to produce AHLs by the LuxR system and modulation of AHL synthesis by the LuxI system. In addition, V. alginolyticus 12 has the potential to reduce the virulence of P. aeruginosa by interfering with the appropriate production of AI‐2 factors (such as pqs genes).
Figure 8.
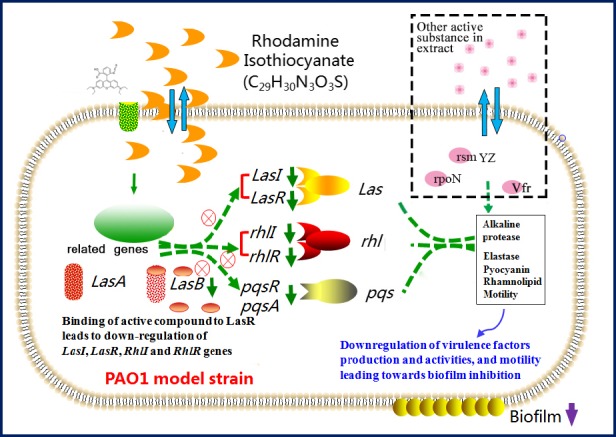
A hypothesized model to explain the possible mechanism (transcriptional regulation) of QSI activity in P. aeruginosa PAO1.
It should be noted that the swimming ability of PAO 1 can be reduced by H12 extract (Fig. 3B), which is similar with Deziel et al. (2001) results. However, Beatson et al. (2002) pointed out that swimming motility in P. aeruginosa was not regulated by QS molecular. Based on this, we speculated that besides QS signals, the target compound (or other activity substance in the extract) probably has a globally role to regulate biofilm formation factors in PAO 1, such as vfr, rpoN, small RNAs (rsmYZ) and cyclic diguanylate monophosphate (c‐di‐GMP) regulator (Yuan et al., 2015) (the dotted circle in Fig. 8). Further studies to confirm this hypothesis would be carried out in the future work.
In summary, this study identified QSI activity by a Vibrio species isolated from coral; the putative compound responsible for this effect was identified as rhodamine isothiocyanate. The analogue molecule(s) of rhodamine isothiocyanate may have disrupted the AI system in P. aeruginosa; confocal microscopy confirmed that the P. aeruginosa biofilm featured a reduced thickness and biomass. Our qRT‐PCR analysis suggested an underlying molecular mechanism that affected functional genes involved in the formation of biofilms and virulence production. Interestingly, the extract did not reduce the growth of P. aeruginosa. These findings may facilitate the discovery of novel antifouling agents with greater efficacy against biofouling. Further studies are now underway in our laboratory to develop a cartridge delivery system.
Experimental procedures
Isolation of coral symbiotic bacteria
Coral samples (P. damicornis) were collected from Xishan Island (3°57.058′E, 36°8.532′S) in the South China Sea. Samples were collected from six sites at a depth of 5–6 m. The salinity was approximately 33.1‰ and the seawater temperature was 29.7°C. At each site, five coral samples were collected. These were washed with sterile seawater, homogenized by grinding and agitation, and serially diluted in sterile seawater. Next, 50 μl dilutions (of 10−4 to 10−7) were surface‐plated onto marine agar 2216 (BD Difco, Franklin Lakes, NJ, USA) and incubated at 30°C for 48–72 h. A quantity of pre‐test colonies, chosen on the basis of their differential colonial morphology, were collected using sterile toothpicks and incubated for 8 h at 30°C in Luria broth (LB: consisting of 10 g l−1 typtone, 5 g l−1 yeast extract, 10 g l−1 NaCl, 1 5 g l−1 agar, sterilized at 121°C).
Bioreporter strains and growth conditions
The C. violaceum ATCC 12472‐reporter strain was used to screen QSI potential bacteria. We chose this strain because it can regulate pigment production via QS signal and is readily inhibited by QS inhibitors. Samples were visually screened for their QS inhibition activity by observing the ensuing violacein production (McLean et al., 2014). Pseudomonas aeruginosa PAO1 is an established model species that was used throughout this study to prepare biofilms. Both strains were cultured in LB medium, either in liquid form or solidified form, using 1.5% agar as needed.
Screening of the QSI potential bacteria
A modified 24‐well plate assay method was carried out with the C. violaceum ATCC 12472 strain to detect any QSI activity. In brief, a 0.22 μm filter film was established following the soft‐agar technique (Teasdale et al., 2009); due to its presence, the test bacteria and reporter strain were separated to avoid physical contact. Small‐molecule compounds, secreted by the test strains, could penetrate the filter film and “sense” the reporter strain. The screened isolates were cultured overnight in LB medium at 30°C in 1.5 ml microcentrifuge tubes with constant shaking at 180 rpm. Then, 100 μl of bacterial suspension was added to 900 μl of soft LB medium and cultured in a 24‐well plate. A 0.22 μm filter film was gently placed on the surface of the media. The upper filter film layer inoculated with C. violaceum ATCC 12472 (OD600 near 0.1) was used to screen the potential QSI strains. The C. violaceum ATCC 12472 bacterial suspension (10 μl) was pipetted onto the filter paper, and bacteria were incubated in quarantined polystyrene (24‐well) plates. In this plate‐based bioassay, we used 2,5‐Dimethyl‐4‐hydroxy‐3[2H]‐furanone (Sigma‐Aldrich, St. Louis, MO, USA, CAS No. 3658‐77‐3) and LB broth to act as positive and negative controls respectively. After incubation for 24 h at 30°C, the inhibition of pigment production on the filter paper was assessed. Positive QSI activity was recorded as visible colourless paper. The bacterial isolates that showed promising positive QSI activities were then selected for further study. To ensure the reliability of this experiment, the QSI activities of the selected isolates were independently tested three times.
Identification of bacterial strains
The potential QSI strains were grown overnight in LB broth at 30°C; then 200 μl from each culture was transferred into a clean 1.5‐ml microcentrifuge tube and centrifuged at 8000 rpm for 1 min. Flow‐through was then discarded, 100 μl of TE buffer was added, and the sample was gently mixed, then boiled for 10 min. The ensuing supernatant contained the DNA crude extract (OD260/OD230 > 1.7; OD260/OD280 between 1.8 and 2.0). The 16S rRNA gene (~1500 bp) was then amplified using the forward primer 27F (5′‐AGAGTTTGATCCTGGCTCAG‐3′) and the reverse primer 1492R (5′‐GGTTACCTTGTTACGACTT‐3′) (Weisburg et al., 1991), and then sequenced at BGI‐Shenzhen (BGI, Shenzhen, Guang dong, China). The sequences obtained were assembled, analysed, and manually edited with a CAP3 software package. The resulting sequences were compared against those from the NCBI database (http://www.ncbi.nlm.nih.gov) in a BLAST analysis.
Determination of growth and violacein production
To rule out the possibility that an antimicrobial effect was responsible for inhibiting purple pigment production, a growth experiment, using different test strains, was conducted. Effects upon growth were determined via the colony‐counting plate method (Choo et al., 2006). The C. violaceum ATCC 12472 was serially diluted and 100 μl of diluted cultures was spread onto LB plates, which were incubated at 30°C for 24 h. Bacterial counts were then compared with the control.
To quantify violacein production, a 1 ml culture was centrifuged at 12000 rpm for 10 min to precipitate any insoluble violacein. The culture's supernatant was then discarded and 1 ml of methanol was added to the pellet. The solution was vortexed vigorously for 30 s to completely solubilize the violacein, then centrifuged at 12000 rpm for 10 min to remove the cells (Choo et al., 2006). Next, 200 μl of the violacein‐containing supernatant was added to 96‐well flat‐bottomed microplates, with three wells used per solution; absorbance was read with a spectrophotometer (Infinite® 200 PRO, Tecan, Groedig, Salzburg, Austria) at a wavelength of 585 nm (Blosser and Gray, 2000).
Inhibiting the biofilm of PAO1
The effect of an QSI positive strain on the biomass of biofilms produced by P. aeruginosa PAO1 was determined using the crystal violet (CV) method (Choo et al., 2006). In brief, fresh cultures of PAO1 were added to 96‐well polystyrene plates (100 μl per well) and incubated in LB medium (Hinsa and O'Toole, 2006), to which bacterial extracts (1, 5 and 10 μg ml−1, w/v) were then added. The mixtures were incubated at 30°C for 48 h. Planktonic cells and the spent medium were then removed from each culture; the remaining adherent cells were gently rinsed twice using deionized water. To each well, a 100 μl CV solution (1%, w/v) was added and left for 30 min at room temperature. The excess dye was discarded, and the plates were washed gently using deionized water. The CV‐stained cells were then solubilized in methanol and their absorbance at 600 nm determined by a microplate reader (Infinite® 200 PRO; Tecan). P. aeruginosa PAO1 cultures incubated without the target strain extract served as negative controls and purified water was used as a blank‐control. Experiments were performed with 12 replicates (12 replicate wells in the 96‐well plates) per treatment. When absorbance was determined, three readings were recorded for each well.
We then examined the biofilm‐reduction effects and biofilm structure under H12 extract treatment. Biofilm dispersion was assessed according to methodology described by Luo et al. (2017). Pre‐sterilized glass microscope slides were used to observe the structure of biofilms under CLSM, as described by Tolker (2014). In brief, cells were grown in LB medium overnight and diluted with fresh medium to an OD600 of approximately 0.02. Then, 4 ml dilutions were incubated with (10 μg ml−1, w/v) or without the QSI extracts in 6‐well plates, with a glass microscope slide in each well, under static conditions. After 24 h, the glass slides were withdrawn and rinsed with deionized water to remove loosely attached cells. The biofilms on one side were stained with 5 μM SYTO9 and 5 μM PI dye (Sigma) in the dark, while those on the other side were simply wiped off. After 15 min, the slides were washed, and observed under CLSM (LSM 710; Zeiss, Jena, Thuringia, Germany) with a 60× objective lens to visualize the biofilms. The 488‐nm excitation and 520‐nm emission filter settings were used to detect SYTO 9, while the 488‐nm excitation and 620‐nm emission filter settings were used for PI. We also quantified biofilm parameters from the CLSM images using COMSAT software (Heydorn et al., 2000). The total biomass, mean thickness, and roughness coefficient of biofilms were also evaluated. To produce 3D transmission‐fluorescence photos of P. aeruginosa PAO1 biofilms, we used FV10‐ASW2.0 Viewer (Olympus, ?Shinjuku, Tokyo, Japan). Optical sections were 5 μm apart on the Z‐axis and images were acquired at 640 × 640 pixels with a 12‐bit intensity resolution. Digital images were processed in Leica Confocal Software Lite (Leica Microsystems, Germany).
Growth curve assay
To determine the effects of an extract upon the growth of P. aeruginosa PAO1, a growth curve assay was conducted following Chang et al. (2017). P. aeruginosa PAO1 was cultured in LB broth with and without the strain H12 extract (10 μg ml−1, w/v). Cultures were incubated at 30°C; every 0, 3, 6, 9, 12, 18, 27, 36 and 48 h, the optical density at 600 nm was determined using a microplate spectrophotometer (Infinite® 200 PRO; Tecan).
Swarming and swimming motility assay
Five millilitres of molten soft top agar (0.3 g agar, 1.0 g tryptone, 0.5 g Yeast extract powder, 0.5 g sodium chloride, 100 ml deionized water) was prepared containing H12 extract at a final concentration of 10 μg ml−1. Then, this agar was poured immediately over the surface of a solidified LB agar plate as an overlay and allowed to dry for 3 h at 30°C. The plates were then centre point inoculated with PAO1 (1 × 10⁷ CFU ml−1) and incubated at 37°C for 24 h. The extent of swarming was then determined by measuring the diameter of the motility swarms (Rashid and Kornberg, 2000).
Pseudomonas aeruginosa PAO1 swimming motility was measured according to Wu et al. (2011). Briefly, diluted P. aeruginosa PAO1 at 1 × 10⁷ CFU ml−1 was point inoculated with a sterile toothpick onto plates containing 0.3% (w/v) soft agar (as mentioned above) in the presence or absence of H12 extract. The plates were then incubated for 24 h at 37°C. The diameter of the migration distance around the incubation site was also measured.
The elastase and rhamnolipid assay
Elastase activity was measured by using previously described methodology, with some modification (Ohman et al., 1980). In brief, 100 ml of culture supernatant was mixed with 900 μl of elastin‐congo red (ECR) buffer (100 mM Tris, 1 mM CaCl2, pH 7.5) containing 20 mg ECR (Sigma Chemical Co., St. Louis, MO, USA). This mixture was then incubated at 37°C for 3 h in a water bath. The samples were then centrifuged (1500 rpm for 10 min at 4°C) to remove insoluble ECR. The absorbance of the supernatant from both control and treated samples was determined by reading OD495. The proportional change (%) in absorbance was then calculated to determine the reduction in elastase activity.
The production of rhamnolipid in P. aeruginosa PAO1 was then assayed as previously described (Boles et al., 2005; O'Toole, 2011). P. aeruginosa biofilms were then assayed in a 96‐well polystyrene microtitre plate. After cell viability was assayed by measuring the OD at 600 nm, extracted rhamnolipid was measured at 420 nm, and biofilm cells attached to the well surface were assayed using crystal violet staining.
Extracting QSI active components
The potential positive strain (H12) was incubated for 48 h in LB broth at 30°C while shaken at 180 rpm. A 1 l bacterial culture was centrifuged for 15 min at 12000 rpm, and its supernatant collected. This cell‐free supernatant was then mixed with the same volume of ethyl acetate (EtOAc) to separate the organic phase. Repeated shaking ensured the soluble fraction was completely separated. Ethyl acetate extract was then dry‐evaporated under vacuum at 45°C in a rotary evaporator. Organic residues were then dissolved in methanol (0.5 ml) for subsequent use. The methanol‐dissolved extract was then filtered through a 0.22‐μm filter film to completely remove any impurities.
The QSI activity of the prepared extracts was then re‐verified using a standard disc diffusion assay (Busetti et al., 2014). In brief, an overnight culture of the reporter strain CV12472 (100 μl) was poured into soft‐layer LB media (5 ml) and then plated and allowed to solidify. The putative extracts – from the H12 strain identified in the preliminary screen – were then pipetted onto filter paper, and the appearance of turbidhalo pigmentless areas of the CV12472 violet colour was designated as positive QSI activity. The positive extracts were stored at −20°C and used in the experiments described below.
Chromatographic analysis of active compounds
Extracted compounds were separated via preparative high performance liquid chromatography (pre‐HPLC) processing. Extract samples (100 μl) were injected into a reverse phase C18 core‐shell column (50 × 2.1 mm, Waters, USA) through an autosampler (ThermoFisher Scientific, Waltham, MA, USA). The mobile phase used 83% methyl alcohol and 17% water at a flow rate of 0.5 ml min−1 at 30°C. The fraction collector gathered the samples, separated by 30s in a series. As the separation process ended, every peak sample was obtained and concentrated in a rotary evaporator. Finally, each purified sample was re‐tested to confirm it exhibited QSI activity (as described earlier).
The collected QSI peaks were further purified on a reversed‐phase UPLC system (Waters Delta Prep 4000; Mckinley Scientific, Sparta, NJ, USA) using a C18 column and a linear water/acetonitrile gradient that contained 0.1% trifluoracetic acid. The purity of the fraction was tested by analytical UPLC (Agilent 1100; Agilent, Santa Clara, CA, USA) with the same gradient. The fraction collected was lyophilized, and the residue dissolved in 1 ml of acetonitrile/water (1:1, v/v) to determine its molecular weight by MS on a LTQ XL Orbitrap using a static nanospray (Thermo‐Fisher, San Jose, CA, USA) in the positive/negative ions mode. To determine the molecular structure of bioactive compounds, a purified and active QSI sample was subjected to NMR spectroscopy to obtain its 2D heteronuclear single quantum coherence and HMBC spectrogram.
Influence upon the expression levels of QS regulatory genes
Pseudomonas aeruginosa PAO1 was grown in 10 ml of LB liquid medium until its OD600 was almost 0.1. At this time, approximately 10 μl of extract (concentration: 10 μg ml−1) of strain H12 was added to the PAO1 culture medium to form the treatment groups. The extract was dissolved in methanol [to a final concentration of 0.1% (v/v) methanol]. The group receiving only 10 μl of methanol acted as the solvent control. After 24–36 h, total RNAs were extracted from the control and treated P. aeruginosa with TRIzol (Takara, Dalian, China) and reverse transcribed into cDNA using the PrimeScript RT reagent kit (Takara), according to the manufacturer's instructions. RNA quality was first checked by measuring A260/A280 and A260/A230 and then assessed by gel electrophoresis, before performing quantitative real‐time PCR. The primers were designed using Primer Express v3.0 (Applied Biosystems, Foster City, CA, USA): 35 cycles were run with denaturation at 95°C for 15 s, annealing at 55°C for 30 s, and extension at 60°C for 45 s. The 16S rRNA gene was used as a control for standardization. Eight reported functional genes coding for QS regulation activity were chosen for these PCR analyses. Their corresponding primers are listed in Table S2. A melt‐curve analysis was performed to validate the specificity of the qRT‐PCR reaction. The relative transcription level of each gene was defined as the ratio of its transcripts obtained in biofilms grown under a given concentration of compounds over those obtained in LB medium with methanol, for which the 2−∆∆Ct method was applied (Livak and Schmittgen, 2001).
Statistical analysis
Differences between means were determined through one‐way analysis of variance (ANOVA), with a P < 0.05 or P < 0.01 significance level. All data analyses were performed in SPSS software v13.0 (IBM Corporation, Armonk, NY, USA).
Conflict of interest
None declared.
Supporting information
Fig. S1. Effects of H12 extract on the dispersion of P. aeruginosa PAO1 biofilms.
Fig. S2. The P. aeruginosa PAO1 Biofilm attachment assay.
Figure S3. Confocal laser scanning microscopy (CLSM) photomicrographs of the PAO1 biofilm architecture, in the presence or absence of the QSI extract.
Table S1. Taxonomical identification and activity record of selected coral symbiotic bacteria.
Table S2. Primers used for the quantitative reverse transcriptase‐PCR amplified genes.
Acknowledgments
This work was supported by the NSFC (41476092, 41741015); Marine Fishery Science and Technology and Industry Development of Guangdong Province (A201603D05), and the S&T Projects of Shenzhen Science and Technology Innovation Committee (JCYJ20170412171959157and JCYJ20170817160708491).
Microbial Biotechnology (2018) 11(6), 1090–1105
Funding Information
No funding information provided.
References
- Alagely, A. , Krediet, C.J. , Ritchie, K.B. , and Teplitski, M. (2011) Signaling‐mediated cross‐talk modulates swarming and biofilm formation in a coral pathogen Serratia marcescens . Multidiscip J Microb Ecol 5: 1609–1620. [DOI] [PMC free article] [PubMed] [Google Scholar]
- Bakkiyaraj, D. , Sivasankar, C. , and Pandian, S.K. (2013) Anti‐pathogenic potential of coral associated bacteria isolated from gulf of mannar against Pseudomonas aeruginosa . Indian J Microb 53: 111–113. [DOI] [PMC free article] [PubMed] [Google Scholar]
- Barraud, N. , Hassett, D.J. , Hwang, S.H. , Rice, S.A. , Kjelleberg, S. , and Webb, J.S. (2006) Involvement of nitric oxide in biofilm dispersal of Pseudomonas aeruginosa . J Bacteriol 188: 7344–7353. [DOI] [PMC free article] [PubMed] [Google Scholar]
- Beatson, S.A. , Whitchurch, C.B. , Semmler, A.B. , and Mattick, J.S. (2002) Quorum sensing is not required for twitching motility in Pseudomonas aeruginosa . J Bacteriol 184: 3598–3604. [DOI] [PMC free article] [PubMed] [Google Scholar]
- Benneche, T. , Chamgordani, E.J. , Herstad, G. , Tannaes, B.S.M. , and Scheie, A.A. (2016) 5‐alkylidenethiophen‐2(5 h)‐ones as biofilm inhibitors. Lett Org Chem 13: 428–436. [Google Scholar]
- Blosser, R.S. , and Gray, K.M. (2000) Extraction of violacein from Chromobacterium violaceum provides a new quantitative bioassay for N‐acyl homoserine lactone autoinducers. J Microbiol Methods 40: 47–55. [DOI] [PubMed] [Google Scholar]
- Boles, B.R. , Toendel, M. , and Singh, P.K. (2005) Rhamnolipids mediate detachment of Pseudomonas aeruginosa from bioflms. Mol Microbiol 57: 1210–1223. [DOI] [PubMed] [Google Scholar]
- Borges, A. , Serra, S. , and Abreu, A.C. (2014) Evaluation of the effects of selected phytochemicals on quorum sensing inhibition and in vitro cytotoxicity. Biofouling 30: 183–195. [DOI] [PubMed] [Google Scholar]
- Braithwaite, R.A. , and McEvoy, L.A. (2005) Marine biofouling on fish farms and its remediation. Adv Mar Biol 46: 215–252. [DOI] [PubMed] [Google Scholar]
- Busetti, A. , Shaw, G. , Megaw, J. , Gorman, S.P. , Maggs, C.A. , and Gilmore, B.F. (2014) Marine‐derived quorum‐sensing inhibitory activities enhance the antibacterial efficacy of tobramycin against Pseudomonas aeruginosa . Mar Drugs 13: 1–28. [DOI] [PMC free article] [PubMed] [Google Scholar]
- Bzdrenga, J. , Daude, D. , Remy, B. , Jacquet, P. , Plener, L. , Elias, M. , et al (2017) Biotechnological applications of quorum quenching enzymes. Chem Biol Interact 267: 104–115. [DOI] [PubMed] [Google Scholar]
- Casillo, A. , Papa R., R. , A., S. , F., Z. , M., T. and M., et.al. (2017) Anti‐biofilm activity of a long‐chain fatty aldehyde from antarctic Pseudoalteromona shaloplanktistac 125 against Staphylococcus epidermidis biofilm. Front Cell Infect Microbiol 7: 00046. [DOI] [PMC free article] [PubMed] [Google Scholar]
- Chang, H. , Zhou, J. , Zhu, X.S. , Yu, S.C. , Chen, L. , Jin, H. and Cai, Z.H. (2017) Strain identification and quorum sensing inhibition characterization of marine‐derived Rhizobium sp. NAO1. R Soc Open Sci 4: 170025. [DOI] [PMC free article] [PubMed] [Google Scholar]
- Choo, J.H. , Rukayadi, Y. , and Hwang, J.K. (2006) Inhibition of bacterial quorum sensing by vanilla extract. Lett Appl Microbiol 42: 637–641. [DOI] [PubMed] [Google Scholar]
- Cushnie, T.P.T. , and Lamb, A.J. (2011) Recent advances in understanding the antibacterial properties of flavonoids. Int J Antimicrob Agents 38: 99–107. [DOI] [PubMed] [Google Scholar]
- Deziel, E. , Comeau, Y. , and Villemur, R. (2001) Initiation of biofilm formation by Pseudomonas aeruginosa 57RP correlates with emergence of hyperpiliated and highly adherent phenotypic variants deficient in swimming, swarming, and twitching motilities. J Bacteriol 183: 1195–1204. [DOI] [PMC free article] [PubMed] [Google Scholar]
- Diana, M.M. , Melisa, L.F. , Carmenza, D. , Freddy, A.R. , and Leonardo, C. (2016) Screening of marine bacterial strains as source of quorum sensing inhibitors (QSI): first chemical study of Oceanobacillus profundus (RKHC‐62B). Vitae 23: 30–47. [Google Scholar]
- Dobretsov, S. (2009) Inhibition and induction of marine biofouling by biofilms In Marine and Industrial Biofouling. Flemming H.C., Murthy P.S., Venkatesan R., and Cooksey K. (eds). Berlin, Heidelberg: Springer, pp. 293–313. [Google Scholar]
- Dobretsov, S. , Teplitski, M. , Bayer, M. , Gunasekera, S. , Proksch, P. , and Paul, V.J. (2011) Inhibition of marine biofouling by bacterial quorum sensing inhibitors. Biofouling 27: 893–905. [DOI] [PMC free article] [PubMed] [Google Scholar]
- Fitridge, I. , Dempster, T. , Guenther, J. , and de Nys, R. (2012) The impact and control of biofouling in marine aquaculture: a review. Biofouling 28: 649–669. [DOI] [PubMed] [Google Scholar]
- Fusetani, N. (2011) Antifouling marine natural products. Nat Prod Rep 28: 400–410. [DOI] [PubMed] [Google Scholar]
- Grandclement, C. , Tannieres, M. , Morera, S. , Dessaux, Y. , and Faure, D. (2016) Quorum quenching: role in nature and applied developments. FEMS Microbiol Rev 40: 86–116. [DOI] [PubMed] [Google Scholar]
- Hentzer, M. , Wu, H. , Andersen, J.B. , Riedel, K. , Rasmussen, T.B. , Bagge, N. , et al (2003) Attenuation of Pseudomonas aeruginosa virulence by quorum sensing inhibitors. EMBO J 22: 3803–3815. [DOI] [PMC free article] [PubMed] [Google Scholar]
- Heydorn, A. , Nielsen, A.T. , Hentzer, M. , Sternberg, C. , Givskov, M. , Ersboll, B.K. , et al (2000) Quantification of biofilm structures by the novel computer program COMSTAT. Microbiol SGM 10: 2395–2407. [DOI] [PubMed] [Google Scholar]
- Hinsa, S.M. , and O'Toole, G.A. (2006) Biofilm formation by Pseudomonas fluorescens WCS365: a role for LapD . Microbiol SGM 152: 1375–1383. [DOI] [PubMed] [Google Scholar]
- Huang, J.H. , Shi, Y.H. , Zeng, J.M. , Gu, Y.L. , Chen, J.Q. , Shi, L.X. , et al (2016) Acyl‐homoserine lactone‐based quorum sensing and quorum quenching hold promise to determine the performance of biological wastewater treatments: an overview. Chemosphere 157: 137–151. [DOI] [PubMed] [Google Scholar]
- Karina, G. , Valentina, P. , Robert, S. , Marks, R.S. , and Kushmaro, A. (2013) Coral‐associated bacteria, quorum sensing disrupters, and the regulation of biofouling. Biofouling 29: 669–682. [DOI] [PubMed] [Google Scholar]
- Labbate, M. , Queek, S.Y. , Koh, K.S. , Rice, S.A. , Givskov, M. , and Kjelleberg, S. (2004) Quorum sensing‐controlled biofilm development in Serratia liquefaciens MG1. J Bacteriol 186: 692–698. [DOI] [PMC free article] [PubMed] [Google Scholar]
- Livak, K.J. , and Schmittgen, T.D. (2001) Analysis of relative gene expression data using real‐time quantitative PCR and the 2(‐Delta Delta C (T)) method. Methods 25: 402–408. [DOI] [PubMed] [Google Scholar]
- Luo, J. , Dong, B. , Wang, K. , Cai, S. , Liu, T. , Cheng, X. , et al (2017) Baicalin inhibits biofilm formation, attenuates the quorum sensing‐controlled virulence and enhances Pseudomonas aeruginosa clearance in a mouse peritoneal implant infection model. PLoS ONE 12: e0176883. [DOI] [PMC free article] [PubMed] [Google Scholar]
- Mangwani, N. , Kumari, S. , and Das, S. (2015) Involvement of quorum sensing genes in biofilm development and degradation of polycyclic aromatic hydrocarbons by a marine bacterium P. aeruginosa N6P6. Appl Microbiol Biotechnol 99: 10283–10297. [DOI] [PubMed] [Google Scholar]
- McLean, R.J.C. , Pierson, L.S. , and Fuqua, C.A. (2014) Simple screening protocol for the identification of quorum signal antagonists. J Microbiol Methods 58: 351–360. [DOI] [PubMed] [Google Scholar]
- Mohamed, N.M. , Cicirelli, E.M. , Kan, J.J. , Chen, F. , Fuqua, C. , and Hill, R.T. (2008) Diversity and quorum‐sensing signal production of Proteobacteria associated with marine sponges. Environ Microbiol 10: 75–86. [DOI] [PubMed] [Google Scholar]
- Ohman, D.E. , Cryz, S.J. , and Iglewski, B.H. (1980) Isolation and characterization of a Pseudomonas aeruginosa PAO mutant that produce saltered elastase. J Bacteriol 142: 836–842. [DOI] [PMC free article] [PubMed] [Google Scholar]
- O'Toole, G.A. (2011) Microtiter dish bioflm formation assay. J Vis Exp 47: e2437. [DOI] [PMC free article] [PubMed] [Google Scholar]
- Papa, R. , Parrilli, E. , Sannino, F. , Barbato, G. , Tutino, M.L. , Artini, M. , et al (2013) Anti‐biofilm activity of the Antarctic marine bacterium Pseudoalteromonas haloplanktis TAC125. Res Microbiol 164: 450–456. [DOI] [PubMed] [Google Scholar]
- Parrilli, E. , Papa, R. , Carillo, S. , Tilotta, M. , Casillo, A. , Sannino, F. , et al (2015) Anti‐biofilm activity of P. haloplanktistac125 against S. epidermidis biofilm: evidence of a signal molecule involvement? Int J Immunopathol Pharmacol 28: 104–113. [DOI] [PubMed] [Google Scholar]
- Peters, L. , Konig, G.M. , Wright, A.D. , Pukall, R. , Stackebrandt, E. , Eberl, L. , et al (2003) Secondary metabolites of Flustrafoliacea and their influence on bacteria. Appl Environ Microbiol 69: 3469–3475. [DOI] [PMC free article] [PubMed] [Google Scholar]
- Qian, P.Y. and Dahms, H.U. (2008). A triangle model: Environmental changes affect biofilms that affect larval settlement In Springer Series on Biofilms. Berlin, Heidelberg: Springer, pp. 315–328. [Google Scholar]
- Rashid, M.H. , and Kornberg, A. (2000) Inorganic polyphosphate is needed for swimming, swarming, and twitching motilities of Pseudomonas aeruginosa . Proc Natl Acad Sci USA 97: 4885–4890. [DOI] [PMC free article] [PubMed] [Google Scholar]
- Rasmussen, T.B. , Manefield, M. , Andersen, J.B. , Eberl, L. , Steinberg, P. , Kjelleberg, S. , et al (2000) How Deliseapulchra furanones affect quorum sensing and swarming motility in Serratia liquefaciens MG1. Microbiol UK 146: 3237–3244. [DOI] [PubMed] [Google Scholar]
- Romero, M. , Martin‐Cuadrado, A.B. , Roca‐Rivada, A. , and Cabello, A.M. (2011) Quorum quenching in cultivable bacteria from dense marine coastal microbial communities. FEMS Microbiol Ecol 75: 205–217. [DOI] [PubMed] [Google Scholar]
- Schultz, M.P. , Bendick, J.A. , Holm, E.R. , and Hertel, W.M. (2011) Economic impact of biofouling on a naval surface ship. Biofouling 27: 87–98. [DOI] [PubMed] [Google Scholar]
- Sharma, I.M. , Petchiappan, A. , and Chatterji, D. (2014) Quorum sensing and biofilm formation in mycobacteria: role of c‐di‐GMP and methods to study this second messenger. IUBMB Life 66: 823–834. [DOI] [PubMed] [Google Scholar]
- Skindersoe, M.E. , Ettinger‐Epstein, P. , Rasmussen, T.B. , Bjarnsholt, T. , de Nys, R. , and Givskov, M. (2008) Quorum sensing antagonism from marine organisms. Mar Biotechnol 10: 56–63. [DOI] [PubMed] [Google Scholar]
- Song, Y. , Cai, Z.H. , and Zhou, J. (2018) Advances in microbial quorum sensing inhibitors and their application in marine ecological field. Acta Microbiol Sin 58: 10–18. [Google Scholar]
- Tait, K. , Hutchison, Z. , Thompson, F.L. , and Munn, C.B. (2010) Quorum sensing signal production and inhibition by coral‐associated Vibrios . Environ Microbiol Rep 2: 145–150. [DOI] [PubMed] [Google Scholar]
- Teasdale, M.E. , Liu, J.Y. , Wallace, J. , Akhlaghi, F. , and Rowley, D.C. (2009) Secondary metabolites produced by the marine bacterium H. salinus that inhibit QS controlled phenotypes in gram‐negative bacteria. Appl Environ Microbiol 75: 567–572. [DOI] [PMC free article] [PubMed] [Google Scholar]
- Tello, E. , Castellanos, L. , Arevalo‐Ferro, C. , and Duque, C. (2012) Disruption in quorum‐sensing systems and bacterial biofilm inhibition by cembranoid diterpenes isolated from the octocoral Eunicea knighti . J Nat Prod 75: 1637–1642. [DOI] [PubMed] [Google Scholar]
- Thomann, A. , Brengel, C. , Borger, C. , Kail, D. , Steinbach, A. , Empting, M. , et al (2016) Structure‐activity relationships of 2‐sufonylpyrimidines as quorum‐sensing inhibitors to tackle biofilm formation and eDNA release of Pseudomonas aeruginosa . Chem Med Chem 11: 2522–2533. [DOI] [PubMed] [Google Scholar]
- Thomas, K.V. , and Brooks, S. (2010) The environmental fate and effects of antifouling paint biocides. Biofouling 26: 73–88. [DOI] [PubMed] [Google Scholar]
- Tolker, N.T. (2014) P. aeruginosa biofilm infections: from molecular biofilm biology to new treatment possibilities. Acta Pathol Microbiol Immunol Scand 138: 1–51. [DOI] [PubMed] [Google Scholar]
- Vattem, D.A. , Mihalik, K. , Crixell, S.H. , and McLean, R.J.C. (2007) Dietary phytochemicals as quorum sensing inhibitors. Fitoterapia 78: 302–310. [DOI] [PubMed] [Google Scholar]
- Voulvoulis, N. , Scrimshaw, M.D. , and Lester, J.N. (2002) Comparative environmental assessment ofbiocides used in antifouling paints. Chemosphere 47: 789–795. [DOI] [PubMed] [Google Scholar]
- Weisburg, W.G. , Barns, S.M. , Pelletier, D.A. , and Lane, D.J. (1991) 16S Ribosomal DNA amplification for phylogenetic study. J Bacteriol 173: 697–703. [DOI] [PMC free article] [PubMed] [Google Scholar]
- Wu, H. , Lee, B. , Yang, L. , Wang, H. , Givskov, M. , Molin, S. , et al (2011) Effects of ginseng on Pseudomonas aeruginosa motility and biofilm formation. FEMS Immunol Med Microbiol 62: 49–56. [DOI] [PubMed] [Google Scholar]
- Yebra, D.M. , Kiil, S. , and Dam‐Johansen, K. (2004) Antifouling technology‐past, present and future steps towards efficient and environmentally friendly antifouling coatings. Prog Org Coat 50: 75–104. [Google Scholar]
- Yuan, X. , Khokhani, D. , Wu, X. , Yang, F. , Biener, G. , Koestler, B.J. , et al (2015) Cross‐talk between a regulatory small RNA, cyclic‐di‐GMP signalling and flagellar regulator FlhDC for virulence and bacterial behaviours. Environ Microbiol 17: 4745–4763. [DOI] [PMC free article] [PubMed] [Google Scholar]
Associated Data
This section collects any data citations, data availability statements, or supplementary materials included in this article.
Supplementary Materials
Fig. S1. Effects of H12 extract on the dispersion of P. aeruginosa PAO1 biofilms.
Fig. S2. The P. aeruginosa PAO1 Biofilm attachment assay.
Figure S3. Confocal laser scanning microscopy (CLSM) photomicrographs of the PAO1 biofilm architecture, in the presence or absence of the QSI extract.
Table S1. Taxonomical identification and activity record of selected coral symbiotic bacteria.
Table S2. Primers used for the quantitative reverse transcriptase‐PCR amplified genes.