

Abstract
While A1C is well established as an important risk marker for diabetes complications, with the increasing use of continuous glucose monitoring (CGM) to help facilitate safe and effective diabetes management, it is important to understand how CGM metrics, such as mean glucose, and A1C correlate. Estimated A1C (eA1C) is a measure converting the mean glucose from CGM or self-monitored blood glucose readings, using a formula derived from glucose readings from a population of individuals, into an estimate of a simultaneously measured laboratory A1C. Many patients and clinicians find the eA1C to be a helpful educational tool, but others are often confused or even frustrated if the eA1C and laboratory-measured A1C do not agree. In the U.S., the Food and Drug Administration determined that the nomenclature of eA1C needed to change. This led the authors to work toward a multipart solution to facilitate the retention of such a metric, which includes renaming the eA1C the glucose management indicator (GMI) and generating a new formula for converting CGM-derived mean glucose to GMI based on recent clinical trials using the most accurate CGM systems available. The final aspect of ensuring a smooth transition from the old eA1C to the new GMI is providing new CGM analyses and explanations to further understand how to interpret GMI and use it most effectively in clinical practice. This Perspective will address why a new name for eA1C was needed, why GMI was selected as the new name, how GMI is calculated, and how to understand and explain GMI if one chooses to use GMI as a tool in diabetes education or management.
Introduction
A1C is an important measure of diabetes population health and of the risk for long-term diabetes complications. However, this long-term average glucose metric, used alone, may be insufficient to optimally guide a personalized therapy change, particularly in patients using insulin, since it cannot reveal extent or timing of hypoglycemia or the presence of clinically important glucose variability or hyperglycemia patterns. A1C also does not capture the daily nuances of insulin-dosing decisions and glycemic excursions.
Continuous glucose monitoring (CGM) is a powerful tool with the potential to transform the management of individuals with type 1 diabetes (T1D) or type 2 diabetes (T2D). In real time, CGM can show trends in hypoglycemia, hyperglycemia, and glucose variability, some of which warrant immediate therapeutic action. Retrospective analysis of CGM data quantifies the time in target range and the time in clinically significant hypoglycemia and hyperglycemia, as well as revealing patterns of hypoglycemia, hyperglycemia, and glucose variability. In short, CGM helps individuals with diabetes and clinicians optimize diabetes management strategies.
A recent study using modern CGM technology concluded that 10–14 days of CGM data provide a good estimate of CGM metrics for a 3-month period (1). Ten days of CGM data is usually sufficient for an estimate of average glucose, time in target range, and time in hyperglycemia, while 14 days or more of CGM data provides a better estimate for time in hypoglycemia and of glucose variability. Thus, CGM data for at least 10–14 days provides sufficient data to generate a representative CGM-derived mean glucose value for a given individual. From this mean glucose, and using a standard formula, a value some have called an “estimated A1C” (eA1C) can be generated, intended to approximate the value of a simultaneously measured laboratory A1C. Many clinicians and patients find the eA1C useful in clinical management of diabetes. An international consensus group recently included the eA1C in its list of core CGM metrics recommended for inclusion in all standard CGM reports (2).
While many find the eA1C useful, clinicians and patients often are understandably confused or frustrated when the CGM-derived eA1C and laboratory-measured A1C do not closely match. In addition, there is some concern that the term eA1C implies a more direct relationship with the measured A1C than is actually the case. In light of such concerns, members of the Center for Devices and Radiological Health (CDRH), a division of the U.S. Food and Drug Administration (FDA) that regulates medical devices, including CGM systems, contacted the clinical community to discuss ways to address this issue.
Very constructive dialogue with CDRH has led the authors to a solution that would address the FDA concerns. The CGM-derived mean glucose would be entered into a standardized formula as before (although there is a slight modification of the current eA1C formula; see below) to generate a value similar to the previous eA1C value (and expressed in the same units [%]), but the name of the metric will be changed. A new term could replace eA1C on a CGM report if that new name conveyed a metric that helps to inform or guide diabetes management and did not imply a precise match with a contemporaneous laboratory A1C. After feedback from the authors, the FDA, many diabetes health care professionals, individuals with diabetes, diabetes advocacy groups, laboratory experts, and CGM device manufacturers, the new name agreed upon to replace “estimated A1C” is “glucose management indicator” (GMI).
Below we discuss in more detail why a change in the name eA1C is needed and why GMI was selected. In addition, we outline how GMI is calculated and interpreted and how it could serve in practice as one CGM-based indicator of the current status of diabetes management.
Why Is a Change in the Name eA1C Needed?
Many CGM data reports include an estimate of A1C based on the CGM-measured mean glucose concentration. For some patients, the eA1C closely approximates a laboratory-measured A1C, but for others it might be higher or lower than the actual A1C. As was shown in a recent article by Beck et al. (3), a laboratory-measured A1C of 8.0% could be associated with a CGM-measured mean glucose concentration as low as 155 mg/dL (for which the estimate of A1C from mean glucose would be 7.0%) or as high as 218 mg/dL (for which the estimate of A1C from mean glucose would be 8.5%). This discordance between the eA1C and the measured A1C can be confusing for patients and clinicians. After our discussion with FDA’s CDRH, endocrinologists, diabetes educators, and patient advocates, we concluded that coining a name other than “estimated A1C” would reduce confusion.
Why Was the Term GMI Selected?
The term selected to replace eA1C must overcome the perceived barriers to the name eA1C yet convey that an estimate of A1C from mean glucose remains a helpful metric that can be used to enhance diabetes management.
It was suggested that the new term not include either “estimated” or “A1C” to avoid a misinterpretation that the value of this metric should always closely match a corresponding laboratory-measured A1C. In addition, the word “index” was avoided because when paired with the word glucose or glycemic, which were words likely to be in the new term, this phrase could easily be confused with the already established concept of glycemic index.
The term GMI is intended to convey that this is a measure derived from glucose values and can provide an indication of the current state of a person’s glucose management. “Glucose control indicator” or “glucose management indicator” emerged as the leading candidates to replace eA1C. These two terms and others were released for comment to several hundred health care professionals from over 80 clinics caring for people with diabetes across the U.S. (4), to individuals with diabetes and patient advocacy organizations, and to manufacturers of glucose monitoring systems that previously included eA1C in their glucose reports. While both terms, glucose control indicator and glucose management indicator, satisfied many of the desired characteristics of the new term, feedback strongly supported the word “management” instead of “control.” Multiple physicians, researchers, diabetes educators, and individuals with diabetes quoted articles from Dickinson et al., including “The Use of Language in Diabetes Care and Education” (5), in support of their preference for the word “management.” This article states that sometimes words are chosen related to diabetes that can be perceived as negative, stigmatizing, or judgmental instead of empowering. A prime example used by Dickinson et al. (5) is using the word control in the context of diabetes being “poorly controlled,” “uncontrolled,” or “out of control,” which may be perceived as judgmental or not being good enough. Dickinson et al. propose diabetes management or glucose management as more positive and empowering language than diabetes control or glucose control. With this diverse and thoughtful feedback, we accepted the term “glucose management indicator.”
How Is GMI Calculated?
GMI is calculated from a formula derived from the regression line computed from a plot of mean glucose concentration points on the x-axis and contemporaneously measured A1C values on the y-axis. The concept of estimating mean glucose from a measured A1C was popularized by the A1c-Derived Average Glucose (ADAG) study conducted in 2006–2007, which consisted of a data set with a median of 13 days of CGM measurements plus 39 days of fingerstick blood glucose measurements (6). More recently, Beck et al. (3) published an equation (3.38 + 0.02345 × [mean glucose in mg/dL]) to estimate A1C from CGM-measured mean glucose concentration using modern CGM technology (Dexcom G4 Platinum CGM System with software 505; Dexcom, Inc., San Diego, CA) and using up to 91 days of CGM data (median 66 days) from 387 individuals with diabetes, combining data from three clinical trials (315 with T1D and 72 with T2D) (7–9).
To validate this formula, CGM data from the HypoDE study (10) (141 individuals with T1D for whom 4 weeks of data were collected with the Dexcom G5 sensor prior to A1C measurement) were analyzed to compute the regression equation to estimate A1C from the CGM-measured mean glucose concentration. The calculated equation from the HypoDE data (3.15 + 0.02505 × [mean glucose in mg/dL]) is quite similar to the aforementioned equation, in essence validating the publication by Beck et al. (3).
Since the two equations are nearly identical, the data set from the HypoDE study was combined with that of the prior study (mean amount of CGM data prior to A1C measurement was 48 full-day equivalents, range 13–89 days) to compute a pooled equation with greater precision:
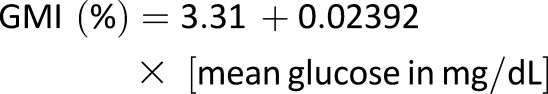 |
This is shown in Fig. 1 and Table 1. In general, each 25 mg/dL increase in mean glucose corresponds to a GMI increase of 0.6%, e.g., a mean glucose of 150 mg/dL corresponds to a GMI of 6.9%, with 175 mg/dL corresponding to 7.5% and 200 mg/dL corresponding to 8.1%.
Figure 1.

Plot of CGM-measured mean glucose concentration vs. central laboratory–measured A1C used to compute the formula to estimate GMI, combining data from four randomized trials using the Dexcom G4 sensor with 505 software (N = 528) described in the Supplementary Data. The shaded area represents the 95% CI of the regression line. The regression equation to compute GMI (%) = 3.31 + 0.02392 × [mean glucose in mg/dL] or GMI (mmol/mol) = 12.71 + 4.70587 × [mean glucose in mmol/L]. A calculator to compute GMI is available at www.jaeb.org/gmi and www.AGPreport.org/agp/links.
Table 1.
GMI calculated for various CGM-derived mean glucose concentrations
| CGM-derived mean glucose (mg/dL) | GMI (%)* |
|---|---|
| 100 | 5.7 |
| 125 | 6.3 |
| 150 | 6.9 |
| 175 | 7.5 |
| 200 | 8.1 |
| 225 | 8.7 |
| 250 | 9.3 |
| 275 | 9.9 |
| 300 | 10.5 |
| 350 |
11.7 |
| CGM-measured mean glucose (mmol/L) |
GMI (mmol/mol)† |
| 5 | 36.2 |
| 6 | 40.9 |
| 7 | 45.7 |
| 8 | 50.4 |
| 9 | 55.1 |
| 10 | 59.8 |
| 12 | 69.2 |
| 14 | 78.6 |
| 16 | 88.0 |
| 18 | 97.4 |
*GMI (%) = 3.31 + 0.02392 × [mean glucose in mg/dL].
†GMI (mmol/mol) = 12.71 + 4.70587 × [mean glucose in mmol/L]. A calculator to compute GMI is available at www.jaeb.org/gmi and www.AGPreport.org/agp/links.
The comparable formula using mean glucose expressed as mmol/L and using the International Federation of Clinical Chemistry (IFCC) standard units for A1C is GMI (mmol/mol) = 12.71 + 4.70587 × [mean glucose in mmol/L]. We propose that these formulas be used to compute the GMI from CGM-derived mean glucose (again with the suggestion that at least 10 and preferably 14 or more days of CGM data be used). A calculator to compute GMI is available at www.jaeb.org/gmi and www.AGPreport.org/agp/links. The studies used to generate the GMI equation are summarized in the Supplementary Data. Since all four studies used a Dexcom sensor, we cannot be certain that the formula would be precisely the same for CGM data collected from a different sensor. However, it can be expected that the formula would be similar irrespective of sensor accuracy, assuming that the sensor measurements are not directionally biased.
How Can GMI Be Explained to Individuals With Diabetes and Be Used to Help Inform Glucose Management Targets?
Table 2 provides keys points to help a clinician explain to an individual with diabetes how to interpret a GMI value.
Table 2.
Explaining GMI to individuals with diabetes
| GMI tells you what your approximate A1C level is likely to be, based on the average glucose level from your CGM readings for 14 or more days. | |
| |
| Here is what having a difference in laboratory-measured A1C and GMI may mean: | |
| Laboratory A1C vs. GMI | |
| 8.0% vs. 7.8% | A1C measured from a blood test that is similar to your GMI means that your average CGM glucose level is about what would be predicted from the measured A1C. (Based on the average of values from many other people.) |
| 8.0% vs. 7.2% | A1C measured from a blood test that is higher than your GMI means that your average CGM glucose level is lower than would be predicted from the measured A1C. (Based on the average of values from many other people.) |
| 7.2% vs. 8.0% | A1C measured from a blood test that is lower than your GMI means that your average CGM glucose level is higher than would be predicted from the measured A1C. (Based on the average of values from many other people.) |
A difference between your laboratory measured A1C and your GMI level, while not unexpected, may be important to consider in your diabetes management. Please discuss with your health care team.
There will be clinical scenarios when it is expected that the GMI and laboratory A1C will not agree. For instance, during short periods of acute hyperglycemia (illness, steroid administration, diabetic ketoacidosis), the average glucose and thus the GMI will be higher than a laboratory A1C measured at the same time, as the laboratory value reflects glucose levels primarily over the last 2–3 months. The opposite also can occur, where the GMI is lower than the laboratory A1C if there are short periods of much lower-than-usual glucose readings (starting a new carbohydrate-reduced diet, an intensive exercise regimen, or during the first few weeks after starting a new effective glucose-lowering medication).
Despite these considerations, most of the time when there are no acute or dramatic changes from an individual’s usual glucose levels, the difference between GMI and A1C can help inform diabetes management and help clinicians and patients set personalized/individualized A1C goals. If a person has a GMI always considerably lower than expected from a measured A1C, one has to be careful not to set the therapeutic goal based on the laboratory A1C target too low. For example:
If the target A1C is 7.0% but the GMI is always lower (say 6.6%), it would be advisable to ensure that the time spent in hypoglycemia is not excessive. (A benchmark for how well we can do today in minimizing hypoglycemia while maximizing time in target range comes from the MiniMed 670G hybrid closed loop pivotal trial, in which 3% of CGM values were <70 mg/dL and 1% were <54 mg/dL while 72% of glucose values were in the target range of 70–180 mg/dL.) Setting a slightly higher A1C target (such as 7.3%) or suggesting the use of CGM or more frequent self-monitored blood glucose testing may be advisable to minimize the risk of hypoglycemia.
If a person has a GMI always considerably higher than expected from a measured A1C, one has to be careful not to set the laboratory A1C target too high. For example:
If the target A1C is 7.5% and the GMI is always higher (say 7.9%), it might be safe to set the A1C target slightly lower, such as at 7.2%, in order to minimize excessive hyperglycemia.
Table 3 shows the degree to which the GMI (calculated from CGM-derived mean glucose) and the A1C (laboratory measured) agree, based on 528 individuals with diabetes having both values measured concurrently. Note that 19% of the time the GMI and laboratory A1C have an identical value, while 51% of the time they differ by 0.3% (A1C points) or more and 28% of the time they differ by 0.5% (A1C points) or more. This fairly frequent, clinically significant mismatch in GMI and laboratory A1C values reinforces the importance of understanding how the difference between GMI and laboratory A1C can be used to refine and personalize each individual’s glucose management plan.
Table 3.
Difference between GMI (calculated from CGM-derived mean glucose) and laboratory-measured A1C (N = 528)
| Absolute value of difference between GMI and laboratory A1C (%) | Percentage of values (%) | 95% CI (%) |
|---|---|---|
| 0 to <0.1 | 19 | 16–22 |
| ≥0.1 | 81 | 78–84 |
| ≥0.2 | 67 | 63–71 |
| ≥0.3 | 51 | 47–55 |
| ≥0.4 | 39 | 34–43 |
| ≥0.5 | 28 | 24–32 |
| ≥0.6 | 19 | 15–22 |
| ≥0.7 | 12 | 9–15 |
| ≥0.8 | 8 | 5–10 |
| ≥0.9 | 4 | 3–6 |
| ≥1.0 | 3 | 2–4 |
The literature available to date (11) indicates that the difference in laboratory A1C and GMI remains relatively stable for each individual over time. If an individual has a lower GMI than expected from the measured A1C (lower average glucose than expected), then the GMI will usually continue to be lower than the laboratory A1C on repeated comparisons over time. Such an individual likely has a longer red blood cell (RBC) life span (slower RBC turnover rate) than average, a higher RBC glycation rate than average, or a variation in another, as yet undefined biologic or genetic factor.
Why Is It Important to Use Both the A1C and CGM (Metrics and Profiles) in Diabetes Management?
Since laboratory-measured A1C and CGM-derived glucose data may be used in different ways to inform a glucose management plan, it is wise to discuss with patients both a laboratory A1C target and the goals for glucose management based on CGM metrics and profiles.
The A1C target for a person with diabetes should be individualized or modified based on patient characteristics (age, life expectancy, awareness of hypoglycemia, severity of complications, pregnancy), the level of engagement in diabetes self-management (educational and psychosocial circumstances), and glucose monitoring data including the GMI. Formulating an individualized A1C target is only one component of an effective glucose management plan. Having real-time CGM glucose data and retrospective glucose patterns available provides additional information to help guide appropriate medication or lifestyle selection and adjustment (12–14).
Using CGM can help guide diabetes management in real time with minute-to-minute glucose values and trend arrows as well as retrospectively with an analysis of glucose metrics and patterns. The core glucose metrics to help clinicians evaluate the effectiveness of the current diabetes management plan include average glucose, GMI, time in range (time in target range 70–180 mg/dL), time in hypoglycemia (<70 and <54 mg/dL), time in hyperglycemia (>180 and >250 mg/dL), and a measure of glucose variability (coefficient of variation, which is SD divided by mean glucose). While average glucose, GMI, time in hyperglycemia, and time in target range all give a similar perspective on overall glucose management to the A1C (all being mostly influenced by the degree of hyperglycemia present), the additional metrics of time in hypoglycemia and glycemic variability add critical information beyond the A1C value to assess whether there are added safety concerns that need to be addressed in the diabetes management plan.
For example, someone who has an A1C of 6.8% and who spends 10% of the day in hypoglycemia would benefit from a care plan different than someone who has an A1C of 6.8% and who spends 1% of the day in hypoglycemia.
GMI can also give patients and providers perspective on how an overall laboratory A1C is trending, but in a shorter time window. For instance, if a new therapy is added and GMI moves from 8.5 to 7.8% in 2–4 weeks—and there is no meaningful increase in hypoglycemia—it is probably working.
Understanding and using the CGM-generated glucose profiles and patterns are critical to managing diabetes and titrating therapy. Now that CGM profile visualization is moving toward a standard ambulatory glucose profile (2,15), it is becoming easier to establish a consistent dialogue with patients on how to spot exactly what time of day and on which days there are patterns of hypoglycemia or hyperglycemia that need attention in order to safely work toward spending more and more time in the target range.
Conclusions
CGM is being used more frequently in patients with T1D and in some patients with T2D, particularly those using insulin, and in pregnancy. It is also an essential component of automated insulin delivery devices (hybrid closed loop or artificial pancreas) (16). This uptake in use reflects the fact that many CGM devices are now smaller, more accurate, factory calibrated (no finger sticks), increasingly affordable for those with coverage, and garnering better reimbursement.
While A1C is currently the primary measure guiding glucose management and a valuable marker of the risk of developing diabetes complications, we believe that the GMI along with the other CGM metrics provide for a much more personalized diabetes management plan.
As the use of CGM increases and if the evidence builds connecting CGM metrics with the risk of diabetes complications, the day may come when CGM is routinely used in conjunction with A1C or in some cases in place of A1C as the major glucose management tool, with CGM metrics becoming key indicators of quality diabetes care. Until then, changing the name from eA1C to GMI provides a useful measure for connecting CGM metrics to laboratory A1C and reinforces the need for ongoing diabetes management and patient and health care professional engagement. It is the hope of the authors that the term GMI and its calculation will be adopted by the global diabetes community.
Supplementary Material
Article Information
Acknowledgments. The authors thank the several hundred clinicians from the T1D Exchange clinic registry and the many individuals with diabetes across the U.S. who were surveyed regarding the most appropriate name for the metric to replace eA1C. Special thanks to Amy Criego and Janet Davidson from the International Diabetes Center who consistently reinforced the value of using the word management in place of control.
Funding and Duality of Interest. R.M.B. has received research support from, consulted for, or has been on a scientific advisory board for Abbott Diabetes Care, Dexcom, Eli Lilly, Johnson & Johnson, Medtronic, Novo Nordisk, Onduo, Roche, Sanofi, and United HealthCare. His research is partly funded by the National Institute of Diabetes and Digestive and Kidney Diseases (National Institutes of Health grant DK108611). R.M.B.’s employer, the nonprofit HealthPartners Institute, contracts for his services and no personal income goes to R.M.B. R.W.B.’s nonprofit employer has received research funding from Dexcom, Bigfoot Biomedical, and Tandem Diabetes Care; study supplies from Roche, Ascencia, Dexcom, and Abbott Diabetes Care; and consulting fees from Insulet, Bigfoot Biomedical, and Eli Lilly. K.L.C. and A.S.B. report the following disclosures: The diaTribe Foundation receives donations from a number of manufacturers and academic institutions in the diabetes field; in addition, several academic institutions, government bodies, and manufacturers in the diabetes field subscribe to Close Concerns’ fee-based newsletter, Closer Look. G.G. has received research support from Novo Nordisk and Medtronic and serves on a speakers’ bureau for Novo Nordisk, Sanofi, Eli Lilly, Boehringer Ingelheim, and AstraZeneca. L.H. is a shareholder of Profil Institut für Stoffwechselforschung GmbH, Neuss, Germany, and ProSciento, San Diego, CA, and is a consultant for a number of companies developing novel diagnostic and therapeutic options for diabetes treatment. G.A. has received research support from, consulted for, or has been on a scientific advisory board for AstraZeneca, Dexcom, and Novo Nordisk. D.B.R. has consulted for Boston Consulting Group and is president of the American Association of Diabetes Educators. No other potential conflicts of interest relevant to this article were reported.
There was no editorial assistance in the writing of the manuscript and no external funding for analysis, writing, or interpretation of the data. No industry representatives have reviewed the manuscript or its data prior to submission. Representatives from various CGM-related industries and diabetes organizations were informally asked if they still desired to have a metric similar to eA1C included in their glucose reports or online calculators. In addition, two of the authors, R.M.B. and R.W.B., had several discussions with representatives from the FDA (CDRH) to understand their position on eA1C.
While several authors are associated directly (employee) or indirectly (volunteer) with a diabetes professional organization, each author expressed their personal ideas and opinions in this Perspective. It will be up to the appropriate committees of any professional diabetes organization to consider further action regarding the suggestions pertaining to the use of GMI made in this Perspective.
Footnotes
This article contains Supplementary Data online at http://care.diabetesjournals.org/lookup/suppl/doi:10.2337/dc18-1581/-/DC1.
References
- 1.Riddlesworth TD, Beck RW, Gal RL, et al. Optimal sampling duration for continuous glucose monitoring to determine long-term glycemic control. Diabetes Technol Ther 2018;20:314–316 [DOI] [PubMed] [Google Scholar]
- 2.Danne T, Nimri R, Battelino T, et al. International consensus on use of continuous glucose monitoring. Diabetes Care 2017;40:1631–1640 [DOI] [PMC free article] [PubMed] [Google Scholar]
- 3.Beck RW, Connor CG, Mullen DM, Wesley DM, Bergenstal RM. The fallacy of average: how using HbA1c alone to assess glycemic control can be misleading. Diabetes Care 2017;40:994–999 [DOI] [PMC free article] [PubMed] [Google Scholar]
- 4.Miller KM, Foster NC, Beck RW, et al.; T1D Exchange Clinic Network . Current state of type 1 diabetes treatment in the U.S.: updated data from the T1D Exchange clinic registry. Diabetes Care 2015;38:971–978 [DOI] [PubMed] [Google Scholar]
- 5.Dickinson JK, Guzman SJ, Maryniuk MD, et al. The use of language in diabetes care and education. Diabetes Care 2017;40:1790–1799 [DOI] [PubMed] [Google Scholar]
- 6.Nathan DM, Kuenen J, Borg R, Zheng H, Schoenfeld D, Heine RJ; A1c-Derived Average Glucose Study Group . Translating the A1C assay into estimated average glucose values. Diabetes Care 2008;31:1473–1478 [DOI] [PMC free article] [PubMed] [Google Scholar]
- 7.Aleppo G, Ruedy KJ, Riddlesworth TD, et al.; REPLACE-BG Study Group . REPLACE-BG: a randomized trial comparing continuous glucose monitoring with and without routine blood glucose monitoring in adults with well-controlled type 1 diabetes. Diabetes Care 2017;40:538–545 [DOI] [PMC free article] [PubMed] [Google Scholar]
- 8.Beck RW, Riddlesworth T, Ruedy K, et al.; DIAMOND Study Group . Effect of continuous glucose monitoring on glycemic control in adults with type 1 diabetes using insulin injections: the DIAMOND randomized clinical trial. JAMA 2017;317:371–378 [DOI] [PubMed] [Google Scholar]
- 9.Beck RW, Riddlesworth TD, Ruedy K, et al.; DIAMOND Study Group . Continuous glucose monitoring versus usual care in patients with type 2 diabetes receiving multiple daily insulin injections: a randomized trial. Ann Intern Med 2017;167:365–374 [DOI] [PubMed] [Google Scholar]
- 10.Heinemann L, Freckmann G, Ehrmann D, et al. Real-time continuous glucose monitoring in adults with type 1 diabetes and impaired hypoglycaemia awareness or severe hypoglycaemia treated with multiple daily insulin injections (HypoDE): a multicentre, randomised controlled trial. Lancet 2018;391:1367–1377 [DOI] [PubMed] [Google Scholar]
- 11.Wilson DM, Xing D, Beck RW, et al.; Juvenile Diabetes Research Foundation Continuous Glucose Monitoring Study Group . Hemoglobin A1c and mean glucose in patients with type 1 diabetes: analysis of data from the Juvenile Diabetes Research Foundation continuous glucose monitoring randomized trial. Diabetes Care 2011;34:540–544 [DOI] [PMC free article] [PubMed] [Google Scholar]
- 12.American Diabetes Association 4. Lifestyle management: Standards of Medical Care in Diabetes—2018. Diabetes Care 2018;41(Suppl. 1):S38–S50 [DOI] [PubMed] [Google Scholar]
- 13.Fonseca VA, Grunberger G, Anhalt H, et al.; Consensus Conference Writing Committee . Continuous glucose monitoring: a consensus conference of the American Association of Clinical Endocrinologists and American College of Endocrinology. Endocr Pract 2016;22:1008–1021 [DOI] [PubMed] [Google Scholar]
- 14.Peters AL, Ahmann AJ, Battelino T, et al. Diabetes technology-continuous subcutaneous insulin infusion therapy and continuous glucose monitoring in adults: an Endocrine Society clinical practice guideline. J Clin Endocrinol Metab 2016;101:3922–3937 [DOI] [PubMed] [Google Scholar]
- 15.Bergenstal RM, Ahmann AJ, Bailey T, et al. Recommendations for standardizing glucose reporting and analysis to optimize clinical decision making in diabetes: the Ambulatory Glucose Profile (AGP). Diabetes Technol Ther 2013;15:198–211 [DOI] [PubMed] [Google Scholar]
- 16.Bergenstal RM. Continuous glucose monitoring: transforming diabetes management step by step. Lancet 2018;391:1334–1336 [DOI] [PubMed] [Google Scholar]
Associated Data
This section collects any data citations, data availability statements, or supplementary materials included in this article.