

Abstract
High intakes of vegetables have been associated with a lower incidence of cardiovascular diseases (CVD). However, the effect of vegetables on immune function and antioxidant status in human studies have provided contrasting results. In the present study, after a week of run-in period, 38 subjects at risk of CVD were randomly assigned to one of the following 4-week interventions: low vegetable consumption (800 g of vegetables/week) or high vegetable consumption (4200 g of vegetables/week). Vegetables included carrots, topinambur (Jerusalem artichoke, Helianthus tuberosus), tomatoes, red cabbage, and sweet peppers. Blood and salivary samples were collected before and after intervention periods. In addition to clinical, immunological, and antioxidant markers, leukocyte and lymphocyte expression of the gut-homing β7 integrin was evaluated. No significant changes were detected in clinical, immunological, and antioxidant markers in biological samples, except for an increase in white blood cell count for the low vegetable consumption group (p < 0.05). The study provides additional evidence about the uncertainty of providing a clear evidence for vegetables in modulating markers of immune function and antioxidant status. Further studies are needed in order to unravel the mechanism of effect of vegetable consumption in cardiovascular prevention.
1. Introduction
High intakes of fruits and vegetables have been associated with a lower incidence of cardiovascular diseases (CVD), due to their antioxidant and anti-inflammatory properties [1]. Data from a meta-analysis reported that the plant-derived food category, such as chocolate, fruits, and vegetables, showed a clear antioxidant response after acute ingestion, whereas only vegetables were able to increase plasma antioxidant capacity after chronic intervention trials [2]. However, some studies did not find improvement of oxidative DNA damage [3, 4] and lipid peroxidation markers [4] after the consumption of 600–800 g/d of fruits and vegetables for 24/28 days in healthy nonsmokers. In healthy subjects, results are conflicting when both antioxidant and inflammatory markers were measured in the same study after consumption of carrot juice [5], tomato juice [6], and Lyc-o-Mato in the form of drink [7] or supplement [8, 9]. In healthy nonsmoking men, 8 servings/d of carotenoid-rich vegetables and fruit for 4 wk did not change immunologic markers, including the number and activity of natural killer cells, secretion of cytokines, and lymphocyte proliferation [10] However, it must be taken into account that some of the intervention studies with vegetable-derived products (including juices and extracts) were not controlled for placebo and/or were conducted on healthy subjects [11]. In this context, it must be taken into account that both antioxidant [2] and anti-inflammatory [12] effects are more evident in subjects with CVD risk factors when compared with healthy subjects [2]. Therefore, the aim of this study was to evaluate the effects of high consumption of vegetables in subjects with risk factors for CVD on clinical, immunological, and antioxidant markers. For the intervention study, we selected topinambur for the previous observed improvement of glucose metabolism [13] and tomato, red cabbage, and/or carrot for the lipid lowering, anti-hypertensive, anti-coagulant, antioxidant, anti-inflammatory, and immunomodulating activities [14–22]. Immunomodulation has been reported in vitro also for pectin from sweet pepper [23], whereas red cabbage anthocyanins have been proposed as inhibitors of lipopolysaccharide-induced oxidative stress in blood platelets, indirectly by their antioxidant properties and directly by binding with Toll-like receptors (TLR) [24]. From that, in addition to commonly used clinical, immunological, and antioxidant markers, for the first time, we evaluated the effect of high vegetable consumption on the leukocyte and lymphocyte expression of the gut-homing β7 integrin, being a clinical relevant target for treatment [25].
2. Materials and Methods
2.1. Recruitment and Selection of the Subjects
Italian subjects were recruited by advertisements. Adult individuals (n = 60, 30 men and 30 women) aged between 26 and 65 years were selected (for women, a proven absence of menopause was required, being postmenopausal status an independent risk factors for CVD [26]) on the basis of the following criteria. Exclusion criteria: any pathology (including allergies and gastrointestinal disorders that reduce or alter nutrient absorption), use of drugs or supplements and special diet regimens (vegetarian or vegan). Inclusion criteria: at least one of the following risk factors for CVD: waist circumference > 102 cm (men) and 88 cm (women) and/or waist/hip circumference ratio > 0.95 (men) and 0.8 (women); total cholesterol > 200 mg/dl and/or HDL < 35 (men) and 40 (women) mg/dl and/or triglycerides > 150 mg/dl; smoking habit; sedentary lifestyle; and low fruit and vegetable consumption (maximum 4 portions/week).
Frequency of fruit and vegetable intake assessed by the validated 14-item questionnaire [27] and physical activity was evaluated according to the “Guidelines for Data Processing and Analysis of the International Physical Activity Questionnaire” (IPAQ) [28, 29]. Of the 60 selected subjects with a low consumption of fruit and vegetables, 38 subjects agreed to participate in the study and were recruited (Figure 1), 3 subjects left the study for personal reasons (1 of group low and 2 of group high), and 5 subjects (3 group low and 2 group high) reported symptoms of viral influence during the study; for this reason, they have been excluded. At the end of the follow-up, 30 compliant subjects (15 for each group) were included (Figure 1). All subjects had low physical activity level and had a low consumption of fruit and vegetables at baseline. Percentage of smokers and dyslipidaemic subjects and macronutrient intakes in the two groups after randomization are described in Table 1.
Figure 1.

Flow chart of study.
Table 1.
Baseline characteristics and dietary intakes of included subjects.
| High (n = 15) | Low (n = 15) | |
|---|---|---|
| BMI (kg/m2) | 26.61 ± 4.09 | 24.56 ± 4.39 |
| Smokers (n) | 60% (9/15) | 60% (9/15) |
| Dyslipidaemic subjects (n) | 67% (10/15) | 53% (8/15) |
| Kcal/day | 1959 ± 239 | 1873 ± 702 |
| Carbohydrates (g/day) | 236 ± 51 | 218 ± 76 |
| Protein (g/day) | 70 ± 13 | 72 ± 27 |
| Lipid (g/day) | 75 ± 11 | 76 ± 27 |
High (4200 g/week) or low (800 g/week) vegetable consumption. BMI: body mass index. Data are expressed as mean ± SD.
2.2. Vegetables
In order to standardize the vegetables consumed between subjects, carrots, topinambur, tomatoes, red cabbage, and sweet peppers were purchased by an organic farming company and were delivered weekly (Biobox S.r.l., Italy) to subjects' homes. During the study period, 4 different samples of vegetables were collected and analysed in triplicate for their antioxidant and phenolic content. Extracts containing the medium polar compounds (ANFI-Ex) and the water extracts (W-Ex) of vegetables were obtained as previously described [30]. The ferric-reducing antioxidant power (FRAP) assay was utilized to measure the antioxidant capacity of vegetables and the total phenol content (TPC) was measured using the Folin Ciocalteu assay, as previously described [31].
2.3. Study Design and Intervention
After a week of run-in period (Figure 1), in a parallel design, the subjects (n = 38) were randomly assigned to one of the following 4-week interventions:
Low (control, n = 19) vegetable consumption: ≈800 g of vegetables/week (152 g carrots, 152 g topinambur, 152 g tomatoes, 152 g red cabbage, and 190 g sweet peppers)
High (increased consumption of vegetables, n = 19): 4200 g of vegetables/week (800 g carrots, 800 g topinambur, 800 g tomatoes, 800 g red cabbage, and 1000 g sweet peppers). Compliance to dietary instructions was evaluated by 3-day food diaries. During the 4-week intervention, apart from the consumption of vegetables, subjects did not change dietary and lifestyle habits and at the end of the intervention intrasubject BMI did not change compared to baseline level
2.4. Collection and Analysis of Samples
On subjects fasting for at least 12 hours, venous blood samples were taken, according to the good clinical practice at Ospedale San Raffaele Pisana, Rome, and samples of saliva (Salivette, Sarstedt) were collected.
Clinical markers (glucose, insulin, total cholesterol: TC, low-density lipoproteins: LDL, high density lipoproteins: HDL, triglycerides: TG, proteins, uric acid: UA, and direct, indirect, and total bilirubin: dir-BR, ind-BR, and BR), plasma immunoglobulins, markers of thrombotic risk (fibrinogen and D-dimer), and complete blood count, including mean platelet volume (MPV) and platelet distribution width (PDW), were measured according to the good clinical practice at Ospedale San Raffaele Pisana, Rome [32–34].
Salivary UA levels were measured by colorimetric kits provided by Sentinel CH. SpA. HOMA-IR was calculated from glucose and insulin values. Salivary immunoglobulins A (IgAs) (LS bio), plasma transforming growth factor- (TGF-) β (RayBiotech) and interleukin- (IL-) 17 (RaybBiotech) were measured with ELISA kits. Plasma IL-2, IL-4, IL-6, IL-10, interferon- (INF-) γ, and tumor necrosis factor- (TNF-) α were measured with CBA kit (BD).
Immunophenotype was analysed on a Coulter Epics XL-MCL (Beckman Coulter), using monoclonal antibodies labelled with four fluorescent dyes, fluorescein isothiocyanate (FITC: CD16by R&D systems and CD45RA andCD127 by BD), phycoerythrin (PE: CD8, CD19, and CD25 all by R&D systems), phycoerythrin-Texas Red (ECD: CD3, CD4, and CD14 all by Beckman Coulter), and PhycoerythrinCyanin 5 (PC5: integrin β-7 by BD). Forward scatter (FSC) and side scatter (SSC) were acquired on a linear scale and fluorescence was acquired on a logarithmic scale. The percentage of leukocytes expressing the gut homing β-7 integrin was evaluated in the gated regions of granulocytes (FSClowSSChigh), monocytes (CD14+CD4dim), natural killer cells (NK, CD3−CD8dimCD16+), B lymphocytes (CD19+), T lymphocytes (CD3+), T-cytotoxic lymphocytes (CD3+CD8+), T-helpers (CD4+), naïve (CD45RA+) and memory (CD45RA−) T cells, and T-helpers with different expression of IL-2 receptor (CD25−, CD25dim, CD25bright) including regulatory T cells (Treg CD4+CD25brightCD127−).
For platelet-rich plasma (PRP), blood was collected in citrate tubes (BD Vacutainer), centrifuged at 180 g for 15 minutes, and washed platelets were obtained as previously described [35]. Platelets were activated with 0.5 mM arachidonic acid (Sigma) for 10 minutes at 37°C and labelled with antibody CD61-PE (R&D systems) and PAC-1-FITC (BD) for GpIIbIIIa analysis. For PAC-1, platelets were fixed with paraformaldehyde as previously described [35]. Samples were acquired on a BD FACSCalibur cytometer. In order to avoid artefacts in fluorescence signal due to platelets' dimension and aggregation [36, 37], platelets were divided in two populations (R1 and R2) according to their FSC and CD61 staining. CD61 negative events, imputable to debris, were excluded from the analysis. R1 and R2 PAC-1 level has been expressed as mean fluorescence intensity.
For antioxidant evaluation, plasma in EDTA tubes (BD Vacutainer) was separated after centrifugation (at 1300 g at 48°C for 15 min) and stored at −80°C. Determination of sulfhydryl groups (SH) was performed using 5,50-dithiobis(2-nitrobenzoic acid) and the total radical-trapping antioxidant parameter (TRAP) and the FRAP were measured as previously described [31].
2.5. Statistical Analysis
Results showing a normal pattern were analysed by analysis of variance (ANOVA), others by Kruskal-Wallis one-way analysis of variance on ranks. The significance of the differences between treatments within the same time and those between the different times within the same treatment group were evaluated using the Student-Newman-Keuls method.
3. Results
3.1. Analysis of Vegetables
The TPC and the FRAP of the ANFI-Ex and W-Ex of the vegetables supplied to the subjects are shown in Table 2.
Table 2.
Antioxidant capacity and flavonoid content of vegetables provided for the study.
| W-Ex | ANFI-Ex | |||
|---|---|---|---|---|
| FRAP μM | TPC μg GAE/g | FRAP μM | TPC μg GAE/g | |
| Carrot | 0.00 | 11.46 ± 2.62 | 22.70 ± 27.10 | 12.41 ± 5.69 |
| Red cabbage | 250.52 ± 108.69 | 37.01 ± 22.81 | 361.85 ± 214.89 | 48.71 ± 14.73 |
| Pepper | 737.29 ± 261.93 | 59.05 ± 12.77 | 229.21 ± 76.01 | 26.36 ± 3.81 |
| Tomato | 110.15 ± 70.70 | 13.24 ± 1.41 | 0.00 | 8.32 ± 3.37 |
| Topinambur | 0.00 | 10.47 ± 0.91 | 0.00 | 13.85 ± 4.08 |
FRAP: ferric-reducing antioxidant power; TPC: total phenol content; GAE: gallic acid equivalents; ANFI-Ex: extracts containing the medium polar compounds; W-Ex: water extracts. The data are the mean ± SD of 4 different samples collected during the study analysed in triplicate.
The higher average content of TPC and the greater FRAP was found in the W-Ex of the pepper (Table 2). On the other hand, although ANFI-Ex had lower TPC and FRAP, within them, red cabbage had the higher TPC and FRAP (Table 2).
3.2. Clinical, Immunological, and Antioxidant Markers
In Table 3 are described clinical parameters (glucose, insulin, TC, LDL, HDL, TG, BR, dir-BR, ind-BR, and proteins), markers of thrombotic risk (fibrinogen and D-dimer), platelet count, MPV, PDW, and ex vivo platelets' activation. No significant differences were found between all the markers analysed.
Table 3.
Clinical markers, thrombotic risk, and platelet activation.
| High T0 | High T4 | Low T0 | Low T4 | |
|---|---|---|---|---|
| Glucose mg/dl | 90.3 ± 5.5 | 94.0 ± 7.4 | 89.6 ± 4.3 | 90.6 ± 6.8 |
| Insulin μUI/ml | 8.1 (5.4–11.8) | 8.1 (5.0–9.4) | 6.8 (5.0–9.4) | 7.9 (5.3–10.5) |
| HOMA-IR | 1.7 (1.1-2.6) | 1.8 (1.1-2.1) | 1.4 (1.0-1.9) | 1.6 (1.1-2.3) |
| TC mg/dl | 217.1 ± 35.8 | 217.3 ± 38.3 | 207.9 ± 41.0 | 204.8 ± 40.3 |
| LDL mg/dl | 140.1 ± 27.0 | 137.7 ± 28.9 | 127.9 ± 35.1 | 125.4 ± 33.7 |
| HDL mg/dl | 58.9 ± 8.1 | 60.5 ± 7.7 | 58.3 ± 8.5 | 57.3 ± 9.3 |
| TG mg/dl | 88 (65–104) | 86 (73–100) | 110 (64–161) | 84 (69–176) |
| BR mg/dl | 0.5 (0.4–0.6) | 0.5 (0.4–0.7) | 0.6 (0.3–0.7) | 0.5 (0.3–0.6) |
| dir-BR mg/dl | 0.12 (0.11–0.15) | 0.12 (0.11–0.16) | 0.14 (0.09–0.17) | 0.13 (0.10–0.16) |
| ind-BR mg/dl | 0.38 (0.29–0.49) | 0.38 (0.31–0.54) | 0.45 (0.21–0.55) | 0.37 (0.23–0.47) |
| Proteins g/dl | 6.8 ± 0.3 | 6.9 ± 0.1 | 6.8 ± 0.5 | 7.0 ± 0.4 |
| Fibrinogen mg/dl | 336.9 ± 39.7 | 340.9 ± 43.9 | 319.3 ± 43.3 | 325.2 ± 46.9 |
| D-dimer ng/ml | 323.7 (251.6–412.3) | 288.5 (234.7–397.6) | 277.3 (213.5–427.9) | 320.2 (228.1–414.3) |
| Pt 10^3/microL | 262 (223–288) | 244 (212–293) | 248 (219–301) | 245 (220–336) |
| MPV fL | 8.6 ± 0.9 | 8.6 ± 0.9 | 8.5 ± 0.7 | 8.4 ± 0.7 |
| PDW % | 16.3 ± 0.4 | 16.3 ± 0.4 | 16.3 ± 0.5 | 16.4 ± 0.5 |
| PAC-1 R1 | 140.5 (49.1–226.3) | 156.2 (135.7–187.8) | 122.6 (98.5–255.1) | 199.8 (151.1–291.1) |
| PAC-1 R1 AA | 159.4 (48.8–174.4) | 155.7 (147.1–212.7) | 151.8 (62.9–193.2) | 206.2 (129.9–256.0) |
| PAC-1 R2 | 234.2 (34.9–373.7) | 138.2 (99.8–187.5) | 277.5 (68.2–411.8) | 260.1 (183.1–296.8) |
| PAC-1 R2 AA | 213.8 ± 150.7 | 132.5 ± 78.3 | 215.6 ± 124.2 | 169.0 ± 98.9 |
Values at baseline (high T0 and low T0) and 4 weeks after high (4200 g/week) or low (800 g/week) vegetable consumption. Data are expressed as mean ± SD (normality test passed; ANOVA applied) or median (25%, 75%) (normality test failed; Kruskal-Wallis ANOVA on ranks applied). Pt: platelets; MPV: mean platelet volume; PDW: platelet distribution width; PAC-1 expression was measured after ex-vivo platelets' activation (AA: arachidonic acid; R1 and R2 gates are depicted in Figure 2); TC: total cholesterol; TG: triglycerides; UA: uric acid.
In particular, the analysis of the platelets' ex vivo stimulation with AA revealed that high vegetable consumption did not affect significantly PAC-1 expression. A nonsignificant decrease after high consumption of vegetables was observed for PAC-1 R2 AA (Table 3). Although this effect was accompanied by nonsignificant decreases in Pt counts and D-dimer concentrations, a trend of increase in fibrinogen has been observed and no differences were found in the in vivo markers of platelet activation MPV and PDW.
Dietary intervention did not affect red blood cell count (RBC 10^9/ml median (25%–75%): 4.6 (4.4–4.9) high T0, 4.7 (4.5–4.9) high T4; 4.7 (4.5–4.8) low T0, 4.6 (4.4–4.9) low T4), mean corpuscular volume (MCV fL median (25%–75%): 92.6 (88.5–94.4) high T0, 92.3 (88.5–94.5) high T4; 90.5 (85.4–92.9) low T0, 91.1 (85.4–92.9) low T4), and haemoglobin (Hb g/dl mean ± SD: 14.1 ± 1.3 high T0, 14.1 ± 1.4 high T4; 13.5 ± 1.2 low T0, 13.5 ± 1.4 low T4).
On the other hand, white blood cells (WBC) were significantly higher (p < 0.05) after 4 weeks of low intake of vegetables (low T4) compared to the high consumption (high T4) (Figure 2).
Figure 2.
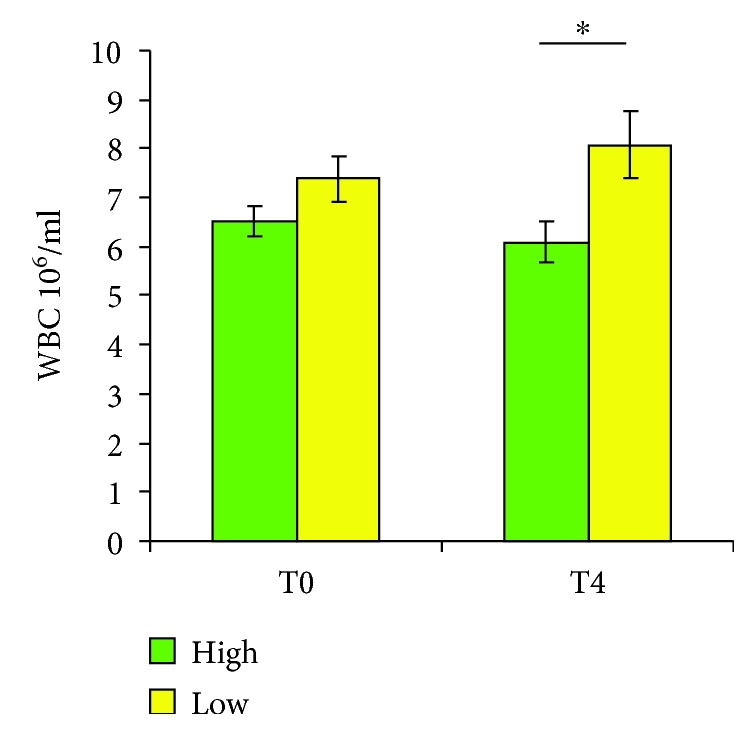
White blood cell count after interventions. Values at baseline (high T0 and low T0) and 4 weeks after high (4200 g/week) or low (800 g/week) vegetable consumption. Data are expressed as mean ± SEM (normality test passed; ANOVA applied, followed by Student-Newman-Keuls). High T4 versus low T4 ∗p < 0.05.
Moreover, due to the high variability within subjects, no significant differences were found in the counts of the different leukocyte populations (neutrophils 10^6/ml median (25%–75%): 3.8 (3.1–4.6) high T0, 3.9 (2.6–4.5) high T4; 4.0 (3.6–5.4) low T0, 4.3 (3.4–6.1) low T4; basophils 10^6/ml median (25%–75%): 0.0 (0–0.1) high T0, 0.0 (0–0.1) high T4; 0.0 (0–0.1) low T0, 0.0 (0–0.1) low T4; eosinophils 10^6/ml median (25%–75%): 0.2 (0.1–0.3) high T0, 0.2 (0.1–0.4) high T4, 0.2 (0.1–0.2) low T0, 0.20 (0.1–0.3) low T4; monocytes 10^6/ml mean ± SD: 0.50 ± 0.18 high T0, 0.49 ± 0.14 high T4; 0.50 ± 0.15 low T0, 0.54 ± 0.19 low T4; lymphocytes 10^6/ml median (25%–75%): 1.9 (1.4–2.3) high T0, 2.0 (1.50–2.2) high T4; 2.0 (1.5–2.4) low T0, 2.1 (1.9–2.7) low T4).
Low percentages (≤10%) of granulocytes, monocytes, and Treg expressed β-7 integrin (Table 4). The latter was present on about 20% of NK and CD4, with higher expression on CD4 naïve (28-29%), whereas percentages higher than 30 were found in B and CD8 populations (Table 4).
Table 4.
Percentages of leukocytes and lymphocytes' subsets expressing β7 integrin.
| % | High T0 | High T4 | Low T0 | Low T4 |
|---|---|---|---|---|
| Granulocytes β7+ | 0.8 (0.4–1.1) | 0.7 (0.5–1.0) | 0.6 (0.5–0.8) | 0.7 (0.4–0.9) |
| Monocytes β7+ | 6.1 ± 2.1 | 5.9 ± 2.1 | 6.8 ± 1.9 | 6.5 ± 2.7 |
| NK | 7.8 (5.9–14.2) | 10.2 (9.0–15.4) | 8.2 (5.0–13.3) | 10.9 (6.1–12.2) |
| NK β7+ | 18.3 ± 7.2 | 22.2 ± 5.6 | 19.4 ± 6.7 | 22.2 ± 6.9 |
| B | 6.8 (5.9–9.4) | 8.8 (3.7–10.9) | 9.8 (6.8–14.7) | 8.3 (5.9–11.5) |
| B β7+ | 47.7 ± 11.5 | 48.9 ± 11.4 | 44.6 ± 17.9 | 47.6 ± 13.7 |
| T | 83.0 ± 5.3 | 79.4 ± 5.4 | 80.1 ± 5.3 | 80.8 ± 5.2 |
| T β7+ | 30.4 ± 4.6 | 30.3 ± 6.7 | 31.1 ± 5.4 | 32.2 ± 7.0 |
| CD8 | 26.7 (24.3–29.1) | 27.0 (24.4–29.0 | 28.3 (24.4–33.3) | 27.8 (22.5–34.5) |
| CD8 β7+ | 45.5 ± 9.0 | 45.5 ± 11.5 | 44.7 ± 10.2 | 45.5 ± 11.3 |
| CD8 naïve | 36.1 ± 12.0 | 35.7 ± 10.1 | 40.4 ± 15.9 | 39.6 ± 13.8 |
| CD8 naïve β7+ | 46.4 ± 8.7 | 45.4 ± 10.3 | 45.0 ± 8.6 | 45.7 ± 8.5 |
| CD8 memory | 63.9 ± 12.0 | 64.3 ± 10.1 | 59.6 ± 15.9 | 60.3 ± 13.8 |
| CD8 memory β7+ | 44.6 ± 9.9 | 45.4 ± 12.8 | 43.9 ± 11.4 | 45.5 ± 12.9 |
| CD4 | 73.3 (70.9–75.7) | 73.0 (71.0–75.6) | 71.7 (66.6–75.6) | 72.2 (65.5–77.5) |
| CD4 β7+ | 22.0 ± 3.7 | 21.7 ± 4.7 | 22.6 ± 4.8 | 23.3 ± 5.2 |
| CD4 naïve | 58.4 ± 12.4 | 55.4 ± 13.6 | 55.2 ± 10.0 | 52.7 ± 9.5 |
| CD4 naïve β7+ | 28.4 ± 3.5 | 28.3 ± 5.7 | 28.7 ± 4.7 | 29.7 ± 6.7 |
| CD4 memory | 41.6 ± 12.4 | 44.6 ± 13.6 | 44.8 ± 10.0 | 47.3 ± 9.4 |
| CD4 memory β7+ | 21.3 ± 5.5 | 21.7 ± 6.0 | 21.0 ± 6.6 | 23.0 ± 5.9 |
| CD4CD25− | 49.6 ± 7.3 | 49.2 ± 9.0 | 53.9 ± 8.6 | 52.0 ± 6.6 |
| CD4CD25− β7+ | 21.6 ± 4.7 | 20.5 ± 5.1 | 21.2 ± 5.7 | 21.8 ± 5.7 |
| CD4CD25dim | 44.4 ± 6.3 | 45.3 ± 7.9 | 40.9 ± 7.8 | 43.0 ± 6.3 |
| CD4CD25dim β7+ | 19.8 ± 4.0 | 19.8 ± 4.9 | 21.6 ± 5.2 | 22.6 ± 5.3 |
| Treg | 5.9 ± 1.3 | 5.5 ± 1.6 | 5.5 ± 0.7 | 5.1 ± 1.3 |
| Tregβ7+ | 10.9 ± 2.3 | 9.2 ± 3.4 | 10.5 ± 3.1 | 9.2 ± 2.8 |
Values at baseline (low T0 and high T0) and 4 weeks after low (800 g/week) or high (4200 g/week) vegetable consumption. Data are expressed as mean ± SD (normality test passed; ANOVA applied) or median (25%, 75%) (normality test failed; Kruskal-Wallis ANOVA on ranks applied).
Neither lymphocyte subsets nor expression of β-7 integrin on leukocytes changed significantly after both low and high vegetable consumption (Table 4). Salivary IgA (IgAs) as well as plasma immunoglobulins and cytokines did not change significantly after both dietary interventions (Table 5). No significant differences in plasma and salivary antioxidants were observed (Table 6).
Table 5.
Immunoglobulins and cytokines.
| High T0 | High T4 | Low T0 | Low T4 | |
|---|---|---|---|---|
| IgAsμg/dl | 1.0 ± 0.4 | 1.3 ± 0.7 | 0.6 ± 0.4 | 1.1 ± 0.7 |
| IgA ml/dl | 147.0 (125.0–203.0) | 156.0 (118.0–203.0) | 166.0 (118.7–204.2) | 157.0 (121.5–185.0) |
| IgE IU/ml | 45.5 (21.5–157.5) | 48.5 (19.5–125.5) | 18.0 (2.0–53.0) | 26.0 (6.0–69.0) |
| IgG ml/dl | 1049.1 ± 110.1 | 997.0 ± 133.4 | 1039.6 ± 170.5 | 1009.2 ± 170.0 |
| IgM ml/dl | 107.0 (65.0–155.0) | 105.0 (73.0–163.0) | 142.5 (74.0–192.7) | 141.0 (70.7–186.5) |
| TGF-βpg/ml | 1.2 ± 0.7 | 1.3 ± 0.7 | 1.3 ± 0.6 | 1.3 ± 0.5 |
| IL-17 pg/ml | 2.4 (0.3–3.5) | 2.7 (0.6–3.0) | 0.8 (0.4–2.5) | 1.6 (0.5–2.2) |
| TNF-αpg/ml | 8.3 (8.2–9.0) | 8.3 (7.9–8.5) | 8.6 (8.2–9.0) | 8.6 (8.1–9.0) |
| IL-6 pg/ml | 7.9 (7.7-8.8) | 8.5 (7.7–9.2) | 8.8 (8.0–9.6) | 8.4 (7.9–9.4) |
| IL-10 pg/ml | 8.3 (8.1–9.0) | 8.7 (8.3–9.1) | 8.7 (8.3–9.2) | 8.7 (8.4–8.9) |
| IL-4 pg/ml | 7.4 (7.2–7.6) | 7.5 (7.1–8.4) | 7.9 (7.3–8.1) | 7.7 (7.5–8.2) |
| IL-2 pg/ml | 7.0 (6.9–7.6) | 7.4 (7.1–7.7) | 7.7 (7.3–7.9) | 7.6 (7.4–7.7) |
| IFN-γpg/ml | 8.1 ± 0.5 | 8.1 ± 0.5 | 8.3 ± 0.7 | 8.2 ± 0.5 |
Values at baseline (high T0 and low T0) and 4 weeks after high (4200 g/week) or low (800 g/week) vegetable consumption. Data are expressed as mean ± SD (normality test passed; ANOVA applied) or median (25%, 75%) (normality test failed; Kruskal-Wallis ANOVA on ranks applied). IL: interleukin; INF: interferon; Ig: immunoglobulins; salivary IgA: IgAs; TGF: transforming growth factor; TNF: tumor necrosis factor.
Table 6.
Plasma and salivary antioxidants.
| High T0 | High T4 | Low T0 | Low T4 | |
|---|---|---|---|---|
| TRAP μM (plasma) | 902.7 (866.5–1066.1) | 929.7 (831.1–1103.6) | 945.3 (857.3–1086.8) | 944.4 (850.5–1135.8) |
| SH μM (plasma) | 586.8 ± 69.4 | 555.6 ± 78.4 | 586.8 ± 92.1 | 547.5 ± 94.6 |
| UA μM (plasma) | 190.4 (154.7–243.9) | 196.3 (136.8–238.0) | 214.2 (166.6–238.0) | 202.3 (178.5–226.1) |
| FRAP μM (plasma) | 666.2 (568.2–693.0) | 688.6 (561.8–790.2) | 673.1 (581.5–799.6) | 635.8 (585.4–720.1) |
| TRAP μM (saliva) | 432.2 ± 129.8 | 374.7 ± 112.7 | 380.0 ± 114.0 | 389.1 ± 114.3 |
| FRAP μM (saliva) | 498.9 (368.6–611.8) | 451.7 (371.7–596.9) | 563.1 (407.3–665.1) | 474.6 (278.1–578.6) |
| UA μM (saliva) | 127.9 ± 13.7 | 126.7 ± 14.1 | 131.5 ± 17.5 | 128.5 ± 16.5 |
Values at baseline (high T0 and low T0) and 4 weeks after high (4200 g/week) or low (800 g/week) vegetable consumption. Data are expressed as mean ± SD (normality test passed; ANOVA applied) or median (25%, 75%) (normality test failed; Kruskal-Wallis ANOVA on ranks applied). TRAP: radical-trapping antioxidant parameter; FRAP: ferric-reducing antioxidant power; SH: sulfhydryl groups; UA: uric acid.
4. Discussion
In the present study, nonsignificant differences were found in antioxidant, inflammatory, and immune status, as well as in metabolic markers, after a 4-week high vegetable consumption.
Despite the small sample sizes could led to ineffective randomization and potential confounding, other crossover [38, 39] or larger [40, 41] trials, with high fruit and/or vegetable intakes [40] or high dietary total antioxidant capacity (TAC) diets [38, 39], did not observe significant effects on markers of glucose metabolism [38–41], TG [38, 39], TC [38, 39], FRAP [38, 39], leukocyte count [39], and inflammatory markers [40, 41]. Moreover, Valtueña et al. observed an unexpected decrease in plasma malondialdehyde after a diet with low TAC but not after the high-TAC diet [39]. This result reflects the difficulty of monitoring potential confounding during nutritional interventions in humans. In the present study, despite the exclusion of 5 subjects who reported symptoms of viral influence during the study, we cannot exclude nonreported events that could account of the observed increase in WBC count after low vegetable consumption.
Moreover, the evaluation of the effects of plant foods in humans presents many difficulties, including the healthy status of the selected subjects and the portion size of treatment and control groups. We used 3 servings of the portion size for vegetables (200 g) suggested by IV Revision of LARN (Intake Levels of Reference of Nutrients and energy for Italian population http://www.sinu.it/public/20141111_LARN_Porzioni.pdf), thus we compared 600 g/d (3 portions) versus 114 g/d of vegetables, including organic carrots, topinambur, tomatoes, red cabbage, and sweet peppers. Despite the high portion size of vegetables and the CVD risk factors of subjects in our study, we did not observe significant changes in any marker and our results are in line with that of Crane et al. [42]. In a crossover design overweight, postmenopausal women consumed for 3 weeks: 130 g, 287 g, and 614 g servings/d of fresh, greenhouse-grown vegetables, including baby carrots, baby leaf lettuce green mix, red bell peppers, and tomatoes [42]. Urinary 8-isoprostane F2α and serum high sensitivity C-reactive protein (CRP) were unchanged, despite the dose-response increase in plasma total carotenoids [42]. Moreover, in the study of Briviba et al. [4], vegetable intake (4.3 ± 0.6, 1 serving = 100 g, 430 g/d) included broccoli, brussels sprouts, cabbage, carrots, cauliflower, corn, cucumber, fennel, green beans, kohlrabi, lettuce, peas, radish, red cabbage, spinach, tomato, and zucchini. Authors did not observe differences in markers of DNA damage, lipid peroxidation (malondialdehyde and 8-iso-prostaglandin-F2alpha), and plasma trolox-equivalent antioxidant capacity, between 430 g/d and 100 g/d of vegetables [4]. However, Briviba et al. [4] evaluated the effect of the increase of both fruit and vegetable consumption (fruit 1 versus 3.5 servings/d, one serving = 100 g fruit or 200 ml juice).
In a recent meta-analysis [43], intervention studies with fruit and vegetable (including juices and extracts) intake decreased circulating levels of C-reactive protein and TNF-α but not IL-6. However, concerning the 8 trials that evaluated the anti-inflammatory effect of vegetable intake, only 3 observed decreases in CRP, TNF-α, and IL-6, two of which involve supplements (garlic or tomato extract) [43]. Moreover, the significant increase in the γδ-T cell population (mean difference: 1.68; p = 0.02), that have a role at the level of epithelial barriers (including bowel) [44], came from only 3 studies (93 treatments and 89 controls), of which 2 interventions with supplements (garlic extract and capsules of fruit and vegetable concentrate juice) and one with grape juice [43]. In our study, the gut-homing β7 integrin was not affected by high vegetable consumption. Therefore, no conclusive data are available on the effect of plant foods on gut-associated lymphocytes.
5. Conclusion
The study provides additional evidence about the uncertainty of providing a clear evidence for vegetables in modulating markers of immune function and antioxidant status. Further studies, including also the evaluation of potential changes in the human gut microbiota [45], are need in order to unravel the mechanism of effect of vegetable consumption in cardiovascular prevention.
Acknowledgments
This study was supported by the grant of the Italian Ministry of Agricultural, Nutritional Policies and Forestry (MiPAAF–MEDITO).
Data Availability
The data used to support the findings of this study are restricted by the San Raffaele Ethics Committee in order to protect patient privacy. Data are available from Mauro Serafini for researchers who meet the criteria for access to confidential data.
Ethical Approval
Approval for the study was obtained from the Ethics Committee of the I.R.C.C.S. San Raffaele Pisana and all procedures involving human subjects complied with the Declaration of Helsinki as revised in 2000.
Consent
Written informed consent was obtained from all the participants in accordance with the Italian law (law number 196/2003. Ministry of Health Circular Letter GU number 76/2008).
Conflicts of Interest
The authors declare that there is no conflict of interests regarding the publication of this paper.
References
- 1.Griffiths K., Aggarwal B., Singh R., Buttar H., Wilson D., de Meester F. Food antioxidants and their anti-inflammatory properties: a potential role in cardiovascular diseases and cancer prevention. Diseases. 2016;4(4):p. 28. doi: 10.3390/diseases4030028. [DOI] [PMC free article] [PubMed] [Google Scholar]
- 2.Lettieri-Barbato D., Tomei F., Sancini A., Morabito G., Serafini M. Effect of plant foods and beverages on plasma non-enzymatic antioxidant capacity in human subjects: a meta-analysis. The British Journal of Nutrition. 2013;109(9):1544–1556. doi: 10.1017/S0007114513000263. [DOI] [PubMed] [Google Scholar]
- 3.Møller P., Vogel U., Pedersen A., Dragsted L. O., Sandström B., Loft S. No effect of 600 grams fruit and vegetables per day on oxidative DNA damage and repair in healthy nonsmokers. Cancer Epidemiology, Biomarkers & Prevention. 2003;12(10):1016–1022. [PubMed] [Google Scholar]
- 4.Briviba K., Bub A., Möseneder J., et al. No differences in DNA damage and antioxidant capacity between intervention groups of healthy, nonsmoking men receiving 2, 5, or 8 servings/day of vegetables and fruit. Nutrition and Cancer. 2008;60(2):164–170. doi: 10.1080/01635580701621346. [DOI] [PubMed] [Google Scholar]
- 5.Potter A. S., Foroudi S., Stamatikos A., Patil B. S., Deyhim F. Drinking carrot juice increases total antioxidant status and decreases lipid peroxidation in adults. Nutrition Journal. 2011;10(1, article 96) doi: 10.1186/1475-2891-10-96. [DOI] [PMC free article] [PubMed] [Google Scholar]
- 6.Li Y. F., Chang Y. Y., Huang H. C., Wu Y. C., Yang M. D., Chao P. M. Tomato juice supplementation in young women reduces inflammatory adipokine levels independently of body fat reduction. Nutrition. 2015;31(5):691–696. doi: 10.1016/j.nut.2014.11.008. [DOI] [PubMed] [Google Scholar]
- 7.Riso P., Visioli F., Grande S., et al. Effect of a tomato-based drink on markers of inflammation, immunomodulation, and oxidative stress. Journal of Agricultural and Food Chemistry. 2006;54(7):2563–2566. doi: 10.1021/jf053033c. [DOI] [PubMed] [Google Scholar]
- 8.Wood L. G., Garg M. L., Smart J. M., Scott H. A., Barker D., Gibson P. G. Manipulating antioxidant intake in asthma: a randomized controlled trial. The American Journal of Clinical Nutrition. 2012;96(3):534–543. doi: 10.3945/ajcn.111.032623. [DOI] [PubMed] [Google Scholar]
- 9.Denniss S. G., Haffner T. D., Kroetsch J. T., Davidson S. R., Rush J. W. E., Hughson R. L. Effect of short-term lycopene supplementation and postprandial dyslipidemia on plasma antioxidants and biomarkers of endothelial health in young, healthy individuals. Vascular Health and Risk Management. 2008;4(1):213–222. doi: 10.2147/vhrm.2008.04.01.213. [DOI] [PMC free article] [PubMed] [Google Scholar]
- 10.Watzl B., Kulling S. E., Möseneder J., Barth S. W., Bub A. A 4-wk intervention with high intake of carotenoid-rich vegetables and fruit reduces plasma C-reactive protein in healthy, nonsmoking men. The American Journal of Clinical Nutrition. 2005;82(5):1052–1058. doi: 10.1093/ajcn/82.5.1052. [DOI] [PubMed] [Google Scholar]
- 11.Serafini M., Peluso I. Functional foods for health: the interrelated antioxidant and anti-inflammatory role of fruits, vegetables, herbs, spices and cocoa in humans. Current Pharmaceutical Design. 2016;22(44):6701–6715. doi: 10.2174/1381612823666161123094235. [DOI] [PMC free article] [PubMed] [Google Scholar]
- 12.Peluso I., Miglio C., Morabito G., Ioannone F., Serafini M. Flavonoids and immune function in human: a systematic review. Critical Reviews in Food Science and Nutrition. 2015;55(3):383–395. doi: 10.1080/10408398.2012.656770. [DOI] [PubMed] [Google Scholar]
- 13.Rumessen J. J., Bode S., Hamberg O., Gudmand-Hoyer E. Fructans of Jerusalem artichokes: intestinal transport, absorption, fermentation, and influence on blood glucose, insulin, and C-peptide responses in healthy subjects. The American Journal of Clinical Nutrition. 1990;52(4):675–681. doi: 10.1093/ajcn/52.4.675. [DOI] [PubMed] [Google Scholar]
- 14.Lee G. Y., Lee J. J., Lee S. M. Antioxidant and anticoagulant status were improved by personalized dietary intervention based on biochemical and clinical parameters in cancer patients. Nutrition and Cancer. 2015;67(7):1083–1092. doi: 10.1080/01635581.2015.1073754. [DOI] [PubMed] [Google Scholar]
- 15.Gupta H., Pawar D., Riva A., Bombardelli E., Morazzoni P. A randomized, double-blind, placebo-controlled trial to evaluate efficacy and tolerability of an optimized botanical combination in the management of patients with primary hypercholesterolemia and mixed dyslipidemia. Phytotherapy Research. 2012;26(2):265–272. doi: 10.1002/ptr.3542. [DOI] [PubMed] [Google Scholar]
- 16.Shidfar F., Froghifar N., Vafa M., et al. The effects of tomato consumption on serum glucose, apolipoprotein B, apolipoprotein A-I, homocysteine and blood pressure in type 2 diabetic patients. International Journal of Food Sciences and Nutrition. 2011;62(3):289–294. doi: 10.3109/09637486.2010.529072. [DOI] [PubMed] [Google Scholar]
- 17.Watzl B., Bub A., Brandstetter B. R., Rechkemmer G. Modulation of human T-lymphocyte functions by the consumption of carotenoid-rich vegetables. The British Journal of Nutrition. 1999;82(5):383–389. doi: 10.1017/S0007114599001634. [DOI] [PubMed] [Google Scholar]
- 18.Podsędek A., Majewska I., Kucharska A. Z. Inhibitory potential of red cabbage against digestive enzymes linked to obesity and type 2 diabetes. Journal of Agricultural and Food Chemistry. 2017;65(33):7192–7199. doi: 10.1021/acs.jafc.7b02499. [DOI] [PubMed] [Google Scholar]
- 19.Huang H., Jiang X., Xiao Z., et al. Red cabbage microgreens lower circulating low-density lipoprotein (LDL), liver cholesterol, and inflammatory cytokines in mice fed a high-fat diet. Journal of Agricultural and Food Chemistry. 2016;64(48):9161–9171. doi: 10.1021/acs.jafc.6b03805. [DOI] [PubMed] [Google Scholar]
- 20.Cruz A. B., Pitz H. d. S., Veber B., Bini L. A., Maraschin M., Zeni A. L. B. Assessment of bioactive metabolites and hypolipidemic effect of polyphenolic-rich red cabbage extract. Pharmaceutical Biology. 2016;54(12):3033–3039. doi: 10.1080/13880209.2016.1200633. [DOI] [PubMed] [Google Scholar]
- 21.Al-Dosari M. S. Red cabbage (Brassica oleracea L.) mediates redox-sensitive amelioration of dyslipidemia and hepatic injury induced by exogenous cholesterol administration. The American Journal of Chinese Medicine. 2014;42(1):189–206. doi: 10.1142/S0192415X1450013X. [DOI] [PubMed] [Google Scholar]
- 22.Sankhari J. M., Thounaojam M. C., Jadeja R. N., Devkar R. V., Ramachandran A. V. Anthocyanin-rich red cabbage (Brassica oleracea L.) extract attenuates cardiac and hepatic oxidative stress in rats fed an atherogenic diet. Journal of the Science of Food and Agriculture. 2012;92(8):1688–1693. doi: 10.1002/jsfa.5532. [DOI] [PubMed] [Google Scholar]
- 23.do Nascimento G. E., Winnischofer S. M. B., Ramirez M. I., Iacomini M., Cordeiro L. M. C. The influence of sweet pepper pectin structural characteristics on cytokine secretion by THP-1 macrophages. Food Research International. 2017;102:588–594. doi: 10.1016/j.foodres.2017.09.037. [DOI] [PubMed] [Google Scholar]
- 24.Saluk J., Bijak M., Posmyk M. M., Zbikowska H. M. Red cabbage anthocyanins as inhibitors of lipopolysaccharide-induced oxidative stress in blood platelets. International Journal of Biological Macromolecules. 2015;80:702–709. doi: 10.1016/j.ijbiomac.2015.07.039. [DOI] [PubMed] [Google Scholar]
- 25.Sands B. E., Sandborn W. J., Van Assche G., et al. Vedolizumab as induction and maintenance therapy for Crohn’s disease in patients naïve to or who have failed tumor necrosis factor antagonist therapy. Inflammatory Bowel Diseases. 2017;23(1):97–106. doi: 10.1097/MIB.0000000000000979. [DOI] [PubMed] [Google Scholar]
- 26.Atsma F., Bartelink M.-L. E. L., Grobbee D. E., van der Schouw Y. T. Postmenopausal status and early menopause as independent risk factors for cardiovascular disease: a meta-analysis. Menopause. 2006;13(2):265–279. doi: 10.1097/01.gme.0000218683.97338.ea. [DOI] [PubMed] [Google Scholar]
- 27.Martínez-González M. A., García-Arellano A., Toledo E., et al. A 14-item mediterranean diet assessment tool and obesity indexes among high-risk subjects: the PREDIMED trial. PLoS One. 2012;7(8, article e43134) doi: 10.1371/journal.pone.0043134. [DOI] [PMC free article] [PubMed] [Google Scholar]
- 28.Fan M., Lyu J., He P. Chinese guidelines for data processing and analysis concerning the International Physical Activity Questionnaire. Zhonghua Liu Xing Bing Xue Za Zhi. 2014;35(8):961–964. [PubMed] [Google Scholar]
- 29.Patterson E. IPAQ scoring protocol - international physical activity questionnaire. Ipaq. 2010. Available from: https://sites.google.com/site/theipaq/scoring-protocol.
- 30.Pellegrini N., Serafini M., Colombi B., et al. Total antioxidant capacity of plant foods, beverages and oils consumed in Italy assessed by three different in vitro assays. The Journal of Nutrition. 2003;133(9):2812–2819. doi: 10.1093/jn/133.9.2812. [DOI] [PubMed] [Google Scholar]
- 31.Miglio C., Peluso I., Raguzzini A., et al. Fruit juice drinks prevent endogenous antioxidant response to high-fat meal ingestion. The British Journal of Nutrition. 2014;111(2):294–300. doi: 10.1017/S0007114513002407. [DOI] [PubMed] [Google Scholar]
- 32.Marazzi G., Pelliccia F., Campolongo G., et al. Usefulness of nutraceuticals (Armolipid Plus) versus ezetimibe and combination in statin-intolerant patients with dyslipidemia with coronary heart disease. The American Journal of Cardiology. 2015;116(12):1798–1801. doi: 10.1016/j.amjcard.2015.09.023. [DOI] [PubMed] [Google Scholar]
- 33.Bellia A., Iellamo F., De Carli E., et al. Exercise individualized by TRIMPi method reduces arterial stiffness in early onset type 2 diabetic patients: a randomized controlled trial with aerobic interval training. International Journal of Cardiology. 2017;248:314–319. doi: 10.1016/j.ijcard.2017.06.065. [DOI] [PubMed] [Google Scholar]
- 34.Ferroni P., Riondino S., Formica V., et al. Venous thromboembolism risk prediction in ambulatory cancer patients: clinical significance of neutrophil/lymphocyte ratio and platelet/lymphocyte ratio. International Journal of Cancer. 2015;136(5):1234–1240. doi: 10.1002/ijc.29076. [DOI] [PubMed] [Google Scholar]
- 35.Pignatelli P., Carnevale R., Di Santo S., et al. Rosuvastatin reduces platelet recruitment by inhibiting NADPH oxidase activation. Biochemical Pharmacology. 2012;84(12):1635–1642. doi: 10.1016/j.bcp.2012.09.011. [DOI] [PubMed] [Google Scholar]
- 36.Frojmovic M., Wong T. Dynamic measurements of the platelet membrane glycoprotein IIb-IIIa receptor for fibrinogen by flow cytometry. II. Platelet size-dependent subpopulations. Biophysical Journal. 1991;59(4):828–837. doi: 10.1016/S0006-3495(91)82295-0. [DOI] [PMC free article] [PubMed] [Google Scholar]
- 37.Won D. I., Yang D. H., Kim D. H., Chae S. C., Suh J. S. Flow cytometric assessment of platelet aspirin resistance using light scattering. Cytometry Part B: Clinical Cytometry. 2008;74B(2):110–117. doi: 10.1002/cyto.b.20377. [DOI] [PubMed] [Google Scholar]
- 38.Franzini L., Ardigò D., Valtueña S., et al. Food selection based on high total antioxidant capacity improves endothelial function in a low cardiovascular risk population. Nutrition, Metabolism, and Cardiovascular Diseases. 2012;22(1):50–57. doi: 10.1016/j.numecd.2010.04.001. [DOI] [PubMed] [Google Scholar]
- 39.Valtueña S., Pellegrini N., Franzini L., et al. Food selection based on total antioxidant capacity can modify antioxidant intake, systemic inflammation, and liver function without altering markers of oxidative stress. The American Journal of Clinical Nutrition. 2008;87(5):1290–1297. doi: 10.1093/ajcn/87.5.1290. [DOI] [PubMed] [Google Scholar]
- 40.McCall D. O., McGartland C. P., McKinley M. C., et al. The effect of increased dietary fruit and vegetable consumption on endothelial activation, inflammation and oxidative stress in hypertensive volunteers. Nutrition, Metabolism and Cardiovascular Diseases. 2011;21(9):658–664. doi: 10.1016/j.numecd.2010.01.009. [DOI] [PubMed] [Google Scholar]
- 41.Thies F., Masson L. F., Rudd A., et al. Effect of a tomato-rich diet on markers of cardiovascular disease risk in moderately overweight, disease-free, middle-aged adults: a randomized controlled trial. The American Journal of Clinical Nutrition. 2012;95(5):1013–1022. doi: 10.3945/ajcn.111.026286. [DOI] [PubMed] [Google Scholar]
- 42.Crane T. E., Kubota C., West J. L., Kroggel M. A., Wertheim B. C., Thomson C. A. Increasing the vegetable intake dose is associated with a rise in plasma carotenoids without modifying oxidative stress or inflammation in overweight or obese postmenopausal women. The Journal of Nutrition. 2011;141(10):1827–1833. doi: 10.3945/jn.111.139659. [DOI] [PMC free article] [PubMed] [Google Scholar]
- 43.Hosseini B., Berthon B. S., Saedisomeolia A., et al. Effects of fruit and vegetable consumption on inflammatory biomarkers and immune cell populations: a systematic literature review and meta-analysis. The American Journal of Clinical Nutrition. 2018;(article nqy082) doi: 10.1093/ajcn/nqy082. [DOI] [PubMed] [Google Scholar]
- 44.Nielsen M. M., Witherden D. A., Havran W. L. γδ T cells in homeostasis and host defence of epithelial barrier tissues. Nature Reviews Immunology. 2017;17(12):733–745. doi: 10.1038/nri.2017.101. [DOI] [PMC free article] [PubMed] [Google Scholar]
- 45.Vamanu E., Pelinescu D., Sarbu I. Comparative fingerprinting of the human microbiota in diabetes and cardiovascular disease. Journal of Medicinal Food. 2016;19(12):1188–1195. doi: 10.1089/jmf.2016.0085. [DOI] [PubMed] [Google Scholar]
Associated Data
This section collects any data citations, data availability statements, or supplementary materials included in this article.
Data Availability Statement
The data used to support the findings of this study are restricted by the San Raffaele Ethics Committee in order to protect patient privacy. Data are available from Mauro Serafini for researchers who meet the criteria for access to confidential data.