Abstract
Mutations in PIK3CA, encoding the insulin-activated phosphoinositide-3-kinase (PI3K), and loss of function mutations in PTEN, a phosphatase that degrades the phosphoinositide lipids generated by PI3K, are among the most frequent events in human cancers1,2. Yet, pharmacological inhibition of PI3K has resulted in variable clinical responses, raising the possibility of an inherent mechanism of resistance. Since the PIK3CA-encoded enzyme, p110α, mediates virtually all cellular responses to insulin, targeted inhibition of this enzyme disrupts glucose metabolism in multiple tissue types. For example, blocking insulin signaling promotes glycogen breakdown in the liver and prevents glucose uptake in the skeletal muscle and adipose tissue, resulting in transient hyperglycemia that occurs within a few hours of PI3K inhibition. The effect is usually transient because compensatory insulin release from the pancreas (i.e. insulin feedback) restores normal glucose homeostasis3. However, the hyperglycemia may be exacerbated or prolonged in patients with any degree of insulin resistance and, in these cases, requires discontinuation of therapy3–6. We hypothesized that insulin feedback induced by PI3K inhibitors may be reactivating the PI3K-mTOR signaling axis in tumors, compromising their effectiveness7,8. Here, we show in several model tumors, that systemic glucose-insulin feedback caused by targeted inhibition of this pathway is sufficient to activate PI3K signaling, even in the presence of PI3K inhibitors. We demonstrate that this insulin feedback can be prevented using dietary or pharmaceutical approaches, which greatly enhance the efficacy/toxicity ratios of these compounds. These findings have direct clinical implications for the multiple p110α inhibitors that are in clinical trials and provide a means to significantly increase treatment efficacy for patients with a myriad of tumor types.
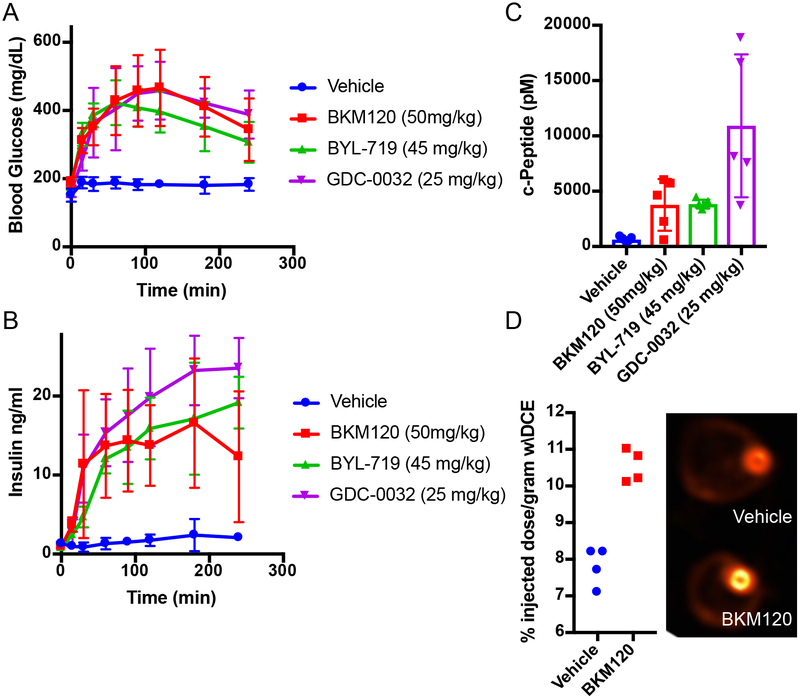
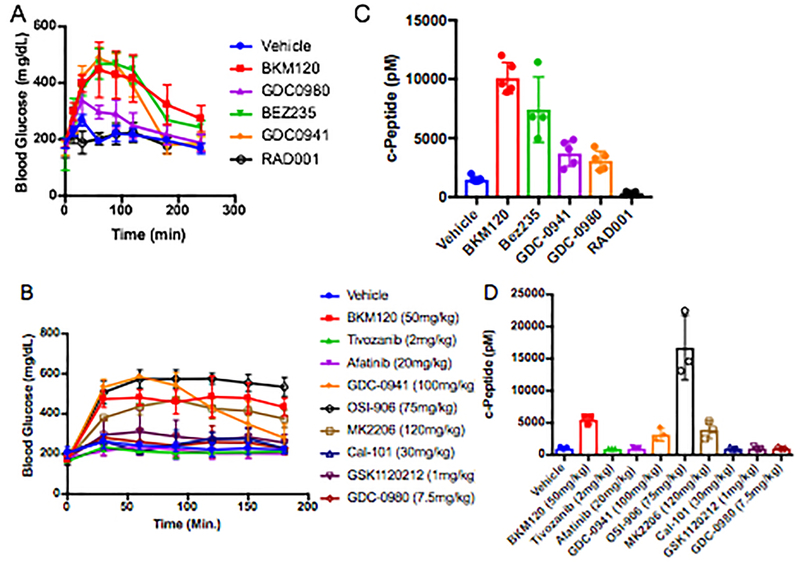
The relationship between PI3K inhibitors and the disruption of systemic glucose homeostasis has been evident from the beginning of their use in clinical trials3. However, hyperglycemia has largely been treated as a treatment-related complication that requires management in only a subset of patients for whom the hyperglycemia becomes persistent. Due to the body’s normal glycemic regulation, patients treated with these agents experience some degree of systemic hyperinsulinemia as the pancreas attempts to normalize serum glucose levels. Since insulin is a potent stimulator of PI3K signaling in tumors and can have profound effects on cancer progression9–11, we hypothesized that the treatment-induced hyperinsulinemia may be limiting the therapeutic potential of agents targeting the PI3K pathway. To test this theory, we treated wild-type mice with therapeutic doses of compounds targeting a variety of kinases in the insulin receptor/PI3K/mTOR pathway, including inhibitors of INSR/IGFR, PI3K, AKT, and mTOR, and monitored their blood glucose levels over time after treatment (Figure 1A, Extended Figure 1A,B). As expected, we observed that many of these agents cause significant increases in blood glucose levels. Importantly, we noticed that the hyperglycemia resolved after only a few hours without additional intervention, suggesting that PI3K signaling had been reactivated in muscle and liver despite the presence of the drug. For each of the agents that caused an increase in blood glucose, there was also an increase in the amount of insulin released in the serum as measured by ELISAs for insulin over time (Figure 1B) and c-peptide, which is clinically used as a surrogate for insulin over time (Figure 1C, Extended Figure 1C,D)12–14. To assess if these PI3K inhibitor-induced spikes in glucose and insulin were affecting tumors, we performed FDG-PET on mice bearing orthotopic Kras-Tp53-Pdx-Cre (KPC) tumor allografts in the pancreas15. We observed an increase in glucose uptake in these tumors in the acute setting after PI3K inhibition as compared to vehicle treated mice, indicating that the spikes in insulin could be causing transient increases in glucose uptake in these tumors (Figure 1D).
Figure 1: Treatment with PI3K inhibitors causes systemic feedback resulting in increases in blood glucose and insulin.
(A) Mean Blood glucose and (B) insulin levels with standard deviation in mice treated with the indicated PI3K inhibitor compounds (N=5/arm, p-value <0.0001 by Two-Way ANOVA for all curves as compared to vehicle). (C) Mean with standard deviation of c-Peptide levels assessed at 240 min (p-values comparing vehicle treatment to BKM120, BYL-719, and GDC-0032 by two sided t-test were 0.017, <0.0001, and 0.007 respectively). (D) Mean percent of FDG-PET signal with standard deviation of orthotopically implanted KPC tumors imaged 90 minutes after a single treatment with BKM120 (N=4/arm, p-value =0.0002, by two sided t-test).
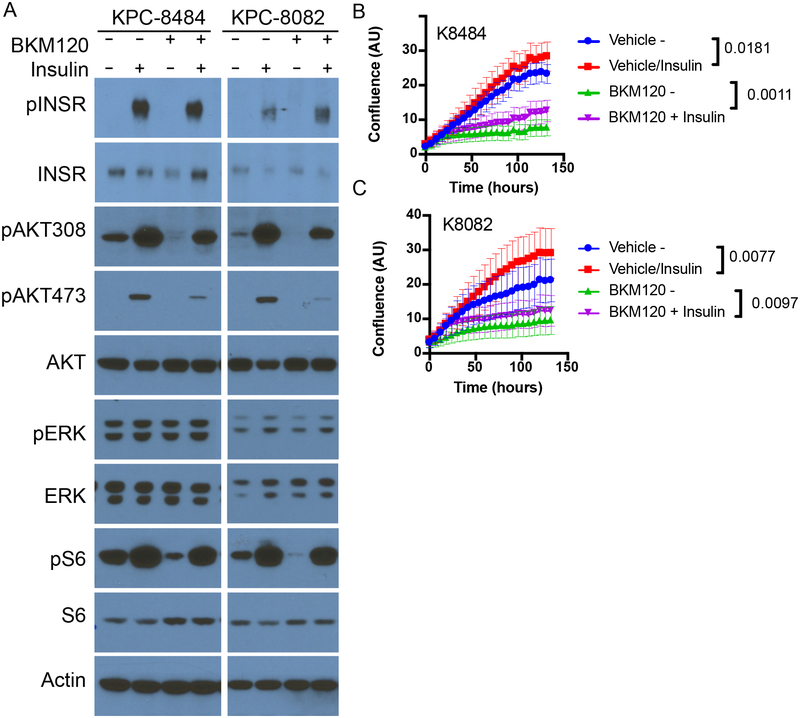
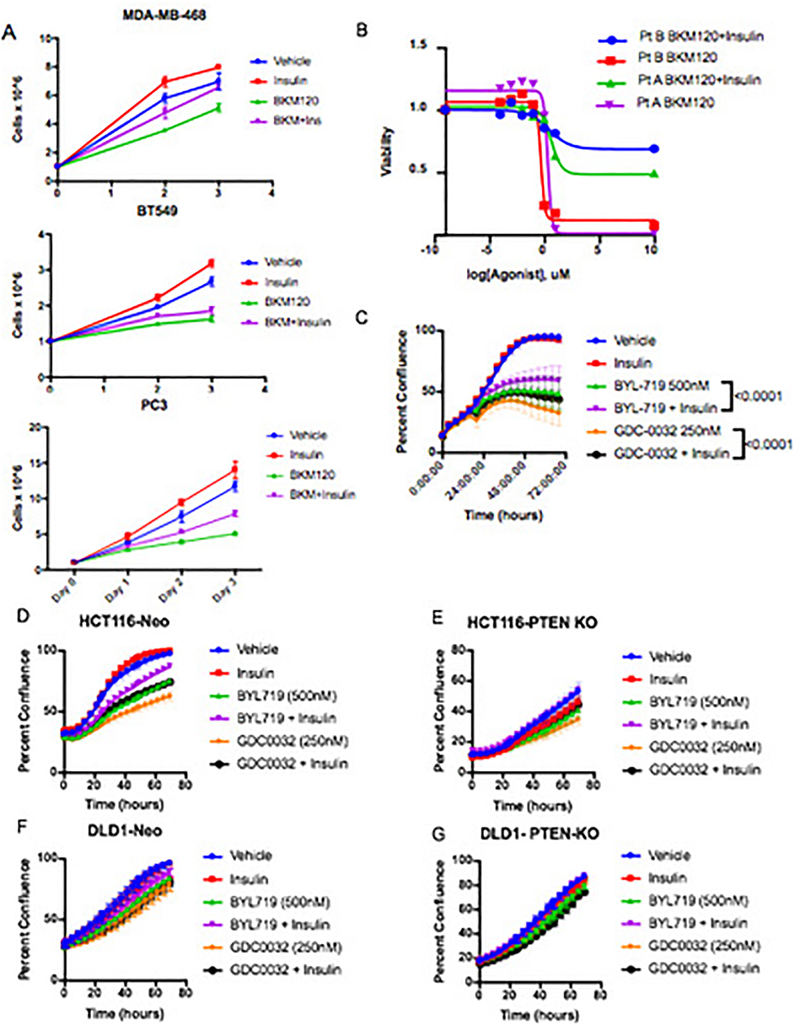
To test whether or not these spikes in insulin were stimulating PI3K signaling in the context of PI3K inhibition, KPC cells were treated in vitro with the PI3K inhibitors in the presence or absence of 10 ng/ml insulin, the level observed in the mice within 15–30 min after drug administration (see Fig. 1D). This level of insulin was sufficient to partially rescue PI3K signaling in the continued presence of PI3K inhibitors as indicated by partial re-activation of phosphorylated AKT (pAKT) and almost complete reactivation of phosphorylated S6 (pS6), a reporter of growth signaling through the mTORC1 complex (Figure 2A, Supplementary Figure 1). In addition, this enhanced signaling correlated with a partial recovery of cellular proliferation (Figure 2B–C). Similar effects of insulin stimulating proliferation in the presence of a PI3K inhibitor were observed in a variety of other tumor cell lines and patient derived organoids (Extended Figure 2A–G)16. The amount of stimulation was not uniform across all cell lines, as would be expected in tumors with variable expression of the insulin receptor and differential dependence on PI3K signaling for growth. These observations support the conclusions that insulin is a potent activator of PI3K signaling in certain tumors, and that elevation of serum insulin following PI3K inhibitor administration can reactivate PI3K signaling and potentially other PI3K-independent responses to insulin in both normal tissues and tumors.
Figure 2: Impact of feedback levels of insulin on cellular proliferation, signaling and survival.
(A) Western blot analysis of KPC cell lines K8484 and K8082 treated with or without PI3K inhibitor BKM120 (1uM) in the presence or absence of physiologic feedback levels of insulin (10ng/ml). Similar results were observed in three independent experiments. (B-C) Mean confluence with standard deviation of KPC cell lines K8484 and K8082 over time grown in the presence or absence of insulin (10ng/ml) and BKM120 (1uM). p-values determined by ANOVA comparing conditions +/− insulin are shown, N=16 biologically independent samples per group.
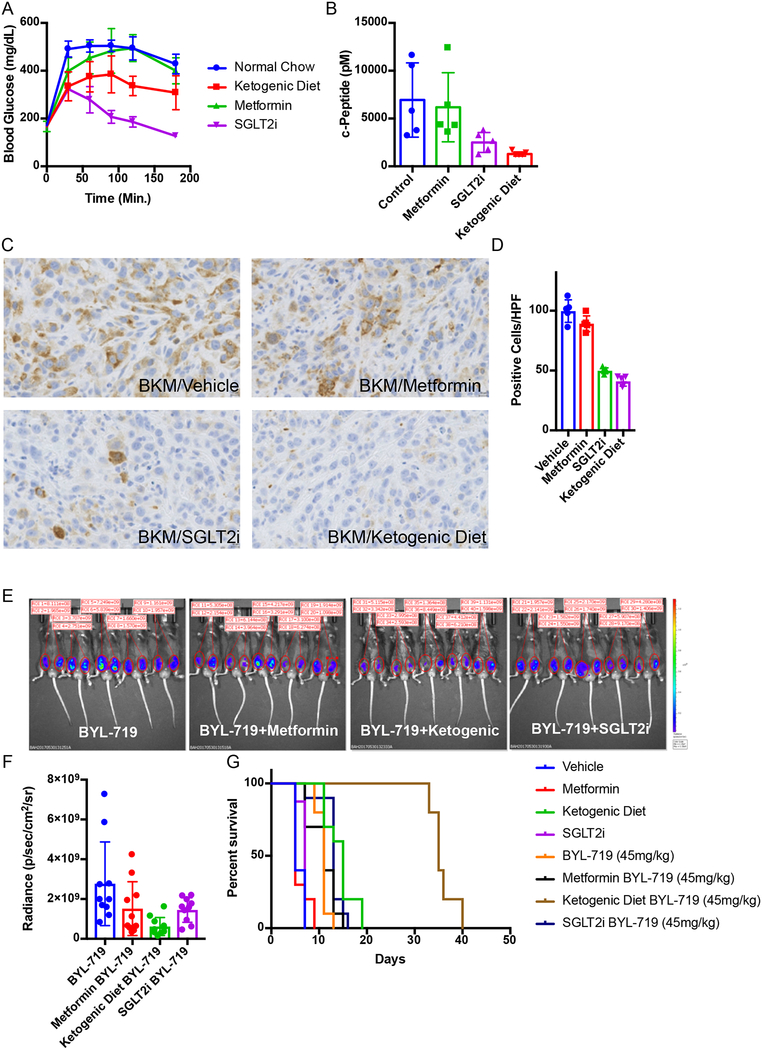
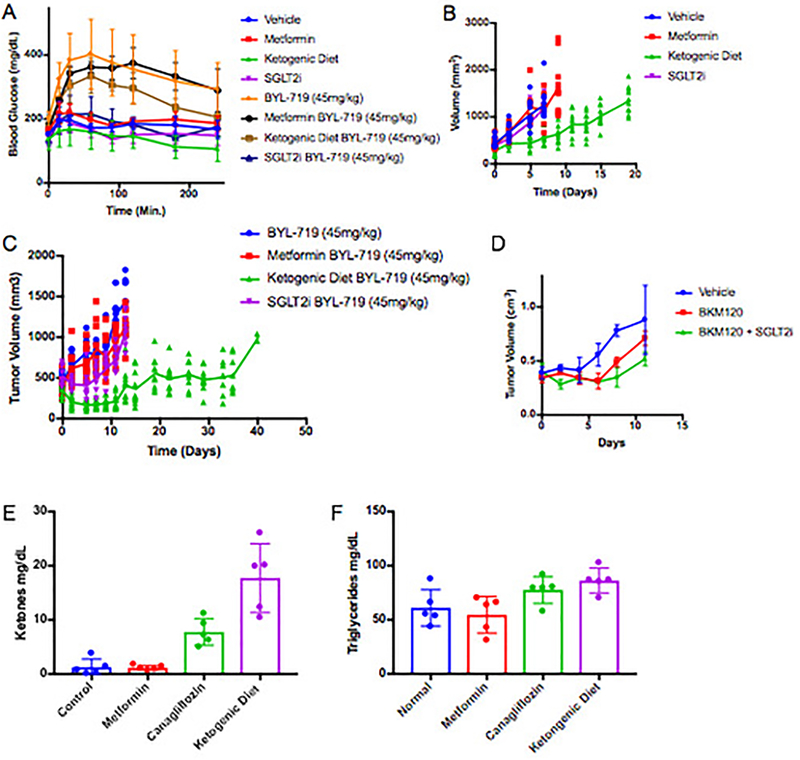
Research and care for diabetic patients has resulted in the development of numerous approaches to manage blood glucose and insulin levels. Utilizing these tools, we sought to identify approaches to augment PI3K inhibitor therapies by circumventing the acute glucose/insulin feedback. We chose to evaluate metformin and sodium-glucose co-transporter 2 (SGLT2) inhibitors, both of which are extensively used in diabetic patients17–20, as well as a ketogenic diet in our murine models of cancer. Metformin was chosen because it has an extremely low toxicity profile and is commonly used in diabetic/pre-diabetic patients to increase their insulin sensitivity, which reduces hyperglycemia and insulin levels20. Metformin is also commonly used in PI3K inhibitor trials to manage patients who become chronically hyperglycemic21–23. SGLT2 inhibitors are also generally well tolerated and work by inhibiting the glucose transporters that are responsible for the reabsorption of glucose in the kidney. The rationale for using a ketogenic diet was to deplete hepatic glycogen stores and thereby limit the acute release of glucose from the liver that occurs following PI3K inhibition. Ketogenic diets have been used in epileptic patients since the 1970s and have been shown to reduce blood glucose levels and increase insulin sensitivity as compared to normal western diets7,24. To test if these approaches could limit the acute glucose/insulin feedback and impact signaling in tumors, treatment-naïve mice bearing KPC allografts were placed on a ketogenic diet, or treated with metformin for 10 days prior to a single treatment with BKM120. During this treatment, blood glucose was monitored and, after 3 hours, c-peptide (a surrogate for blood insulin) was evaluated (Figure 3 A–B). In some mice, tumors were harvested at 90 minutes and stained for pS6, a reporter of mTORC1 activity (Figure 3C–D). These results demonstrated that pretreatment with metformin had only minimal impact on the PI3K inhibitor-induced elevation in blood glucose and insulin levels or on growth signaling through mTORC1. In contrast, both the SGLT2 inhibitor and the ketogenic diet decreased the hyperglycemia and reduced the total insulin that was released in response to BKM120 treatment, and these effects correlated with reduced signaling through mTORC1 in the tumor. Similar effects were seen in mice treated with the p110α specific inhibitor BYL-719 where we observed an enhanced response of KPC allografts to BYL-719 in a manner concordant with the relative ability of each treatment to reduce serum insulin levels (Figure 3E–G, Extended Figure 3A–D).
Figure 3: Targeting the PI3K inhibitor induced glucose/insulin feedback in vivo.
(A) Mean Blood glucose levels with standard deviation over time of wildtype c57/bl6 mice baring syngeneic K8484 KPC allografted tumors after treatment with a single dose of BKM120 in mice pretreated with metformin, SGLT2-inhibitor (SGLT2i), or a ketogenic diet (N = 5 mice). p-values calculated by Two-way repeated measures ANOVA for metformin, SGLT2i, and the ketogenic diet were 0.2136 (not significant), <0.0001, and 0.007 respectively. (B) Mean Blood levels of c-peptide with standard deviation of the same mice (N=5) taken 180 minutes after treatment with BKM120. p-values calculated by unpaired two sided t-test for metformin, SGLT2i, and ketogenic diet were 0.7566 (not significant), 0.0386, and 0.0117 respectively. (C) Immunohistochemical images for pS6 (ser-235) to observe the level of active PI3K signaling in these tumors. (D) Quantification of this staining is shown as mean number of positive cells per high power field with standard deviation (N = 5 mice/group). p-values comparing pS6 positive cells in BKM120 alone treated tumors as compared to those treated with BKM120 in combination with metformin, SGLT2i, or the ketogenic diet using two sided t-tests were 0.6186, <0.0001, and <0.0001 respectively. (E) IVIS images of luciferase reporter luminescence in mice with KPC K8484 tumors after 12 days of treatment with PI3Kα specific inhibitor BYL-719 alone or in combination with metformin, ketogenic diet, or SGLT2i (N=10 tumors/arm). (F) Mean values and standard deviation of quantification of luminescence from images in of these tumors. (G) Survival analysis of these animals, p-value = 0.0019 and 0.0001 respectively as determined by Log-rank (Mantel-Cox) test.
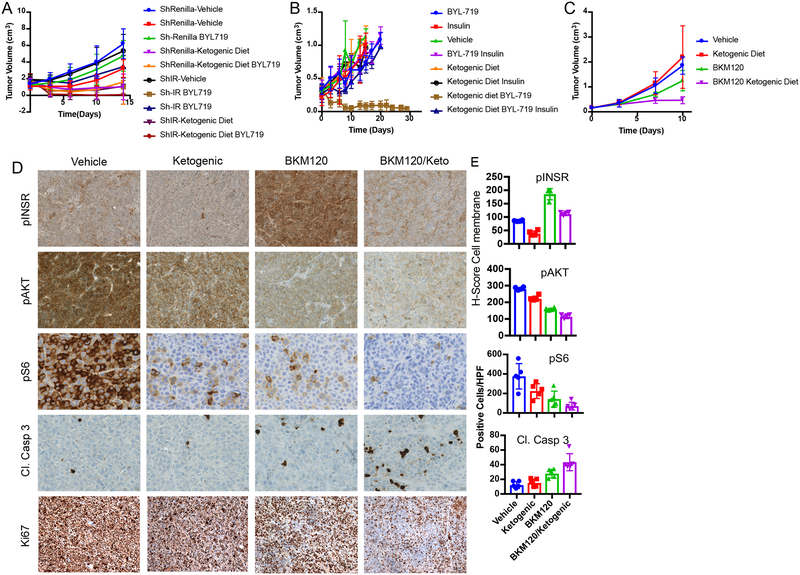
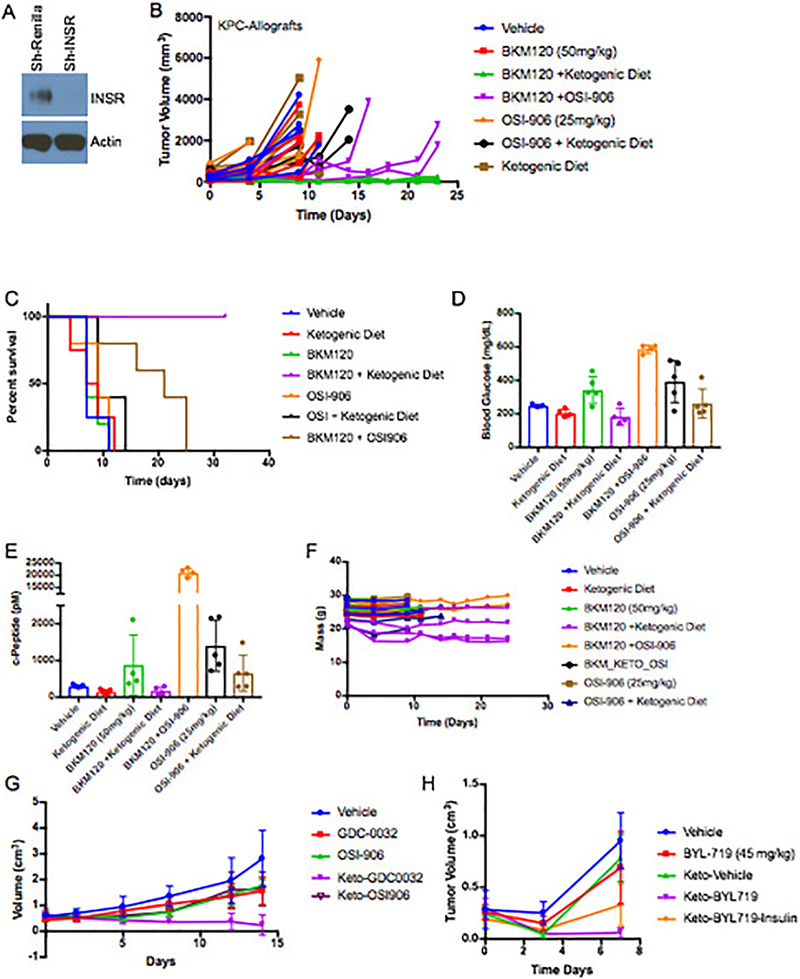
Various hormones and metabolites have the ability to reactivate growth in the setting of PI3K inhibition. To test if the enhancement in tumor signaling and growth is directly mediated by insulin, we generated a doxycycline-inducible shRNA to target the insulin receptor in KPC tumors (Extended Figure 4A, Supplementary Figure 2). Induction of this hairpin in the absence of a PI3K inhibitor had little effect on tumor growth. However, induction of the hairpin at the time of BYL719 treatment initiation resulted in tumor shrinkage that was almost as effective as the ketogenic diet (Figure 4A). This result supports a model in which the insulin receptor is not playing a major role in the growth of this tumor until supra-physiologic amounts of insulin are released following treatment with a PI3K inhibitor. The specificity of this effect was further corroborated by combining the PI3K inhibitor, BKM120, with the insulin receptor/IGF1 receptor inhibitor, OSI-906, which resulted in a more effective response on the growth of KPC allografts than either drug alone (Extended Figure 4B–G). Notably, adding a ketogenic diet to mice bearing tumors with insulin receptor knockdown (Figure 4A) or to mice treated with OSI-906 (Extended Figure 4B) in the absence of a PI3K inhibitor provided very little or no enhancement of therapeutic response.
Figure 4: Impact of circumventing the on target glucose/insulin feedback of PI3K inhibitors upon tumor growth.
(A) Graph of mean tumor volumes with standard deviation of K8484 KPC with doxycycline inducible hairpins targeting Renilla (ShRenilla) or Insulin Receptor (ShIR), treated with doxycycline and as indicated with the PI3K inhibitor BYL-719 and/or co-administration of a ketogenic diet (N=8, 9, 8, 10, for shRenilla tumors treated with vehicle, BYL719, Ketogenic diet, and BYL + Ketogenic diet respectively, and N= 8,8,10,8 for shIR tumors treated with vehicle, BYL719, Ketogenic diet, and BYL + Ketogenic diet respectively. (B) Graph of mean ES272 Pik3ca mutant breast cancer allograft tumor volumes with standard deviation treated with BYL-719 and/or insulin along with the ketogenic (keto) as indicated. N=3,3,5,5,5,3,4,4 for Vehicle, Insuln, BYL, BYL+Insulin, Ketogeinic Diet, Ketogenic+Insulin, Ketogenic+BYL, and Ketogenic+BYL+Insulin respectively. (C) Graph of mean tumor volume with standard deviation of patient derived endometrial xenografts (PDX) treated with BKM120 and/or a ketogenic diet (N=5/arm, (p-value = 0.0028 by ANOVA comparison between the BKM120 alone and BKM120 plus ketogenic diet treated mice). (D-E) Histology and quantification of phospho-Insulin Receptor (pINSR), phospho-AKT (pAKT), phospho-S6 (pS6), cleaved caspase 3 (Cl. Casp 3), and ki67 of the tumors from D taken 4 hours after the last treatment with Vehicle, ketogenic diet, BKM120, or the combination of the ketogenic diet with BKM120 (BKM120/Keto). Quantification is depicted as score per high powered field, 4 images were taken for each of the five mice N=5. p-values from two sided t-tests comparing the blinded scoring in BKM120 treated tumors as compared to those treated with BKM120 with the ketogenic diet were 0.005, 0.005, 0.017 and 0.028 and for pINSR, pAKT, pS6 and Cl. Casp 3 respectively.
To further test whether the improved response to PI3K inhibitors while on a ketogenic diet is a consequence of lowering blood insulin levels, we attempted to “rescue” the PI3K reactivation using exogenous insulin. A cohort of the mice bearing Pik3ca mutant breast allografts were treated with the combination of a ketogenic diet and BYL-719, and then given 0.4mU of insulin 15 minutes after each dose of PI3K inhibitor (Figure 4B). The addition of insulin dramatically reduced the therapeutic benefit of supplementing PI3K inhibitor therapy with a ketogenic diet, the addition of insulin also rescued tumor growth in allografted KPC tumors (Extended Figure 4H). It should be noted that the combination of the ketogenic diet, insulin, and BYL-719 was not well-tolerated in young mice so that ethical endpoints were reached in this cohort. Together these data strongly support the model that a ketogenic diet improves responses to PI3K inhibitors by reducing blood insulin and the consequent ability of insulin to activate the insulin receptor in tumors.
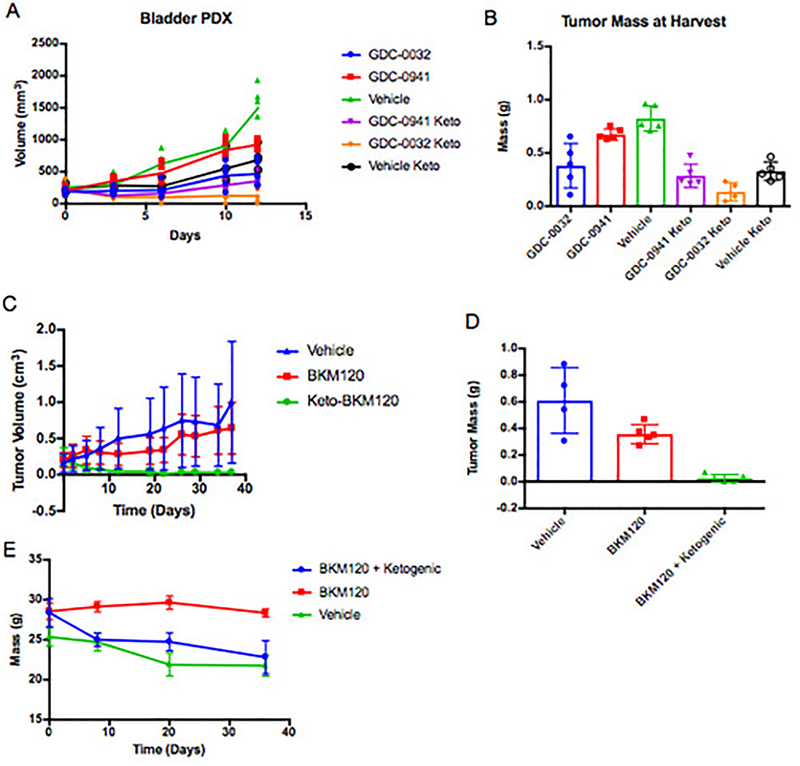
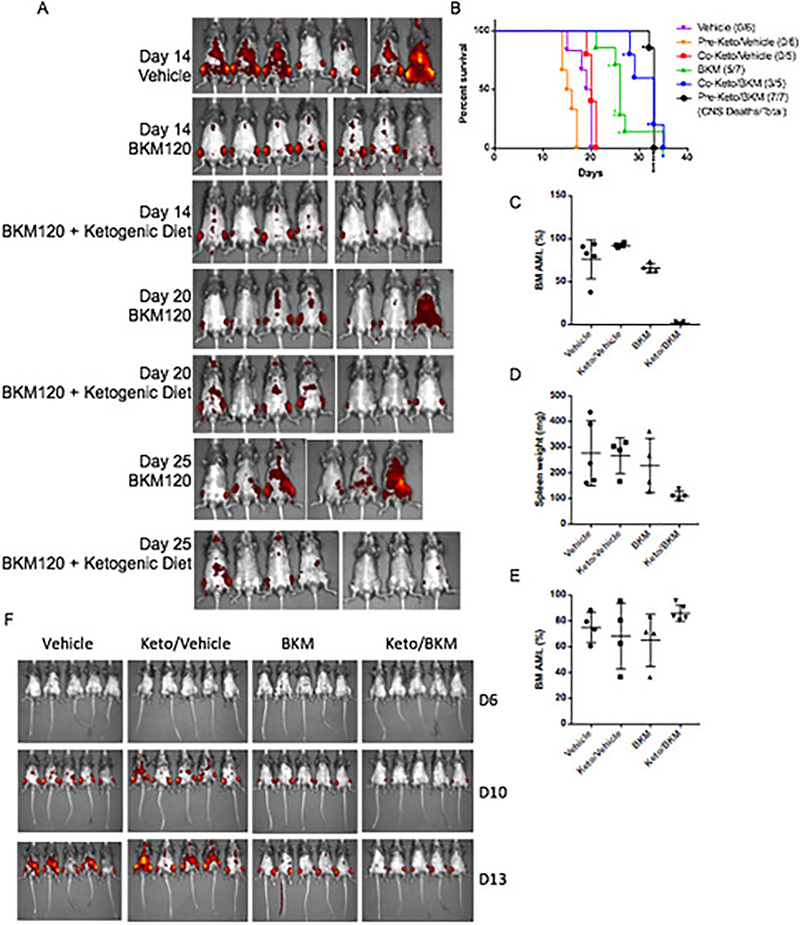
In this study, we evaluated the ability of a ketogenic diet to improve responses to PI3K inhibitors in tumors with a wide range of genetic aberrations. Therapeutic benefit was observed in patient-derived xenograft models of advanced endometrial adenocarcinoma (harboring a PTEN deletion and PIK3CA mutation) and bladder cancer (FGFR-Amplified) as well as syngeneic allograft models of Pik3ca mutant breast cancer and MLL-AF9 driven Acute Myeloid Leukemia (AML) (Figure 4C, Extended Figures 5–7).
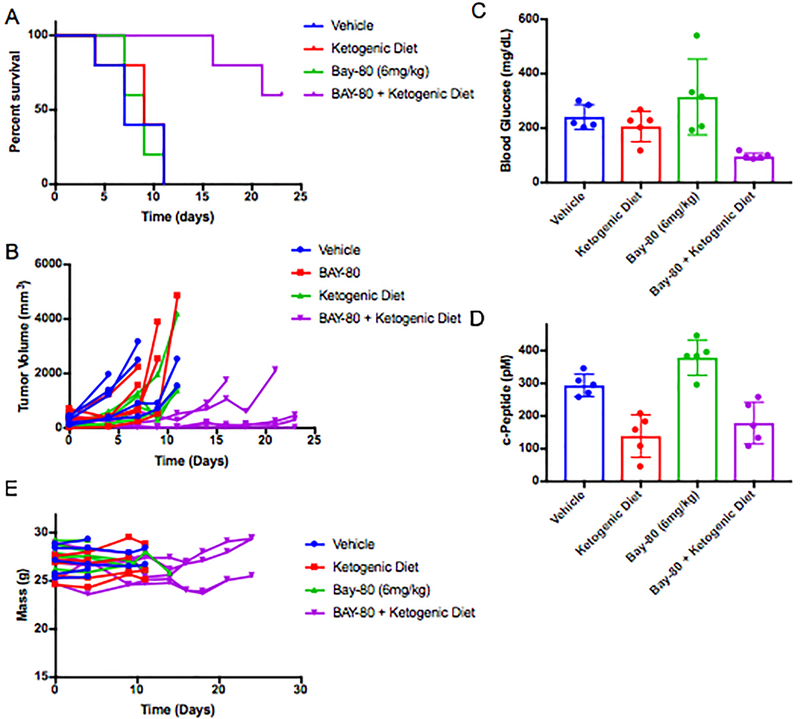
The addition of the ketogenic diet improved drug efficacy with an array of agents that target the PI3K pathway in addition to BKM120 and BYL719, including the pan PI3K inhibitor GDC-0941, the PI3K-β sparing compound GDC-0032, the mTOR/PI3K dual inhibitor GDC-0980, and the recently approved PI3K-α/δ inhibitor Copanlisib (Extended Figure 5). It is important to note that treatment with the ketogenic diet alone had variable effects in different tumor models indicating that the dietary changes themselves were insufficient to cause the tumor responses observed across the murine models. In some instances, such as the AML model, the ketogenic diet alone accelerated disease progression suggesting that this diet may be detrimental for some cancer patients when used in isolation.
Our data suggests that insulin feedback is limiting the efficacy of PI3K inhibition in several tumor models. By reducing the systemic insulin response, the addition of the ketogenic diet to BKM120 reduced immunohistochemical markers of insulin signaling compared to tumors from mice treated with BKM120 alone in PTEN/PIK3CA mutant endometrial PDX tumors. In these tumors, the ketogenic diet enhanced the ability of BKM120 to reduce levels of phosphorylated insulin receptor, phosphorylated AKT and phosphorylated S6 and this reduction in signaling correlated with decreased levels of proliferation as shown by Ki67 staining, and increased levels of apoptosis as indicated by cleaved caspase 3 staining (Figure 4D–E).
While these data do not exclude insulin-independent effects of combining PI3K inhibition with anti-glycemic therapy, they demonstrate that utilizing this approach has the potential to significantly increase the therapeutic efficacy of these compounds. In light of these results, it may also be important to think about how common clinical practices such as IV glucose administration, glucocorticoid use, or providing patients with glucose-laden nutritional supplements may impact therapeutic responses. As therapeutic agents that target this critical oncogenic pathway are brought through clinical trials, they should be paired with strategies such as SGLT2 inhibition or the ketogenic diet to limit this self-defeating systemic feedback.
Methods:
Mice procurement and treatment:
All animal studies were conducted following IACUC approved animal protocols (#2013–0116) at Weill Cornell Medicine and (AC-AAAQ5405) at Columbia University. Ethical requirements for the treatment of animals was followed for all of the animal studies as per institutional guidelines. Mice were maintained in temperature- and humidity-controlled specific pathogen-free conditions on a 12-hour light/dark cycle and received a normal chow diet (PicoLab Rodent 20 5053 lab Diet St. Louis, MO) or ketogenic diet (Thermo-Fisher AIN-76A) with free access to drinking water. Diets were composed as indicated in Supplemental table 1.
For solid tumor studies Nude (genotype) and C57/BL6 mice were purchased at 8 weeks of age from Jackson laboratories (Bar Harbor, ME). They were injected with 0.5–1 × 10⁶ cells in a 1:1 mix of growth media and matrigel (Trevigen, # 3433–005-R1) and tumors were allowed to grow to a minimum diameter of 0.6cm prior to the initiation of treatment. Tumors that did not meet this criteria at the time of treatment initiation were not utilized for experimentation.
For AML studies 10–12 weeks old male C57BL/6J mice were used for MLL-AF9 Ds-Red AML study (Approved protocol AC-AAAQ5405). For pre-treatment study with MLL-AF9 Ds-Red cells, keto and Keto/BKM group mice were given a ketogenic diet for 10 days prior to injection with MLL-AF9 Ds-Red cells (2×10⁵ per mouse in 200 ul) via lateral tail vein. The day after iv injection, the mice were given 0.5% carboxymethyl cellulose (CMC) as vehicle control or BKM120 (37.5 mg/kg) by oral gavage for two weeks (5 out of 7 days). The mice were euthanized after two-week treatment to check the bone marrow for AML progress. The mice were euthanized and one femur and tibia were removed from each mouse. The bone marrow cells were flushed with PBS (2% FBS). The red blood cells were lysed with ACK lysis buffer (Invitrogen). DAPI was used to exclude dead cells. The DS-red AML cells from the BM were analyzed with BD LSRII. The tumor progress was also monitored via IVIS spectrum machine. For co-current treatment study with MLL-AF9 Ds-Red cells, the mice were injected with MLL-AF9 Ds-Red cells (2×10⁵ per mouse in 200 ul) via lateral tail vein. The day after iv injection, the mice were given vehicle or BKM120 (37.5 mg/kg) by oral gavage for two weeks. The Keto or Keto/BKM group were changed to a ketogenic diet on the same day. The mice were euthanized after two-week treatment to check the bone marrow for AML progress.
To check if Keto/BKM treatment affects the AML engraftment, Keto and Keto/BKM group mice were given a ketogenic diet for 10 days, then treated with vehicle or BKM120 by oral gavage for two weeks. The mice were then injected with MLL-AF9 Ds-Red cells (2×10⁵ per mouse in 200 ul) vial lateral tail vein. Two weeks after the iv injection, the mice were euthanized to check the bone marrow for AML burden.
The survival study, pre-treatment study, and co-current treatment were conducted at the same time. The mice were treated with vehicle or BKM120 (5 out of 7 days) until spontaneous death, or mice were euthanized when they appeared to be very sick (reduced spontaneous activity, unkempt coat, and dehydrated appearance), achieved body weight loss over 20%, or demonstrated signs of limb paralysis.
Compounds:
GDC-0032, MK2206, BEZ235, BKM-120, GDC-0941, GDC-0980, and Canagliflozin were all procured from medchem express (Monmouth Junction, NJ) and given via oral gavage in 100ul. Metformin was procured from Sigma Aldrich (St. Louis, MO). Bay-80 6946 and OSI-906 came from Sellechem catalogue #S2802 and #S1091 respectively. The targeting information for these compounds is displayed in Supplemental Table 3. IC50 data was obtained from the Selleckchem website (Selleckchem.com). The canagliflozin was administered 60 minutes before the PI3K pathway inhibitors so that its optimal efficacy lined up with the peak glucose levels. Mice treated with metformin were pretreated for 10 days prior to BKM120 treatment. ketogenic diet was initiated at the time of initial PI3K inhibitor treatment unless otherwise stated. Doxycycline was procured from Sigma (St. Louis, Missouri) catalogue number D3072–1ML and administered via intraperitoneal injection once daily at a dose of 3mg/kg.
Culture:
Murine pancreas cell lines were kindly gifted by Dr. Kenneth Olive, Columbia University15. Murine breast lines were kindly gifted by Dr. Ramon Parsons, Mount Sinai School of Medicine. PDX Models were derived by the Englander Institute of Precision Medicine in accordance with an IRB approved protocol as described in16,26. Cell lines HEK293, HCC-38, MDA-MB-468, PC-3, BT-549 were purchased from ATCC and grown in DMEM supplemented with 10% FBS and 1% Pen/Strep. HCT-116 and DLD-1 isogenic lines with and without PTEN deletion were kindly provided by the Laboratory of Todd Waldman27. A chart of cells/organoids is in supplemental table 2, with known oncogenic alterations as described in publications cited above or as available from the ATCC (https://www.atcc.org/~/media/PDFs/Culture%20Guides/Cell_Lines_by_Gene_Mutation.ashx).
For signaling assays, cells were washed 1x in PBS and placed in starvation media (-FBS) for 6–18 hours depending upon cell line, and treated 1 hour prior to harvesting with PI3K inhibitors as indicated alone or in combination with insulin 10 minutes prior to harvesting. Three dimensional culture and dose response experiments of patient derived organoids were run as previously described16. In brief, ~1000 cells were plated in 10ul of 1:1 matrigel to culture media in 96 well angiogenesis plates and allowed to solidify for 30 min at 37 degrees before 70ul of culture media was added. Organoids were then treated in triplicate in a log scale dose response and CellTiter-Glo assay (Promega) was run at 96 hours to determine the IC50 values.
Knockdown of insulin receptor was achieved using a doxycycline inducible shRNA strategy. For generation of miR-E shRNAs, 97-mer oligonucleotides were purchased (IDT Ultramers) coding for predicted shRNAs using an siRNA predictional tool Splash RNA, http://splashrna.mskcc.org/28. Oligonucleotides were PCR amplified using the primers miRE-Xho-fw (5’-TGAACTCGAGAAGGTATATTGCTGTTGACAGTGAGCG-3’) and miRE-Eco-rev (5’-TGAACTCGAGAAGGTATATTGCTGTTGACAGTGAGCG-3’). PCR products were purified and both PCR product and LT3GEPIR29 vectors were double digested with EcoRI-HF and XhoHI. PCR product and vector backbone were ligated and transformed in Stbl3 competent cells and grown at 32° overnight. Colonies were screened using the primer miRE-fwd (5’- TGTTTGAATGAGGCTTCAGTAC-3’).
Renilla-TGCTGTTGACAGTGAGCGCAGGAATTATAATGCTTATCTATAGTGAAGCCACAGAT
GTATAGATAAGCATTATAATTCCTATGCCTACTGCCTCGGA
INSR4-TGCTGTTGACAGTGAGCGCGGGGTTCATGCTGTTCTACAATAGTGAAGCCACAGATGTATTGTAGAACAGCATGAACCCCATGCCTACTGCCTCGGA
Immunoblotting:
Cell lysates were prepared in 1x CST Cell Lysis Buffer #9803, (Danvers MA). Total protein concentration was evaluated with the BCA kit (Pierce) 23227). The lysates were run out on 4–20% Tris-Glycine Gels (ThermoFisher, Carlsbad CA). Primary antibodies against pAKT473, pAKT308, pS6, pTYR, AKT, and S6 were procured from Cell Signaling (Danvers, MA), and were used overnight 1:1000 in 5% bovine serum albumin. Actin and tubulin antibodies came from Sigma Aldrich and were used at 1:5,000 in 5% Milk. All these antibodies were visualized with HRP conjugated secondary antibodies from Jackson Immuno at 1:5000 in 5% milk.
Immunohistochemistry:
Tumor sections (3 μm) were antigen retrieved with 10 mmol/L citrate acid, 0.05% Tween 20, pH6.0, and incubated with antibodies as indicated (Ki67 (Abcam, ab16667) 1:500; cleaved caspase-3 (Asp175; 5A1E; Cell Signaling Technology, 9664) 1:200; phospho-INSR (Tyr 1162; Thermo Fisher #AHR0271) 1:100; phospho-AKT (Ser473; Cell Signaling Technology, 8101) 1:20; and phospho-S6 ribosomal protein (Ser235/236; Cell Signaling Technology, 2211) 1:300).
Blood Measurements:
For assessment of blood glucose 10ul of blood was taken from the tail of mice prior to treatment (time 0) and then again at the indicated time points (15, 30, 60, 90, 120,180 minutes) using a OneTouch Ultra Glucometer. At end point >100ul of blood was drawn from the mice into EDTA tubes (Sarstedt #16.444). Blood was centrifuged (10,000 × g for 10 min at 4 °C), and plasma was stored at −20 °C. Plasma β-hydroxybutyrate, triglyceride (Stanbio Laboratory, Boerne, TX), Serum Insulin, and c-Peptide (APLCO Diagnostics, Salem, NH) levels were quantified by ELISA.
FDG-PET:
Male c57/bl6 mice (n = 4/arm) bearing orthotopic pancreatic adenocarcinoma allografts were injected with 200–250 μCi [89Zr]liposomes (3–4 μmol lipid) in 200–250 μL PBS solution into the tail vein. At the time of peak blood insulin feedback 90 minutes post BKM120 injection animals were anesthetized and scans were then performed using an Inveon PET/CT scanner (Siemens Healthcare Global). Whole body PET scans were performed recording a minimum of 50 million coincident events, with duration of 10 min. The energy and coincidence timing windows were 350−750 keV and 6 ns. The data was normalized to correct for non-uniformity of response of the PET, dead-time count losses, positron branching ratio, and physical decay to the time of injection. The counting rates in the reconstructed images were converted to activity concentrations (percentage injected dose [%ID] per gram of tissue) by use of a system calibration factor derived from the imaging of a phantom containing 89Zr. Images were analyzed using ASIPro VMTM software (Concorde Micro-systems). Quantification of activity concentration was done by averaging the maximum values in at least 5 ROIs drawn on adjacent slices of the pancreatic tumors.
Extended Data
EF1: Blood Glucose and C-Peptide levels after treatment with agents that target PI3K pathway.
(A-B) Mean values with standard deviation of blood glucose levels over time where time 0 is the time of treatment with the indicated inhibitor, N=5 and 3 per arm for A and B respectively. (C-D) Mean c-peptide levels with standard deviation from mice in A and B taken 240 and 180 minutes after treatment with indicated inhibitors. In C N =5 for the Vehicle, BKM120, GDC-0941, and GDC-0980 arms, N = 4 for the BEZ235 arm, and N = 3 for the RAD001. For D N=3 mice per arm. As a surrogate for total insulin release c-peptide levels in these animals, showing that the PI3K inhibitors and IGFR/INSR inhibitors dramatically increase insulin release in these animals. In all cases compounds that caused acute increases in blood glucose levels also increased serum insulin levels.
EF2: Impact of the feedback levels of insulin observed in figure 1 upon BKM120 efficacy in vitro.
(A) Proliferation in minimal growth media of cells whose growth is partially rescued by the addition of the observed feedback levels of insulin (10ng/ml) induced by BKM120 in mice. N=3 biologically independent samples per arm, graphed as mean number of cells with standard deviation. (B) Cell viability assay demonstrating the effects that these feedback levels of insulin have upon 2 patient (Pt)-derived organoid cultures (A and B) being treated in a dose response with BKM120 as measured by cell titer-glo at 96 hours. N = 3 biologically independent samples per treatment. (C) Proliferation in minimal growth media of murine TNBC cells treated with PI3K inhibitors partially rescued by the addition of the observed feedback levels of insulin induced by BKM120 in mice as observed in figure 1. N =6 biologically independent samples per treatment graphed as mean confluence with standard deviation. (D) Proliferation of HCT116-neo cells and (E) HCT116 PTEN knockout (KO) cells with and without treatment with the physiologically observed levels of insulin (10ng/ml) and treatment with clinically relevant PI3K inhibitors GDC-0032 and BYL-719. N = 4 biologically independent samples per treatment graphed as mean confluence with standard deviation. (F) Proliferation of DLD1-Neo and (G) DLD-1 PTEN Knockout cells under the same treatment conditions as in F and G. Of note, the loss of PTEN in these isogenic sets of colon cancer lines does not uniformly alter the response to insulin in the setting of PI3K inhibition. In the context of PTEN loss, physiologic levels of insulin can restore normal proliferation in HCT116s despite the presence of PI3K inhibitors. N = 4 biologically independent samples per treatment graphed as mean confluence with standard deviation.
EF3: KPC K8484 Allografts treated with PI3K inhibitors with or without supplemental approaches to target systemic insulin feedback.
(A) Mean Blood glucose levels with standard deviation of mice from figure 3E–G treated with control diet, ketogenic diet, metformin (250mg/kg), or canagliflozin (SGLT2i)(6mg/kg), after the first dose of BYL-719 (45mg/kg). N=5 animals per arm. (B)Tumor volumes of the metabolic modifying agents as shown in figure 3 without PI3K inhibitors. N = 10 tumors per arm in Vehicle, Metformin, and Ketogenic Diet Arms, N = 8 tumors per arm in the SGLT2i arm. (C) Mean tumor volume (lines) with scatter (points) for each of these treatment cohorts. N = 10 tumors per arm in BYL-719, BYL-719 + Metformin, and BYL-719 + Ketogenic Diet Arms, N = 9 tumors in the BYL-719 + SGLT2i arm. (D) Mean tumor volumes with standard deviation from an independent experiment of mice (N = 4 mice/arm) treated daily with BKM120 with or without 6mg/kg of Canagliflozin administered 60 minutes prior to the PI3K treatment so that peak SGLT2 inhibition is aligned with peak blood glucose levels post PI3K inhibitor treatment. (E) Blood ketone and (F) Mean triglyceride levels with standard deviation as determined by Calorimetric assay of mice shown in figure 3A–D after a single treatment with BKM120 with or without pretreatment with metformin, Canagliflozin, or the ketogenic diet as indicated, N = 5 mice per arm.
EF4: Role of inhibiting insulin receptor in the observed changes in tumor response.
(A) Western blot of cell lysates from K8484 cells used to generate xenografts in figure 4A after 36 treatment with doxycycline to induce the sh-Renilla and sh-IR hairpins as indicated. Similar results were observed in two independent experiments. (B) Tumor volumes of the individual mice allografted with KPC-K8484 tumors as measured by caliper over time. N = 4,5,4,4,5,5 and 5 for Vehicle, BKM120, BKM120 + Ketogenic Diet, ,BKM120 + OSI-906, OSI-906,OSI-906 + Ketogenic Diet, and Ketogenic diet arms respectively. (C) Survival curve of mice in B. (D)Mean blood glucose and (E) c-peptide levels shown with standard deviation from these mice 240 minutes after respective treatments. * two of the glucose measurements in the OSI-906 and BKM120 were beyond the range of the detector (e.g. >600). (F) The mass of the individual mice over the course of the treatments. As has been previously published mice lose 10–20% of their mass upon initiation of the ketogenic diet25. (G) Similar to the data for the tumors in A treatment efficacy with both OSI-906, a INSR/IGFR inhibitor and GDC-0032 treatment efficacy was significantly improved in PIK3CA + MYC mutant murine breast tumor allografts, ES-278, grown in wild-type c57/bl6 when combined with ketogenic diet. N = 5 tumors per arm. Points depict mean tumor volume with standard deviation. (H) Mean tumor volumes with standard deviation of wildtype c57/bl6 mice baring KPC allografted tumors as measured by caliper over time. Mice were treated as indicated with combinations of BYL-719, the ketogenic diet, or insulin as in figure 4B. Mice in the ketogenic-BYL719-insulin cohort lost >20% of their body mass over the 1 week of treatment so the experiment was terminated at day 7. N = 6,4,4,6,6 for Vehicle, BYL-719, Ketogenic Diet, BYL-719 + Ketogenic Diet, and BYL-719 + Ketogenic Diet + Insulin respectively.
EF5: Impact of PI3K inhibitor treatments upon Patient derived xenograft model of bladder cancer and syngeneic allograft models PIK3CA mutant breast cancer.
(A) Graph of tumor growth over-time of a PDX derived from a patient with bladder cancer (Patient C) treated with the pan PI3K inhibitor GDC-0941 or the β sparing GDC-0032 alone or with a ketogenic diet. Lines indicate mean tumor volume of each treatment group, points indicate individual tumor volumes over time. N= 5 tumors per arm. (B) Graph of the mass of these tumors taken at the time harvest on day 12. (C) Mean tumor growth over time with standard deviation and (D) tumor mass at harvest from mice with orthotopic allografts of an PIK3CA (H1047R) mutant murine breast cancer, ES272, treated as indicated with BKM120 alone or in combination with a ketogenic diet. N = 4,5,5 tumors per arm for the Vehicle, BKM120 and BKM120 + Ketogenic Diet arms respectively. (E) Mean mass with standard deviation of these mice over time.
EF6: Impact of Copanilisib with or without ketogenic diet upon growth of KPC tumor model K8082 grown in the flank of wildtype c57/bl6 mice.
(A) Survival curves for mice with KPC K8082 allografts grown in the flank and treated as indicated with BAY 80–6946 alone and in combination with pretreatment with a ketogenic diet as indicated (p-value comparing BAY 80–6946 to the combination of BAY 80–6946 with ketogenic diet in this study is 0.0019 by Mantel-Cox Log-rank test). N= 5 mice/arm in the Vehicle, Bay 80–6946, and Bay 80–6946 + Ketogenic Diet arms, and N = 4 in the ketogenic diet alone arm. (B) Curves of the volume each tumor in this cohort graphed as individual lines. (C) Mean blood glucose and (D) c-peptide measurements with standard deviation taken from the animals in B-C 240 min after treatment. (F) Graph of the mass of these animals over time on treatment. Tumors were allowed to grow until their diameters were >0.6cm prior to the initiation of treatment.
EF7: Impact of BKM120/Ketogenic combination on a syngeneic model of AML.
(A) IVIS images of AML burden (as reported by DS-red) in these mice from these studies over time. The group of BKM plus keto diet were pre-treated with keto diet. N = 7 mice per arm. (B) Survival curves of mice from A with additional mice to evaluate pre-treatment vs co-treatment with the ketogenic diet in the syngeneic model of AML treated with BKM120 alone or in combination with a ketogenic diet. Individual lines are shown for initiation of ketogenic diet before (pre) or at the same time as the initiation of BKM120 treatment (Co), both demonstrate that BKM120 efficacy is significantly enhanced by the addition of the ketogenic diet (p = 0.0142 and 0.0316 by Gehan-Breslow Wilcoxon test for pre and co compared to BKM alone respectively). * denote mice that were sacrificed due to paralysis resulting from AML infiltrating the CNS rather than deaths typically seen in these mice due to tumor burden. Of note the mice in the BKM + Ketogenic diet group were frequently sacrificed due to paralysis which was not frequently a cause of mortality in the other treatment groups. N = 6,6,5,7,5,7 mice per arm for Vehicle, Pre-Ketogenic diet, Co-Ketogenic Diet, BKM120, Co-ketogenic Diet + BKM120, and Pre-Ketogenic diet + BKM120 arms respectively. (C) Disease burden of AML as measured by percent DS-red positive AML cells in bone marrow and (D) spleen weight across the treatment groups (pre-treatment with keto diet). Data are mean ± s.d. N = 5,4,4,4 mice per arm for Vehicle, Pre-Ketogenic diet, BKM120, and Pre-Ketogenic diet + BKM120 arms respectively (E) Measurement of AML burden in mice that were pretreated with BKM120 and/or a ketogenic diet to demonstrate that the effects observed in the AML studies are not the result of implantation issues related to the pretreatment. Data are mean ± s.d. N = 4,4,4,5 mice per arm for Vehicle, Pre-Ketogenic diet, BKM120, and Pre-Ketogenic diet + BKM120 arms respectively. (F) Images of mice treated as indicated with BKM120 and ketogenic diet where the diet and BKM120 therapy were initiated on the same day (co-treatment). N = 5 mice per arm.
Supplementary Material
Acknowledgements:
This work was supported by NIH grant R35 CA197588 (LCC), R01 GM041890 (LCC), U54 U54CA210184 (LCC), Breast Cancer Research Foundation (LCC) and the Jon and Mindy Gray Foundation (LCC). The content is solely the responsibility of the authors and does not necessarily represent the official views of the National Institutes of Health.
We greatly appreciate the help of the small animal imaging core at MSKCC for assistance with FDG-PET imaging and the Columbia Irving Cancer Center Flow Core Facility funded in part through Center Grant P30CA013696.
Footnotes
References:
- 1.Kandoth C et al. Mutational landscape and significance across 12 major cancer types. Nature 502, 333–339, doi: 10.1038/nature12634 (2013). [DOI] [PMC free article] [PubMed] [Google Scholar]
- 2.Millis SZ, Ikeda S, Reddy S, Gatalica Z & Kurzrock R Landscape of Phosphatidylinositol-3-Kinase Pathway Alterations Across 19784 Diverse Solid Tumors. JAMA Oncol 2, 1565–1573, doi: 10.1001/jamaoncol.2016.0891 (2016). [DOI] [PubMed] [Google Scholar]
- 3.Bendell JC et al. Phase I, dose-escalation study of BKM120, an oral pan-Class I PI3K inhibitor, in patients with advanced solid tumors. J Clin Oncol 30, 282–290, doi: 10.1200/JCO.2011.36.1360 (2012). [DOI] [PubMed] [Google Scholar]
- 4.Juric D et al. Phase I Dose-Escalation Study of Taselisib, an Oral PI3K Inhibitor, in Patients with Advanced Solid Tumors. Cancer Discov 7, 704–715, doi: 10.1158/2159-8290.CD-16-1080 (2017). [DOI] [PMC free article] [PubMed] [Google Scholar]
- 5.Patnaik A et al. First-in-human phase I study of copanlisib (BAY 80–6946), an intravenous pan-class I phosphatidylinositol 3-kinase inhibitor, in patients with advanced solid tumors and non-Hodgkin’s lymphomas. Ann Oncol 27, 1928–1940, doi: 10.1093/annonc/mdw282 (2016). [DOI] [PMC free article] [PubMed] [Google Scholar]
- 6.Mayer IA et al. A Phase Ib Study of Alpelisib (BYL719), a PI3Kalpha-Specific Inhibitor, with Letrozole in ER+/HER2- Metastatic Breast Cancer. Clin Cancer Res 23, 26–34, doi: 10.1158/1078-0432.CCR-16-0134 (2017). [DOI] [PMC free article] [PubMed] [Google Scholar]
- 7.Hopkins BD, Goncalves MD & Cantley LC Obesity and Cancer Mechanisms: Cancer Metabolism. J Clin Oncol 34, 4277–4283, doi: 10.1200/JCO.2016.67.9712 (2016). [DOI] [PMC free article] [PubMed] [Google Scholar]
- 8.Fruman DA et al. The PI3K Pathway in Human Disease. Cell 170, 605–635, doi: 10.1016/j.cell.2017.07.029 (2017). [DOI] [PMC free article] [PubMed] [Google Scholar]
- 9.Belardi V, Gallagher EJ, Novosyadlyy R & LeRoith D Insulin and IGFs in obesity-related breast cancer. J Mammary Gland Biol Neoplasia 18, 277–289, doi: 10.1007/s10911-013-9303-7 (2013). [DOI] [PubMed] [Google Scholar]
- 10.Gallagher EJ & LeRoith D Minireview: IGF, Insulin, and Cancer. Endocrinology 152, 2546–2551, doi: 10.1210/en.2011-0231 (2011). [DOI] [PubMed] [Google Scholar]
- 11.Klil-Drori AJ, Azoulay L & Pollak MN Cancer, obesity, diabetes, and antidiabetic drugs: is the fog clearing? Nat Rev Clin Oncol 14, 85–99, doi: 10.1038/nrclinonc.2016.120 (2017). [DOI] [PubMed] [Google Scholar]
- 12.Ma J et al. A prospective study of plasma C-peptide and colorectal cancer risk in men. J Natl Cancer Inst 96, 546–553 (2004). [DOI] [PubMed] [Google Scholar]
- 13.Xu J et al. Association between markers of glucose metabolism and risk of colorectal cancer. BMJ Open 6, e011430, doi: 10.1136/bmjopen-2016-011430 (2016). [DOI] [PMC free article] [PubMed] [Google Scholar]
- 14.Ma J et al. Prediagnostic body-mass index, plasma C-peptide concentration, and prostate cancer-specific mortality in men with prostate cancer: a long-term survival analysis. Lancet Oncol 9, 1039–1047, doi: 10.1016/S1470-2045(08)70235-3 (2008). [DOI] [PMC free article] [PubMed] [Google Scholar]
- 15.Olive KP et al. Inhibition of Hedgehog signaling enhances delivery of chemotherapy in a mouse model of pancreatic cancer. Science 324, 1457–1461, doi: 10.1126/science.1171362 (2009). [DOI] [PMC free article] [PubMed] [Google Scholar]
- 16.Pauli C et al. Personalized In Vitro and In Vivo Cancer Models to Guide Precision Medicine. Cancer Discov 7, 462–477, doi: 10.1158/2159-8290.CD-16-1154 (2017). [DOI] [PMC free article] [PubMed] [Google Scholar]
- 17.Komoroski B et al. Dapagliflozin, a novel, selective SGLT2 inhibitor, improved glycemic control over 2 weeks in patients with type 2 diabetes mellitus. Clin Pharmacol Ther 85, 513–519, doi: 10.1038/clpt.2008.250 (2009). [DOI] [PubMed] [Google Scholar]
- 18.Demin O Jr., Yakovleva T, Kolobkov D & Demin O Analysis of the efficacy of SGLT2 inhibitors using semi-mechanistic model. Front Pharmacol 5, 218, doi: 10.3389/fphar.2014.00218 (2014). [DOI] [PMC free article] [PubMed] [Google Scholar]
- 19.Pollak M Metformin and other biguanides in oncology: advancing the research agenda. Cancer prevention research 3, 1060–1065, doi: 10.1158/1940-6207.CAPR-10-0175 (2010). [DOI] [PMC free article] [PubMed] [Google Scholar]
- 20.Pollak M Potential applications for biguanides in oncology. J Clin Invest 123, 3693–3700, doi: 10.1172/JCI67232 (2013). [DOI] [PMC free article] [PubMed] [Google Scholar]
- 21.Saura C et al. Phase Ib study of Buparlisib plus Trastuzumab in patients with HER2-positive advanced or metastatic breast cancer that has progressed on Trastuzumab-based therapy. Clin Cancer Res 20, 1935–1945, doi: 10.1158/1078-0432.CCR-13-1070 (2014). [DOI] [PubMed] [Google Scholar]
- 22.Juvekar A et al. Combining a PI3K inhibitor with a PARP inhibitor provides an effective therapy for BRCA1-related breast cancer. Cancer Discov 2, 1048–1063, doi: 10.1158/2159-8290.CD-11-0336 (2012). [DOI] [PMC free article] [PubMed] [Google Scholar]
- 23.Puchalska P & Crawford PA Multi-dimensional Roles of Ketone Bodies in Fuel Metabolism, Signaling, and Therapeutics. Cell Metab 25, 262–284, doi: 10.1016/j.cmet.2016.12.022 (2017). [DOI] [PMC free article] [PubMed] [Google Scholar]
- 24.Sampaio LP Ketogenic diet for epilepsy treatment. Arq Neuropsiquiatr 74, 842–848, doi: 10.1590/0004-282X20160116 (2016). [DOI] [PubMed] [Google Scholar]
- 25.Douris N et al. Adaptive changes in amino acid metabolism permit normal longevity in mice consuming a low-carbohydrate ketogenic diet. Biochim Biophys Acta 1852, 2056–2065, doi: 10.1016/j.bbadis.2015.07.009 (2015). [DOI] [PMC free article] [PubMed] [Google Scholar]
- 26.Pauli C et al. An emerging role for cytopathology in precision oncology. Cancer Cytopathol 124, 167–173, doi: 10.1002/cncy.21647 (2016). [DOI] [PubMed] [Google Scholar]
- 27.Lee C, Kim JS & Waldman T PTEN gene targeting reveals a radiation-induced size checkpoint in human cancer cells. Cancer Res 64, 6906–6914, doi: 10.1158/0008-5472.CAN-04-1767 (2004). [DOI] [PMC free article] [PubMed] [Google Scholar]
- 28.Pelossof R et al. Prediction of potent shRNAs with a sequential classification algorithm. Nat Biotechnol 35, 350–353, doi: 10.1038/nbt.3807 (2017). [DOI] [PMC free article] [PubMed] [Google Scholar]
- 29.Fellmann C et al. An optimized microRNA backbone for effective single-copy RNAi. Cell Rep 5, 1704–1713, doi: 10.1016/j.celrep.2013.11.020 (2013). [DOI] [PubMed] [Google Scholar]
Associated Data
This section collects any data citations, data availability statements, or supplementary materials included in this article.


