

SUMMARY
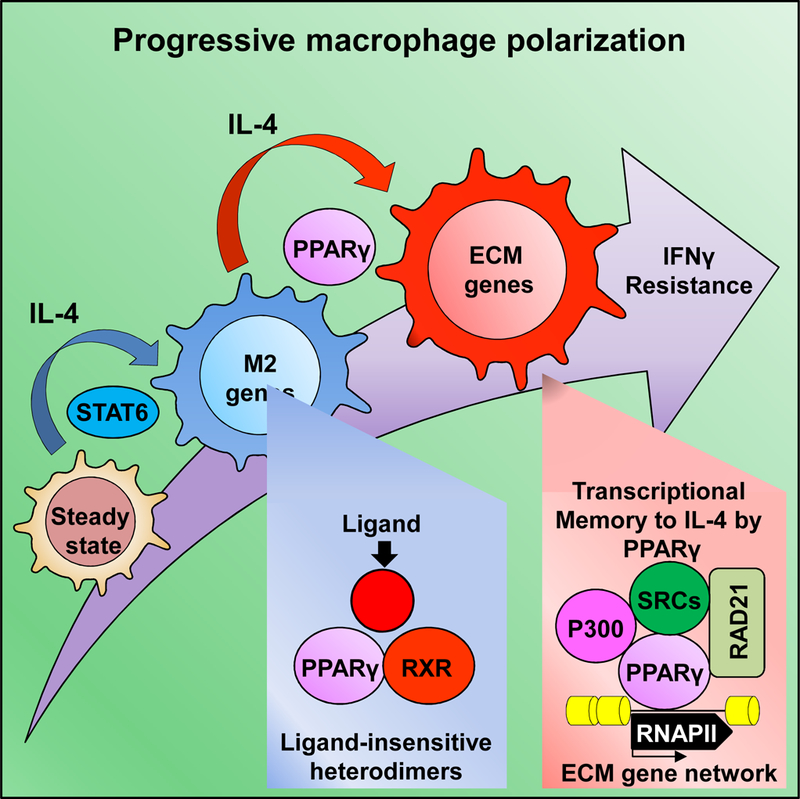
Macrophages polarize into distinct phenotypes in response to complex environmental cues. We found that the nuclear receptor PPARγ drove robust phenotypic changes in macrophages upon repeated stimulation with interleukin (IL)-4. The functions of PPARγ on macrophage polarization in this setting were independent of ligand binding. Ligand- insensitive PPARγ bound DNA and recruited the coactivator P300 and the architectural protein RAD21. This established a permissive chromatin environment that conferred transcriptional memory by facilitating the binding of the transcriptional regulator STAT6 and RNA polymerase II, leading to robust production of enhancer/mRNAs upon IL-4 restimulation. Ligand-insensitive PPARγ binding controlled the expression of an extracellular matrix remodeling-related gene network in macrophages. Expression of these genes increased during muscle regeneration in a mouse model of injury, and this increase coincided with the detection of IL-4 and PPARγ in the affected tissue. Thus, a predominantly ligand-insensitive PPARγ:RXR cistrome regulates progressive and/or reinforcing macrophage polarization.
Keywords: Nuclear receptor, PPARγ, Coregulators, Ligand-insensitive, enhancers, Epigenomics, Transcriptional memory, Progressive polarization, Macrophage polarization, IL-4, IFNγ, Muscle regeneration
Graphical Abstract
eTOC paragraph
Daniel et al. describe that the nuclear receptor PPARγ has a significant ligand-insensitive, genome-bound fraction that affects local chromatin structure upon macrophage polarization. Ligand-insensitive PPARγmediates the expression of a hidden gene set upon repeated IL-4 exposure, providing transcriptional memory and an epigenomic ratchet mechanism to support progressive polarization.
INTRODUCTION
Macrophages are critical components of the innate immune system. These long-lived cells are present in essentially every organ and develop a tissue specific phenotype to maintain homeostasis and protect the body against invading pathogens (Davies et al., 2013). The polarization process that leads to functionally distinct macrophage populations involves chromatin remodeling, but the mechanisms are not well understood. The two end points of polarization can be achieved by inflammatory stimuli (M1 or classical activation) and anti-inflammatory and/or tissue repair stimuli (M2 or alternative activation); however the complex and changing molecular environment in distinct tissues triggers the formation of specialized macrophage subtypes (Martinez and Gordon, 2014). The proximal transcriptional regulators of macrophage polarization have been extensively studied in vitro (Glass and Natoli, 2016), but relatively little is known about the long-term mechanisms of polarization. Recent studies reached the congruent conclusion that epigenomic pre-programming or priming is important in the regulation of macrophages’ future responses (Kang et al., 2017) (Piccolo et al., 2017) (Qiao et al., 2013) (Park et al., 2017). Primed macrophages respond differently to polarizing signals (Qiao et al., 2013) (Czimmerer et al., 2018), suggesting that the given spatiotemporal presence of certain polarizing signals pre-form the epigenome, biasing or predetermining subsequent cellular responses. However, the nature of the epigenomic switches and the suspected transcriptional memory (TM) and its functional relevance remained unexplored.
PPARγ is necessary for proper alveolar macrophage development (Schneider et al., 2014) and alternative macrophage polarization (Odegaard et al., 2007). In the context of macrophage polarization, PPARγ attracts special interest because it is a ligand inducible molecular switch regulated by small lipophilic molecules (Evans and Mangelsdorf, 2014). However, ligand activation of the receptor could not be linked to the induction of polarization-specific genes conclusively, indicating that PPARγ might function in a ligand-independent manner, which is supported by several lines of evidence: 1; PPARγ protein amounts are high in alternatively polarized and peritoneal macrophages, but the number of receptor-bound and ligand-regulated genes is disproportionately low (Szanto et al., 2010) (Welch et al., 2003), 2; PPARγ is required for alternative polarization (Odegaard et al., 2007), but ligand stimulation is not sufficient to drive the polarization- specific gene expression signature (Szanto et al., 2010), 3; Retionid X receptor (RXR), the obligate heterodimeric partner of PPARy has a significant genome-bound, ligand- insensitive and transcriptionally inactive fraction in macrophages (Daniel et al., 2014) (Daniel et al., 2018), 4; Genome-wide profiling studies, reported a discrepancy between the numbers of the genome-bound receptors and the genes exhibiting ligand sensitivity, especially in the case of RXR heterodimeric receptors (Tang et al., 2011) (Evans and Mangelsdorf, 2014) (Daniel et al., 2014).
PPARγ in heterodimer with RXR regulates a plethora of biological processes, primarily metabolism (Tontonoz and Spiegelman, 2008). In macrophages, amongst other functions, the heterodimer regulates the polarization process and the inflammatory response (Welch et al., 2003) (Nagy et al., 2012). However, these studies typically used selective agonistic and/or antagonistic molecules to reveal these roles, by which they also limited the scope of the studies to ligand-regulated events due to the lack of appropriate tools and highly integrated genome-wide analyses.
Here we examined the possible ligand-independent functions of PPARγ in the later stages of alternative polarization and upon repeated interleukin (IL)-4 exposure. Our findings reveal an important role for ligand-insensitive PPARγ in progressive macrophage polarization and shed light on the underlying epigenetic mechanisms.
RESULTS
Alternative polarization reorganizes the PPARγ:RXR-bound regulatory element landscape in macrophages
Recently, we described that half of the RXR cistrome is transcriptionally inactive in nonpolarized macrophages, suggesting the existence of ligand-independent activities (Daniel et al., 2014). We set out to systematically investigate this phenomenon using two distinct (long-, short-term) IL-4 polarization model systems in bone marrow-derived macrophages (referred to as macrophages from now on) (Figure S1A), in which PPARγ is robustly induced (Huang et al., 1999). Long-term polarization represents a biologically relevant stable subtype (Martinez et al., 2009), whilst short-term polarizations allow the dissection of proximal, dynamically changing epigenomic events (Ostuni et al., 2013).
As expected IL-4 polarization robustly increased PPARγ protein in both systems (Huang et al., 1999), but RXR protein levels did not show alterations (Figure S1B). Chromatin immunoprecipitation followed by sequencing (ChIP-seq) for PPARγ and RXR revealed 6116 constitutive RXR (Cluster I.) and 4255 polarization-induced PPARγ:RXR binding regions (Cluster II.) which were associated with a remodeled open chromatin profile as assessed by Assay for Transposase Accessible Chromatin sequencing (ATAC-seq), (Buenrostro et al., 2013), in the long-term polarization model (Figure 1A, B). In order to predict the functional importance of the PPARγ:RXR heterodimers, we annotated genes to Cluster I. (1578) and II (1119) and performed KEGG pathway analysis. We observed that while PPARγ:RXR-bound genomic regions from Cluster I. are in the proximity of genes of the TNF-, phagocytosis- and chemokine-signaling pathways, Cluster II. (de novo) heterodimers are enriched in the vicinity of focal adhesion-related and proteoglycan genes (Figure S1C). Motif enrichment analysis under polarization-specific PPARγ:RXR-bound sites identified direct repeat 1 (DR1), the canonical binding sites for PPAR:RXR heterodimers (Figure 1A). Results from long- and short-term polarization experiments produced largely overlapping PPARγ:RXR cistromes and open chromatin profiles (Figure S1D, E).
Figure 1. Macrophage polarization by IL-4 extends the PPARγ:RXR cistrome, exhibiting predominantly ligand-insensitive sites.

A; Read distribution plot of ATAC-seq, PPARγ and RXR ChIP-seq in non-polarized (CTR) and IL-4 polarized (IL-4) macrophages in a 1.5 kb window around the summit of the RXR peaks. Cluster I. represents constitutive RXR-bound genomic regions, while cluster II. shows de novo PPARγ:RXR sites. Enriched DR1 motif in Cluster II. (bottom). Three replicates were used to determine these clusters using DiffBind and differences were considered significant at p<0.05 using three replicates. B; Box plot representation of ATAC-seq, RXR and PPARγ read enrichments in the clusters defined. Reads from three replicates were merged and results were considered significant at p<0.0001 using paired t test. C; KEGG pathway analysis of RSG-induced genes identified by GRO-seq, dashed line represents —logl 0 (1.5) and used as a threshold. Heat maps depicting genes showing increased expression in the functional categories having p-values higher than the threshold (bottom). Fold changes are relative to IL-4+vehicle treated samples. D; Genome browser view of PPARγ:RXR peaks in the presence of IL-4. GRO-seq signals from IL-4-exposed cells (24 hours) followed by vehicle (veh) or RSG treatments (Ihour) on the indicated loci. E; Quantitative PCR (qPCR) measurement of the indicated genes. Data represent mean +/− SD of triplicate determinations.
Polarization-specific PPARγ is recruited in a ligand-independent manner and exhibit a very restricted response to rosiglitazone
PPARγ:RXR heterodimers are considered as ligand-dependent, fully permissive heterodimers (Kliewer et al., 1992) (Issemann et al., 1993). In order to assess ligand- induced nascent transcription we employed Global Run-On sequencing (GRO-seq), using the selective PPARγ agonist rosiglitazone (RSG). We found only 78 induced and 24 repressed PPARγ target genes (Figure S1F) having PPARγ:RXR-bound regulatory regions within 100kb with similar expression pattern as the adjacent genes. As expected, KEGG pathway analysis of this gene network showed enrichment for PPAR signaling (Figure 1C). Other than the known target genes (Angptl4, Fabp4, Tgm2), we observed PPARγ:RXR-bound genomic regions near IL-4 regulated genes that were not affected by RSG (Arg1, Hbegf) (Figure 1D). In order to exclude the possibility that the receptor is already bound by an endogenous ligand we used a PPARγ antagonist, GW9662, which had no effect on IL-4-mediated induction on any of the PPARγ:RXR- bound, IL-4-sensitive genes (Fabp4, Tgm2, Arg1 and Hbegf), but it abolished the RSG- mediated induction of the ligand-sensitive target genes (Angptl4, Fabp4 and Tgm2) (Figure 1E). In addition, genome-wide assessment of the recruitment of PPARγ, elongation-specific RNA polymerase II (RNAPII-pS2), P300 (ChIP-seq) and the examination of IL-4-mediated gene induction (RNA-seq) reported marginal differences in the presence of the antagonist, supporting the notion of ligand-independent recruitment and function of PPARγ in polarized macrophages (Figure S1G, H, J). ChIP-qPCR validated the ChIP-seq results in the presence of the antagonist (Figure S1l).
Enhancer activity based functional characterization of polarization-specific PPARγ-bound regulatory regions
In order to reveal the ligand-sensitive, heterodimer-bound sites we first identified 5346 PPARγ:RXR-occupied regulatory regions. For further analyses we only considered those PPARγ:RXR co-peaks, which exhibited enhancer transcription (2776/5034, 55% similarly to the RXR cistrome in resting macrophages (Daniel et al., 2014)); enhancer transcripts of 312 regions could not be measured because of the overlap with promoters of multiple genes. To characterize the RSG-insensitive PPARγ:RXR heterodimers from a mechanistic and functional point of view, we classified the RSG-sensitive and RSG-insensitive enhancers based on enhancer RNA (eRNA) expression. We further split the RSG-sensitive ones into induced/repressed and the RSG-insensitive group into IL-4 induced/repressed and insensitive, which cannot be activated by RSG or IL-4. As a result, we identified 137 RSG-induced, 52 RSG-repressed, 360 IL-4-sensitive (239 induced and 121 repressed, respectively) PPARγ:RXR-bound enhancers and assigned them to the closest regulated genes having similar expression pattern. We also detected 2227 PPARγ:RXR-bound regions, insensitive to IL-4 or IL-4+RSG (Figure 2A). Importantly, the activation patterns of these enhancers were reproducible by RNAPII- pS2 ChIP-seq in the presence of RSG. Moreover, RNAPII-pS2 enrichments after RXR activation (LG268) showed very similar results as the PPARγ agonist on the RSG sensitive enhancer set, while it had no effect on the other enhancers. Furthermore, PPARγ antagonist (GW9662) had no effect on RNAPII-pS2 enrichment on any of these enhancers (Figure S2A).
Figure 2. Determination and characterization of the ligand-sensitive, -insensitive PPARγ cistrome.

A; Box plot depicting enhancer RNA expression (RPKM) in the presence of the indicated compounds determined by GRO-seq on PPARγ:RXR-bound loci. Numbers represent region count for enhancers (bottom) and annotated genes (Ann. Genes, right, in brackets) in each category. “veh” stands for solvent control. Reads from two biological replicates were merged and changes were considered significant at p<0.05 using two tailed paired t test. B, Crystal structure of the intact PPARγ:RXRa heterodimer on the indicated response element (Chandra et al., 2008). PPARγ is highlighted in red, RXRa in blue. DBD indicates DNA binding domain. Red arrows show the ACT sequence, located upstream to the PPARγ half site and its extensive interaction with the hinge region. DR1 motifs enriched for RSG-induced and IL-4-sensitive PPARγ:RXR enhancers are also shown (bottom). C; Histograms depicting read enrichments for ATAC-seq, P300 and RAD21 ChIP-seq around PPARγ summits at RSG- and IL-4-induced enhancers in IL-4 treated wild type (Pparg +/+) and Pparg −/− cells. Box plot panels show normalized read counts (Norm. R. C.) for each factor. Significant changes were identified by paired t test at p<0.05. Correlation analysis was performed between replicates (Figure S2D) and one representative experiment is shown. D; Genome browser view of PPARγ, ATAC- seq, P300 and RAD21 signals on the indicated loci. Overlay tracks are presented for ATAC-seq, P300 and RAD21 from IL-4-treated wild-type (+/+) and Pparg −/− cells.
Motif analysis under the RSG-induced enhancers, reported an extended PPARγ half site, containing an extra upstream sequence (A-G/C-T) in DR1 (Figure 2B). This extension has been found in 19 ligand-responsive PPARγ response elements (Ijpenberg et al., 1997) and has been shown to affect the binding affinity of PPARγ:RXR heterodimers (Palmer et al., 1995). In addition, structures of the intact PPARγ:RXR complex bound to DNA show that this extension is required for the PPAR hinge region to form an interaction with DNA (Figure 2B), likely necessary for the proper conformation and the ligand binding ability of the receptor (Chandra et al., 2008). In contrast, RSG repressed and the ligand-insensitive sites lack this extension, but harbor a shorter, more canonical RXR binding site suggesting that the PPARγ side of the complex is in a distinct, suboptimal conformation to bind ligand (Figure S2B).
Macrophage specific ligand-insensitive PPARγ:RXR heterodimers show negligible ligand sensitivity in 3T3-L1 adipocytes
Utilizing PPARγ and RXR ChIP-seq experiments complemented by GRO-seq in the presence or absence of RSG (Step et al., 2014) allowed us to perform the same analysis in adipocytes where PPARγ is a linage-determining factor (Tontonoz and Spiegelman, 2008). We identified 21074 PPARγ:RXR-bound regions in adipocytes and overlapped this with the macrophage cistrome (5346), yielding 1024 shared, heterodimer-bound sites (Figure S2C). In order to identify the ligand sensitive heterodimers, we integrated the ChIP-seq and GRO-seq data sets. Our analysis uncovered 1262 ligand sensitive sites (1111 RSG-induced and 151 RSG-repressed, respectively) in the adipocyte genome, which accounts for only 5.98% of the cistrome replicating our results obtained from macrophages. Only 12 of these regions could be identified amongst the 189 ligand sensitive sites from macrophages. Finally, we were curious whether the 5157 ligand-insensitive heterodimers in macrophages might be in a different epigenomic context, which allows their activation in adipocytes. We overlapped these genomic regions (5157 ligand-insensitive sites from macrophages with 1262 ligand sensitive adipocyte heterodimers) and found a marginal overlap consisting of 75 RSG-activated and 10 RSG-repressed enhancers in adipocytes (Figure S2C).
These analyses show that the PPARγ:RXR heterodimer cistrome is highly cell type- specific and exhibit similar characteristics in adipocytes with regards to ligand sensitivity, with the caveat that the presence and action of endogenous ligands cannot be excluded due to lack of experimental data with antagonists.
Ligand-insensitive PPARγ recruits P300, RAD21 and increases chromatin accessibility upon polarization
To gain insights into the function of ligand-insensitive sites we asked whether PPARγ works as an epigenomic bookmark, contributing to the development of a changed, more permissive chromatin environment. We performed ATAC-seq and ChIP-seq experiments for P300 (universal coactivator) and RAD21 (member of the genome architectural Cohesin complex (Peters et al., 2008)) in IL-4-polarized wild type (Pparg +/+) and Pparg −/− macrophages. We found that RSG sensitive enhancers bind PPARγ more efficiently, than RSG-repressed or RSG-insensitive sites reflecting the more conserved nature of the PPARγ binding 5’ motif in DR1 (Figure S2E). Analysis of chromatin openness revealed that IL-4-mediated chromatin opening is diminished in all enhancer categories in the absence of PPARγ except for the transcriptionally inactive (inactive -) regulatory regions, where PPARγ had no significant contribution (Figure 2C, Figure S2E). RSG sensitive enhancers showed no IL-4 induced P300 and RAD21 binding, but their basal occupancies have significantly decreased in the absence of the receptor. Importantly, IL- 4-mediated P300 and RAD21 recruitment was highly PPARγ-dependent on IL-4-induced enhancers, further supporting its potential epigenomic/bookmarking activities (Figure 2C, D and Figure S2E). These findings were validated with directed FAIRE-qPCR and ChlP- qPCR (using antibodies for RAD21, P300, SRC1, SRC3) approaches on select genomic loci (Figure S2F, G, H). We observed minor PPARγ effects in the remaining enhancer categories with regards to P300 and RAD21 enrichments and transcriptionally inactive sites showed no change at all (Figure S2E). In addition, using MARCoNI (Micro array Assay for Real-time Coregulator-Nuclear receptor Interaction) (Broekema et al., 2018), which is capable of detecting protein-protein interactions of a wide variety of coregulator- derived LxxLL motifs (coactivators: CBP, P300, MED1, SRC1, SRC2, SRC3, PGC1α and PGCβ; corepressors: NCOR1 and NCOR2) and nuclear receptor ligand binding domains (LBD) we determined the binding affinity of PPARγ and Estrogen Receptor alpha (ERα) to these coregulator peptides in the presence or absence of their activator ligands (RSG and 17-β-Estradiol, respectively), (see Table S1). These in vitro assays reported that PPARγ-LBD has an inherent ability to bind coregulators in the absence of its ligand with high affinity, however ligand activation could modestly increase its binding affinity towards coregulators (Figure S2I). In addition, PPARγ has high affinity towards corepressor-derived peptides, which can be reversed in the presence of the ligand, representing the most robust ligand-induced change in this assay. The steroid receptor, ERa exhibited dynamic ligand-dependent coregulator binding, while in the absence of its ligand it had much weaker or close to zero ability to bind coregulators (Figure S2I).
Collectively, these results provide evidence that, though the vast majority of PPARγ:RXR binding is inert to ligand-induced transcription, they recruit regulatory factors with high affinity and affect chromatin accessibility. Thus, these results are suggestive, but at the very least, compatible with important epigenomic regulatory functions of the chromatin-bound apo-receptor.
Macrophages recall the first IL-4 exposure and retain the binding of PPARγ
Next, we asked the question if the newly deposited heterodimers had roles in directing the progression of the cells as transcriptional memory (TM) marks. This hypothesis was based on the time course ChIP-seq experiments for STAT6, RXR, P300, RAD21 and ChIP-qPCR for STAT6 and PPARγ, which revealed that STAT6 is in very large part released from the chromatin after 24 hours of IL-4 treatment, while the binding of PPARγ:RXR is reaching its maximum at this time point along with P300 and RAD21 (Figure 3A; Figure S3A). These results indicate that, whilst the effect of STAT6 is transient, PPARγ and RXR might have effects at the later stages of polarization.
Figure 3. Ligand-insensitive PPARγ facilitates STAT6 signaling.
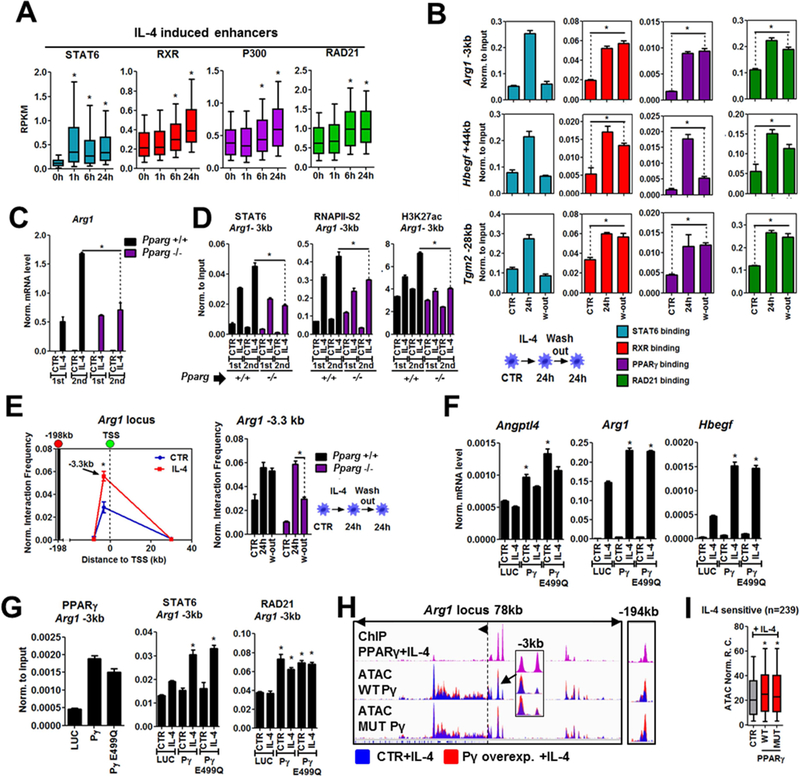
A; Read enrichments (RPKM values from one representative experiment) for STAT6, RXR, P300 and RAD21 determined by ChIP-seq at IL-4-regulated enhancers in a time course experiment. B; ChIP-qPCR carried out for STAT6, RXR, PPARγ and RAD21 on the indicated loci. Experimental scheme is shown (bottom). C; Quantification of Arg1 gene expression (mRNA) using qPCR in wild-type (+/+) and Pparg −/− macrophages. First and second stimulation by IL-4 is indicated as 1st and 2nd. D; ChIP-qPCR for STAT6, RNAPII-pS2 and H3K27ac in wild-type and Pparg −/− cells upon 1st and 2nd IL-4 stimulation. E; 3C-qPCR experiments on the Arg1 locus. Interaction of the enhancer located close to the −198kb bait and the gene promoter is shown in untreated (CTR) and IL-4 stimulated wild-type cells (left). Interaction frequency of the bait and promoter is also presented in Pparg −/− cells. The experimental setup is the same as on panel B. F; Gene expression (mRNA) of the indicated genes in gain of function experiments using Pparg −/− macrophage cell lines expressing luciferase (LUC), wild-type PPARγ (Py) and ligand-insensitive, mutant PPARγ (Py E499Q). G; ChIP-qPCR for PPARγ, STAT6 and RAD21 on the Arg1 enhancer in the gain of function system. H; Genome browser view of PPARγ ChIP-seq in wild-type macrophages and ATAC-seq signals from gain of function experiments on the Arg1 locus. Overlay tracks are presented for ATAC-seq. I; Box plot showing ATAC-seq read enrichments from gain of function experiments on IL-4 induced enhancers from two replicates for each condition. Significant changes are determined by two tailed t tests at p<0.05 for all the panels (boxplots-paired, bar graphs- unpaired). Bargraphs present the mean +/− the SD of at least two biological replicates.
We exposed macrophages for 15min, 30min, 1h, 6h and 24h with IL-4 (1st stimulation). We performed the same time course experiment after 24 hours of IL-4 stimulation (2nd stimulation) followed by cytokine wash-out and resting for 24 hours (Figure S3B). We measured eRNA expression on 4 IL-4 sensitive (Arg1 −1kb, 3kb; Hbegf −43kb, 44kb) and 2 RSG/IL-4 sensitive enhancers (Tgm2 −20kb, −28kb) (Figure S3C). The enhancers responded either more quickly or more robustly to the second stimulation, moreover we found more robust STAT6 recruitment to these sites (Arg1 −3kb, Tgm2 −28kb, Hbegf +44kb) upon restimulation (Figure S3C and D). In line with the previous results, we also detected more robust IL-4-mediated induction of Arg1, Hbegf and Tgm2 at the mRNA level upon restimulation (Figure S3D). The protein level of PPARγ showed increased expression upon the first stimulation and retained an induced level after wash-out, but exhibited more robust induction after restimulation (Figure S3E). ChIP-qPCR experiments for STAT6, RXR, PPARγ and RAD21 after the first stimulation and washout showed that STAT6 was fully released from chromatin after wash-out, but the binding of the receptors and RAD21 was either completely or partially retained on the enhancers of Arg1, Tgm2 and Hbegf (Figure 3B). Finally, we tested whether the observed TM is retained in primary and immortalized macrophages for 4 days after cytokine removal. All three genes exhibited significantly enhanced IL-4-mediated induction even after 4 days in primary macrophages, however Tgm2 lost its “memory” to IL-4 in the proliferating macrophage cell line, while Arg1 and Hbegf retained it (Figure S3F). In addition, PPARγ binding was significantly retained at day 4 on the enhancers of Arg1, Tgm2 and Hbegf in primary cells (Figure S3G). Altogether, these data indicate the existence of TM to IL-4 stimulation in macrophages, which coincides with the retained binding of PPARγ, RXR and RAD21.
Ligand-insensitive PPARγ facilitates the binding of STAT6 and RNA-polymerase II and confers transcriptional memory
To clarify the mechanistic contribution of PPARγ to TM we used wild-type (Pparg +/+), Pparg −/− and Rxra/b −/− macrophage cell lines. After IL-4 wash-out, the induced level of Arg1, Hbegf and Tgm2 mRNAs dropped back to the baseline, but we found significantly lower mRNA levels in the absence of the receptors after the second IL-4 stimulation in all three cases (Figure 3C and Figure S3H). Inhibition of the ligand binding capacity of PPARγ did not affect TM (Figure S3I). Further molecular analyses of the Arg1 locus revealed that PPARγ is required for more robust STAT6, RNAPII-pS2 recruitment and H3K27ac deposition upon restimulation (Figure 3D), suggesting that ligand-insensitive PPARγ provides TM at the chromatin level.
Ligand-insensitive PPARγ mediates transcriptional memory and retained enhancer-promoter looping on the Arg1 locus
The retained binding of RAD21 hinted the involvement of promoter-enhancer interactions. To address this, we performed chromosome conformation capture (3C) (Dekker et al., 2002) on two Arg1 (IL-4 sensitive) and Tgm2 (RSG/IL-4 sensitive) genes after the first IL-4 exposure and after the removal of the cytokine. We detected a strong interaction between a distant enhancer (−198kb) and the promoter region of Arg1, which is further induced by IL-4 and efficiently retained after wash-out. However, in the absence of PPARγ or RXR, IL-4-induced looping is significantly diminished upon the removal of the cytokine (Figure 3E, Figure S3J). On the Tgm2 locus, we found an IL-4- induced interaction between the enhancer (−28kb) and the intronic region of the gene, which diminished in the absence of the receptors during the first stimulation (Figure S3K). After wash-out, the interaction was partially retained in both WT and Pparg −/−macrophages, but not in the Rxra/b −/− cells (Figure S3K), suggesting that RXR itself or in complex with a different partner might be involved in maintaining it as well. These results suggest the possible distinct mode of action by ligand-sensitive and -insensitive PPARγ receptors in mediating TM formation at the 3D chromatin level, but we must emphasize here that global, unbiased analyses are required to clarify and generalize these observations.
Ligand-mediated activation function mutant PPARγ facilitates STAT6 signaling via altering chromatin structure
Gain of function experiments in Pparg −/− immortalized macrophages using the wild-type and the ligand-dependent activation function mutant (E499Q) (Hauser et al., 2000) (Figure S3L), transcriptionally inactive receptor showed that IL-4-mediated induction of Arg1 and Hbegf can be facilitated by the reintroduction of the receptors, but not Angptl4 which is not sensitive to IL-4 upon the first stimulation, but exhibited significantly induced basal expression in the presence of the receptors (Figure 3F). In addition, RSG failed to induce the mRNA levels of Arg1 and Hbegf, but it regained its effect on Angptl4 only in the presence of the WT receptor (Figure S3M). Moreover, elevated levels of both the WT and mutant receptors could enhance the IL-4-mediated binding of STAT6 and the basal level of RAD21 on the Arg1 enhancer (Figure 3G). Complementary ATAC-seq experiments also revealed enhanced IL-4-mediated chromatin opening at the Arg1 locus in the presence of both the WT and mutant receptors (Figure 3H). Furthermore, global analysis of chromatin accessibility on IL-4-induced enhancers reported enhanced IL-4- mediated chromatin opening in both the wild-type and mutant receptor expressing Pparg −/− macrophages (Figure 3I). These results suggest that PPARγ can collaborate with IL- 4/STAT6 signaling in a ligand-independent manner.
PPARγ-mediated transcriptional memory controls progressive macrophage polarization via the regulation of an extracellular matrix-related gene network
Finally, we were wondering about the extent and biological role of PPARγ-dependent TM. RNA-seq analysis of TM-dependent changes in Pparg −/− macrophages identified 235 genes that were exclusively induced upon the second IL-4 stimulation and showed PPARγ dependence (Figure 4A, B). These genes formed a coherent gene network regulating focal adhesion, extracellular matrix receptor interactions, regulation of actin cytoskeleton and tight junction (KEGG pathway analysis), including more collagen genes and others necessary for the cells to interact with the extracellular matrix (ECM) (Figure 4C, D, E). The majority (87%) of these genes appeared to be completely insensitive to either PPARγ:RXR agonists, or to the PPARγ antagonist, determined by RNAPII-pS2 ChIP-seq, while PPARγ:RXR heterodimers are present at these genomic loci (Figure 4F and Figure S4A). We tested the contribution of these changes in an in vitro “scratching assay” and found that re-epithelialization by HREC (Human retinal endothelial cell) cells were significantly diminished if they have received supernatant from double stimulated Pparg −/− macrophages compared to wild-type counterparts (Figure 4G). Our results suggest, that macrophages received repeated IL-4 stimulation may secrete factors that can potently enhance cell growth and/or migration in a PPARγ-dependent, but ligand- independent manner.
Figure 4. Ligand-insensitive PPARγ acts as an epigenomic ratchet, providing transcriptional memory on a coherent ECM-related gene set.

A; Experimental setup used to study transcriptional memory in wild type (Pparg +/+) and Pparg −/− macrophages. First stimulation (1st) and second stimulation (2nd) was performed and samples were collected for RNA-seq. B; Heat map representation of the genes (235) changing exclusively upon the 2nd IL-4 stimulation and dependent on the presence of PPARγ. Fold change > 2 and significant changes at p<0.05 using edgeR GLM (General Linear Model) are shown between wild-type and Pparg −/− from two replicates. Log2 fold change is presented. C; Genome browser snapshot of a select set of genes, showing upregulation only upon the 2nd IL-4 stimulation in a PPARγ- dependent manner (RNA-seq). RplpO is shown as a control. D; Enriched KEGG pathway analysis terms for PPARγ-dependent transcriptional memory, dashed line represents - log10 (1.5) and used as a threshold to focus on the most significant terms. E; Heat map representing the focal adhesion related gene set. Log2 fold change is presented. F; Genome browser view of the Collal locus with the indicated ChIP-seq and RNA-seq experiments. ChIP-seq experiments for RNAPII-pS2 was performed in the presence of the indicated nuclear receptor ligands. G; In vitro scratch assay using HREC (Human Retinal Endothelial Cells) cells. Wild-type (+/+) and Pparg −/− macrophages were stimulated with IL-4 for 24 hours or left untreated. Wash-out was performed and the cells were rested for 24 hours followed by 24 hours of IL-4 restimulation. HREC cells were incubated for 24 hours in the collected macrophage supernatants and wound closure was quantified. Percentage of re-epithelialization over untreated control (dashed line) is presented. Mean +/− SD of triplicate determinations are shown and changes were considered significant at p<0.05 using two tailed unpaired t test.
Next, we investigated if the identified ECM-related gene signature can be detected in vivo using cardiotoxin (CTX)-induced sterile injury of the tibialis anterior muscle in male mice of both the C57BL/6 and DBA/2J mouse strains. This gold-standard model of acute muscle injury results in synchronized muscle degeneration and regeneration and includes a well-defined recruitment of inflammatory macrophages and their progressive polarization towards anti-inflammatory/repair macrophages during the time course of regeneration (Arnold et al., 2007, Varga et al., 2016, Patsalos et al., 2017). To address whether IL-4 signaling is present during the muscle regeneration process, we measured the expression of Il4 at the mRNA level from whole muscle tissue of both mouse strains at the second day following injury. While we could not detect Il4 gene expression in the injured muscles of C57BL/6 mice, we confirmed the expression of Il4 and presence of IL-4 protein in the injured muscles of DBA/2J mice (Figure S4B-C), a strain that is more susceptible to fibrosis than C57BL/6 mice in context of injury and muscle disease (Fukada et al. 2010, Heydemann et al. 2009). These results prompted us to study the regeneration process in the DBA/2J mouse strain and sort the two main infiltrating macrophage populations (Varga et al., 2016, Patsalos et al., 2017) that appear and important for regeneration. We isolated Ly6Chigh/F4/80low and Ly6Clow/F4/80high macrophages on day 1, 2 and 4 following injury and performed RNA-seq. The mRNA levels of both Il4 and Pparg progressively induced and maintained during the time course of regeneration (Figure S4D). Next, we determined the gene expression signature of the sorted macrophage populations and overlapped these with the PPARγ- dependent gene set, which exclusively appeared in in vitro differentiated macrophages upon IL-4 restimulation. We observed that 95% (224/235) of the genes identified in the in vitro system are also expressed in the macrophage populations sorted from the DBA/2J mice (Figure S4E). Moreover, most of the ECM remodeling-related genes exhibited progressive induction during the time course of regeneration, including the collagen genes observed in the in vitro system (Figure S4F). Altogether, these results show good correlation with our data obtained in vitro not only at the level of the ECM- related macrophage gene signature, but also at the level of the available, potential upstream regulators of the ECM-related gene set.
Progressive alternative polarization of macrophages induces IFNγ resistance
Recent studies reported that the classical polarization trigger interferon gamma (IFNγ) inhibits the gene program of alternative polarization in human macrophages and also diminish the effects of IL-4 and vice versa in mouse macrophages (Kang et al., 2017) (Piccolo et al., 2017), we probed how repeated IL-4 stimulation affects the responsiveness of the cells to IFNγ. If progressive polarization exists we expect to see less IFNγ responsiveness as the cells proceed down on the cellular pathway of alternative polarization following repeated IL-4 stimulation. We employed a model, where macrophages were restimulated for two, three and four times with IL-4 followed by IFNγ exposure. We performed washout after each stimulation and rested the cells for 24 hours before the next stimulation (Figure S4G). Measuring gene expression at the mRNA level reported that Arg1 mRNA levels were significantly higher upon the second stimulation as we reported before, but the cells were not able to further induce the level of Arg1 after the third and fourth restimulation. However, the cells’ response to IFNγ progressively diminished as determined by the mRNA levels of Ccl5, Irg1 and Irf8 genes (Figure S4H), leading to almost complete desensitization after the fourth IL-4 restimulation.
Altogether, progressive polarization affects not only the driving stimulus, but also the response of macrophages to IFNγ. The epigenomic basis of this phenomenon remains to be identified.
Discussion
Epigenetic changes reprogram macrophages and affect their future responses (Qiao et al., 2013) (Ostuni et al., 2013) (Czimmerer et al., 2018). A plausible mechanism that can support long-term cellular specification is the generation of TM, which would enable cells to proceed into a pre-determined direction and reinforce repeated signaling. Here we studied the roles of the PPARγ:RXR heterodimer cistrome in the context of alternative polarization, asking the following questions: How does a greatly extended PPARγ cistrome functions if ligand stimulation is not able to drive the gene expression signature of alternative polarization, but the receptor is required to reach this state? Do all these sites mediate ligand-regulated gene expression? If not, what is the role of ligand- insensitive receptors?
We found that PPARγ:RXR heterodimers act as ligand-insensitive epigenomic regulators of chromatin structure, allowing the progressive polarization of macrophages. Conceptually, our findings represent a departure from current models of ligand-activated nuclear receptor (NR) action. Moreover, our results can partly explain the presence of the many ligand-insensitive PPARγ:RXR sites in the genome of macrophages (Welch et al., 2003) (Daniel et al., 2014) (Daniel et al., 2018) and potentially of other cell types (Soccio et al., 2017), and suggest a model wherein PPARγ:RXR deposition at such sites generate a chromatin environment that shapes the future responses of the cells.
A key feature of this model is the lack of the requirement for ligand evidenced by:.1) Neither strong activators of PPARγ nor RXR show any activity on these heterodimers, whilst they regulate gene expression via conventional heterodimers, (2) a potent antagonist of PPARγ did not affect chromatin binding, enhancer activity and co-factor recruitment, arguing against the involvement of endogenous ligands, (3) epigenomic features of ligand-insensitive PPARγ are recapitulated in gain-of-function experiments using a receptor devoid of its transactivation function and finally, (4) In vitro, apo-PPARγ exhibits high affinity towards coregulators, while ligand effects are modest.
Molecularly, ligand-insensitive PPARγ directly binds DNA and facilitates the recruitment of STAT6, P300, RAD21, RNAPII and ultimately the production of eRNAs in response to IL-4. The structural basis of this phenomenon is likely to be a ligand-insensitive quaternary heterodimer configuration leading to chromatin opening and bookmarking on a distinct DR1 motif, however genome engineering will be required to reveal the functional importance of the motifs in mediating NR action in the given genomic context. After the first IL-4 exposure and subsequent STAT6 activation, PPARγ is transcriptionally induced and the produced protein heterodimerizes with RXR from its non-DNA-bound, stable pool (Brazda et al., 2014). The DNA-bound heterodimer recruits P300 and RAD21 and affects chromatin structure. This altered epigenome allows more robust STAT6 binding and the expression of a hidden gene program reaching the threshold of activation only after the second stimulus. It remains to be identified if collaborative transcription factors or specific cofactors also contribute to the activation of ligand-insensitive PPARγ:RXR-bound enhancers.
The large number of ligand-insensitive PPARγ:RXR-bound sites raises the intriguing possibility regarding the evolution of liganded receptor activity and suggests that ligand- dependent functions might have evolved from ligand-insensitive sites by acquiring extended binding sites, resulting in ligand-sensitive quaternary structures (Markov and Laudet, 2011).
In a wider sense, the mechanism uncovered here might serve as TM for imprinting cells, modulating their subsequent activities and immune phenotype acting as an epigenomic ratchet, giving long-term directionality to otherwise transient processes. In addition, the appearance of ligand-insensitive PPARγ-mediated TM allows the manifestation of a hidden gene signature upon repeated exposure to IL-4. The example of ligand- insensitive PPARγ-regulated TM suggests that progressive macrophage polarization might take place upon repeated exposure to certain molecules and this can be a necessary component in the cells’ life to contribute to physiological and pathophysiological processes. We provide evidence that indeed as the cells proceed down on the path of alternative polarization they become less and less sensitive to IFNγ and also present an in vivo relevant, specific case using a mouse model of muscle regeneration, which is characterized by newly infiltrating macrophages in the presence of IL-4 and PPARγ. In this model, muscle injury leads to the recruitment and most likely progressive polarization of macrophages in the tissue environment, in which we observed the progressive appearance of the ECM-related gene signature during the time course of regeneration. Future studies are needed to establish causality between PPARγ and the appearance of the ECM macrophage gene signature in this in vivo model.
EXPERIMENTAL MODEL AND SUBJECT DETAILS
Mouse strains
Male, wild type, 3 months old DBA2J (stock number 000671) were obtained from the Jackson Laboratories and bred under specific-pathogen free (SPF) conditions. All the other strains are on C57BL/6 genetic background. The RXR-deficient macrophage- specific knockout mice were gifts from Pierre Chambon’s laboratory. We crossed Rxra fl/fl Rxrb +/− lysozyme-Cre (LysCre)+ males with Rxra fl/fl Rxrb −/− LysCre+ females and used the Rxra fl/fl Rxrb −/− LysCre+ 3 months old male mice. As control we used Rxra +/+ Rxrb −/− LysCre+ male mice obtained from crossing male Rxra +/+ Rxrb +/− LysCre+ with Rxra +/+ Rxrb −/− LysCre+ female.
Mice carrying null or floxed alleles of Pparg were created as described previously (Szanto et al., 2010). These mice were backcrossed to the C57BL/6J strain for eight generations. Mice were bred with LysCre transgene animals to create the following genotypes: Pparg +/+ LysCre+, Pparg fl/fl LysCre+, Pparg +/− LysCre+ and Pparg fl/- LysCre+. Bone marrow-derived macrophages derived from these strains are designated as Rxra/b −/− and Pparg −/− respectively. Animals were handled according to the regulatory standards of our animal facility managed by Charles River.
Bone marrow-derived macrophages
Isolation and differentiation were completed as described earlier (Daniel et al., 2014b). Isolated bone marrow-derived cells were differentiated for 6 days in the presence of L929 supernatant. Cells were either exposed to IL-4 (5ng/ml) during the whole differentiation process or polarized on the 6th day of the differentiation with IL-4 (20ng/ml) for the indicated period of time.
Immortalized mouse bone marrow-derived macrophages
Bone marrow-derived cells from male (3 months old) mice were immortalized using the J2 cell line continuously producing the J2 virus encoding v-raf and v-myc oncogenes. J2 cells were grown in DMEM containing 20% FBS. Bone marrow cells were seeded in immortalization media I. (90% J2 supernatant, 5% HyClone FBS, 10ug/ml Polybrene 0.1%, L929 supernatant 5%) and incubated overnight. On the second day supernatant was collected and spun down to pellet floating cells. Adherent cells were scraped and re-plated in a new petri dish using immortalization medium II. (20% J2 supernatant, 10% HyClone FBS, 10ug/ml Polybrene 0.1%, L929 supernatant 10%, 60% DMEM) and incubated for 6 days. After the immortalization cells were kept in regular macrophage differentiation media (20% FBS, 30% L929 supernatant and 50% DMEM containing 1% antibiotics).
PPARy expressing stable macrophage cell lines
Sub-cloning of wild type and E499Q mutant Pparg was performed with In-Fusion® HD Cloning Kit from the original plasmids (Addgene Plasmid #8895, Plasmid #8896). Immortalized macrophages lacking Pparg were transduced with lentiviruses (Lenti-X™ Tet-One™ Inducible Expression Systems, Clontech cat#631844, 631847) carrying Luciferase, wild type and E499Q mutant mouse Pparg genes. Cells were incubated with the virus for 36 hours, and then media was replaced to fresh differentiation media. After 24 hours, macrophages were exposed to puromycin (5ug/ml) for 6 days and medium was changed in every second day. After the selection period cells were grown in differentiation media and for all the experiments Pparg expression was induced in the presence of doxycycline (100ng/ml) for 24 hours.
METHOD DETAILS
Treatment conditions
Primary macrophages were treated with IL-4 (5ng/ml) for 6 days during long-term exposure. Upon short-term exposure macrophages were treated with IL-4 (20ng/ml) for 1, 6 and 24 hours. These treatment conditions were used for ChIP-seq. GRO-seq and gene expression measurements were performed in macrophages differentiated with M- CSF, on the 6th day cells were exposed to IL-4 (20ng/ul) for 24 hours. After 24 hours of polarization, RSG (1uM) was added to the cells for an additional 1 hour and then run-on reactions were performed. The same experimental setup was used for RNAPII-pS2 ChIP-seq with RSG, LG268 (100nM) and GW9662 (1uM). 3C experiments were carried out in the presence of IL-4 after 24 hours of IL-4 treatment. ATAC-seq experiments were carried out in the short-term and long-term exposure system using the IL-4 concentrations described above. Experiments aiming to clarify the effect of the PPARγ antagonist were performed with the following treatment conditions: GW9662 (1uM for 24 hours), IL-4 (20ng/ml for 24 hours), IL-4/GW9662 (concentrations were the same as indicated previously for 24 hours), IL-4+RSG (IL-4 for 24 hours and then RSG in 1 uM for 3 hours) and IL-4+RSG/GW9662 (IL-4 for 24 hours and then RSG/GW9662 for 3 hours in a 1uM concentration). IFNg was used in a 20ng/ml concentration.
ATAC-seq
ATAC-seq was carried out as described earlier with minor modification (Buenrostro et al., 2013). Cells were scraped and counted to achieve 50k/ml in ice-cold PBS. Cell suspension was further diluted to 25k/ml and nuclei were isolated with ATAC-LB (10mM Tris-HCl pH7.4, 10mM NaCl, 3mM MgCl2, 0.1% IGEPAL). Nuclei from 25k cells were used for tagmentation using Nextera DNA Library Preparation Kit (Illumina) from two biological replicates. After tagmentation DNA was purified with MinElute PCR Purification Kit (Qiagen). Tagmented DNA was amplified with Kapa Hifi Hot Start Kit (Kapa Biosystems) using 9 PCR cycles. Amplified libraries were purified again with MinElute PCR Purification Kit. Fragment distribution of libraries was assessed with Agilent Bioanalyzer and libraries were sequenced on a HiSeq 2500 platform.
ATAC-seq analysis
The primary analysis of ATAC-seq-derived raw sequence reads has been carried out using our ChIP-seq analysis command line pipeline (Daniel et al., 2014) (Daniel et al., 2018) including the following steps: Alignment to the mm10 mouse genome assembly was done by the BWA tool, and BAM files were created by SAMtools. Genome coverage (bedgraph and tdf) files were generated by makeTagdirectory with checkGC parameter and makeUCSCfile.pl with ‘-fsize 1e50’ and -norm parameters (HOMER) (Heinz et al., 2010) then igvtools ‘toTDF’ option, respectively, and used for visualization with IGV2. Read distribution around (RXR) peak summits was calculated within 51×30-nt bins by annotatePeaks.pl with -hist, -ghist options (HOMER). Read distribution (RD) plots were visualized by Java TreeView; histograms and box plots were visualized by GraphPad Prism. For box plots, coverage values of the summits used as center in the RD plots were used to plot the distribution of enrichments.
ChIP (Chromatin immunoprecipitation)
ChIP was performed essentially as previously described (Daniel et al., 2014b), (Daniel et al., 2014a). Libraries were prepared either with Ovation Ultralow Library Systems (Nugen) or TruSeq ChIP library systems (Illumina) according to the manufacturer’s instructions. The following antibodies were used: IgG (Millipore, 12–370), RXR (sc-774), P300 (sc-585), PU.1 (sc-352), RAD21 (ab992), STAT6 (sc-981), PPARγ (Perseus #PP- A3409A), RNAPII-pS2 (Ab5095). Primer sequences are available upon request.
ChIP-seq analysis
The primary analysis of ChIP-seq-derived raw sequence reads has been carried out using our ChIP-seq analysis command line pipeline (Daniel et al., 2014) (Daniel et al., 2018) similarly as described for the ATAC-seq analysis. Peaks were predicted by MACS2, and artifacts were removed by BEDTools according to the blacklist of ENCODE. Motif enrichment analyses of the +/−50bp vicinity of the highest RXR peak summits (up to 1000) were performed by findMotifsGenome.pl using -mask, -len 10,12,14,16, -bits, -preparse, and -homer2 parameters (HOMER).
Three RXR ChIP-seq replicates derived from the BMDMs differentiated in the presence or absence of IL-4 were analyzed by DiffBind v1.0.9: consensus peak set was formed from those peaks predicted from at least two of six samples. Peaks without (Cluster I.) or with significant induction (p<0.05) upon IL-4 treatment (Cluster II.) were served as the basal point of further comparisons (e.g. long and short-term polarization: ATAC-seq, RXR and PPARγ ChIP-seq; and time-course: STAT6, RXR, P300 and RAD21 ChIP- seq).
Correlation plots for PPARγ, P300, RAD21 and RNAPII-pS2 density for the selected conditions were generated based on RPKM (Reads Per Kilobase per Million mapped reads) values calculated on Cluster II. RXR peaks. For PPARγ, P300 and RAD21 proteins summit +/−150-bp regions, for RNAPII-pS2 summit +/−500-bp regions were used to count unique reads. Scatter plots show median normalized RPKM values, heat maps show Pearson correlation coefficients calculated between the different conditions and replicates.
RD plots, histograms and box plots were generated similarly as described for the ATAC- seq analysis, except for the RNAPII-pS2 box plot (Fig. S2A) showing median normalized RPKM values on those peak sets determined by GRO-seq as described below.
RNAPII-pS2 abundance on gene bodies (using mm10 RefSeq annotation) was calculated and tested using package Rsubread and edgeR (p<=0.05 and FC>=1.5), respectively.
Global Run-On sequencing
Global Run-On sequencing and library preparation was performed as described earlier (Daniel et al., 2014) with limited modifications. Cells were lysed in the following lysis buffer: 10mM Tris-HCl pH7.4, 2mM MgCl2, 3mM CaCl2, 0.5% IGEPAL, 10% Glycerol, 1mM DTT.
After nuclei isolation run-on reactions were performed for 5 minutes at 30C. Run-on RNA were pulled down with Br-U antibody coated agarose beads and washed extensively.Libraries were generated from two biological replicates using NEBNext Small RNA Library Prep set for Illumina. Bone marrow-derived macrophages were polarized with IL-4 for 24 hours or left untreated, then cells were exposed to RSG and Veh (vehicle-DMSO:Ethanol) for one additional hour. Fragment distribution of libraries was assessed with Agilent Bioanalyzer and libraries were sequenced on a HiSeq 2500 platform.
GRO-seq analysis
The primary analysis of GRO-seq-derived raw sequence reads has been carried out similarly as detailed for ATAC-seq. Bedgraph files were generated with makeUCSCfile using ‘-fsize 1e50’, ‘-fragLength 120’, -noadj and ‘-style chipseq’ parameters, strand- specifically using -strand ‘+’ or ‘-’ -neg parameters separately and then uniting and sorting by coordinates (HOMER and UNIX commands).
Median normalized RPKM value for each protein coding transcript variant was calculated by counting the unique reads on the - at least 1-kb and up to 10-kb - nonoverlapping 5’ region of the transcripts. Transcript variants showing the highest expression based on the mathematical mean of all samples were used for filtering genes with changing expression upon IL-4 and RSG treatment. Genes showing at least 10% and 0.25 RPKM change in both replicates upon treatment were considered as regulated. RXR and PPARγ co-bound regions within the 100-kb vicinity of the TSS of regulated genes were applied also for an expression analysis. In the case of intergenic regions, the RXR peak summit +/−1kb was used to measure enhancer transcription, while in intronic regions, only the antisense reads of the upstream 1-kb region were included in the calculation. Enhancer transcripts of 312 regions could not be measured because of the overlap with promoters or multiple genes. As enhancers show much lower expression as compared to the genes, the merge of replicates was used for the determination of the upper second percentile normalized RPKM values, and if 2 of 4 conditions showed any number of reads at a region, we considered it expressed. Regulated genes with expressed enhancers showing the same direction of change were called directly regulated. Genes showing at least 1.3-fold change were applied for KEGG pathway analysis. PPARγ/RXR binding sites showing changing expression upon both IL- 4 and RSG treatment, instead of forming little subgroups, were classified to RSG- sensitive enhancers. RNAPII-pS2 density was measured on the same regions as GRO-seq reads except for those regions overlapping with any gene transcripts - because ChIP-seq is not strand-specific.
Expression and annotation analysis for 3T3-L1 cells was done in the same way as for BMDM cells. RXR:PPARγ “co-peaks” overlapping between BMDM and 3T3-L1 cells were visualized proportionally by VennMaster.
RNA-seq
Wild type and Pparg −/− macrophages were differentiated in the presence of M-CSF using L929 cell supernatants for 6 days on 15-cm dishes. On the 6th day cells were replated onto 6-well plates at a 2×10⁶ cells/ml density and treated with IL-4 (20ng/ml) for 24 hours or left untreated. After 24 hours, IL-4-containing media was removed from the cells followed by extensive washing steps (3 times with differentiation media) and finally cells received fresh differentiation media for an additional 24 hours (resting period). After the resting period, cells were re-stimulated with IL-4 (20ng/ml) for 3 hours and RNA was collected and isolated with Trizol. Approximately 2.5ug was used for library preparation with TruSeq RNA Sample Preparation Kit (Illumina). Poly-A tailed RNA molecules were pulled down with poly-T oligo attached magnetic beads. Following purification, mRNA was fragmented with divalent cations at 85 °C, and then cDNA was generated by random primers and Superscript II enzyme (Life Technologies). Second strand synthesis was performed followed by end repair, single ‘A’ base addition and ligation of barcode-indexed adaptors to the DNA fragments. Adapter-specific PCRs were performed to generate sequencing libraries. Libraries were size selected with E-Gel EX 2% agarose gels (Life Technologies) and purified by QIAquick Gel Extraction Kit (Qiagen). Libraries were sequenced on HiSeq 2500 instrument. Two biological replicates were sequenced.
RNA-seq analysis
RNA-seq samples were analyzed using an in-house pipeline (Czimmerer et al., 2018). Briefly, the 50-bp raw single reads were aligned using TopHat to the mm10 genome assembly (GRCm38) and only the uniquely mapped reads were kept using ‘--max- multihits 1’ option, otherwise the default parameters were used. SAMtools was used for indexing the alignment files. Coverage density tracks (wig files) for RNA-seq data were generated by igvtools with ‘count’ command and then converted into tdf files using ‘toTDF’ option. Genes with CPM>=10 (at least in one sample) were considered to be expressed. Statistically significant difference was considered as p<0.05 from GLM test using R package edgeR. Pathway analysis was performed with the DAVID (Database for Annotation, Visualization and Integrated Discovery) online tool (https://david.ncifcrf.gov/). Heatmaps were drawn using the R package pheatmap.
Chromosome Conformation Capture (3C)
3C experiments were completed as described previously with minor modifications. Cells were fixed with 2% formaldehyde for 10 minutes. Nuclei were isolated in buffer containing 10mM Tris-HCl pH7.5, 10mM NaCl, 0.2% NP40 (Sigma), and protease inhibitor tablets (Roche). Chromatin was digested with 400U of HindIII (Fermentas) restriction enzyme at 37 °C for 16 hours and for an additional 1 hour with 100U. Chromatin fragments were ligated with 100U of T4 DNA ligase (Fermentas) at 16 °C for 4 hours. After ligation chromatin was decrosslinked overnight at 65 °C. Ligation products were column purified (Roche, High Pure PCR Template Preparation Kit) and DNA concentration was determined by Nanodrop. DNA fragments were submitted to qPCR reactions using TaqMan probes designed to the assayed enhancer region. Tandem primers were designed in the close proximity of the restriction enzyme cutting sites. BAC (329N2) control DNA pool (for Tgm2) was used to determine primer efficiency in each analyzed genomic region and GAPDH was used as a loading control. As a control template for Arg1, restriction enzyme cutting sites used were individually PCR amplified and mixed in an equimolar ratio. Primer and probe sequences are available upon request.
Western Blot
Whole cell lysates were resolved by electrophoresis in 10% polyacrylamide gel and then transferred to Immobilon-P Transfer Membrane. Membranes were probed with anti- PPARγ (81B8), anti-RXR, (sc-553) and anti-GAPDH (sc-32233) antibodies according to manufacturer’s recommendations.
MARCoNI (Microarray Assay for Real-time Coregulator-Nuclear receptor Interaction)
MARCoNI assays were performed by using GST-PPARγ-LBD and GST-ERa-LBD as it has been described previously. Supplementary table II contains the information about the coregulator peptides used in this study and their localization in the proteins’ amino acid chains (Broekema et al., 2018).
In vitro scratch assay
Wild type and Pparg −/− immortalized macrophages were plated at a 3×10⁵ density and were incubated overnight. The next day cells were treated with 20ng/ul IL-4 for 24 hours followed by wash-out and restimulation for an additional 24 hours. At these time points supernatants were collected. HREC cells were plated onto 96-well plates at a density of 2×10⁴ cells per 100ul media. After overnight incubation, scratch assay was performed with the IncuCyte™ Scratch Wound Cell Migration Kit from Essen BioScience. Data analysis was performed with the ImageJ wound healing tool (http://dev.mri.cnrs.fr/proiects/imagei-macros/wiki/WoundHealingTool).
Acute cardiotoxin (CTX) muscle injury
Mice were anaesthetized with isoflurane (adjusted flow rate or concentration to 1.5%) and 50ul of cardiotoxin (12×10−6 M in PBS) (Latoxan) was injected in the tibialis anterior (TA) muscle. Muscles were recovered for flow cytometry analysis at days 1, 2, and 4 post-iniury.
Isolation of macrophages from CTX-injured skeletal muscle
TA muscles from CTX-injured animals were isolated and fascia was removed. Muscles were then dissociated in RPMI containing 0.2% collagenase B (Roche Diagnostics GmbH) at 37Ό for 1 hour and filtered through a 100 um and a 40um filter. CD45+ cells were isolated using magnetic sorting (Miltenyi Biotec). For FACS, macrophages were incubated with Fcy receptor-blocking antibodies and with 10% normal rat serum: normal mouse serum 1:1 mix then stained with a combination of PE-conjugated anti-Ly6C antibody (HK1.4, eBioscience), APC-conjugated F4/80 antibody (BM8, eBioscience) and FITC-conjugated Ly6G antibody (1A8, Biolegend). Ly6Chigh F4/80low macrophages and Ly6Clow F4/80high macrophages were quantified and isolated on a BD FACSAria III sorter as previously described (Varga et al. 2016, Patsalos et al. 2017). In each experiment, samples were processed in parallel to minimize experimental variation. RNA-seq library preparation was carried out as indicated above.
RNA-seq analysis of muscle-derived macrophages
Tophat2 was used to align the reads to the mm10 mouse assembly. Further downstream analysis of the aligned reads was performed using the StrandNGS software (Version 2.8, Build 230243. © Strand Life Sciences, Bangalore, India). There, normalization of the raw read counts was performed using the DeSeq method. One-way ANOVA and Tukey’s post hoc test was performed for the normalized counts of the sorted and isolated Ly6Chigh and Ly6Clow macrophages of days 1, 2 and 4 post CTX. Two replicates were used. Heat maps were drawn using the R package pheatmap.
QUANTIFICATION AND STATISTICAL ANALYSIS
QPCR measurements were presented as means +/− SD. We made at least two biological replicates; performed unpaired (two-tailed) t tests and the differences were considered significant at p<0.05.
ATAC-seq, ChIP-seq and GRO-seq densities presented on box plots were analyzed with (two tailed) paired t test. Statistical parameters are reported in the figure legends and also in the methods section under each specific method description. The numbers of replicates are indicated in the figure legend.
Supplementary Material
Highlights.
Ligand-insensitive PPARγ sites are highly abundant in alternatively polarized MQs
PPARγ is recruited to the genome in a ligand-independent manner upon polarization
Ligand-insensitive PPARγ alters chromatin structure and facilitates IL-4 signaling
Ligand-insensitive PPARγ drives progressive polarization via transcriptional memory
ACKNOWLEDGEMENTS
The authors would like to acknowledge Dr. T. Osborne and members of the Nagy laboratory for discussions and comments on the manuscript. We thank Ms. T. Cseh and Ms. M. Beladi for technical assistance. This work is supported by grants from the NIH R01DK115924 to LN and the Hungarian Scientific Research Fund (OTKA K124298, K126885 and K116855 to LN) and (OTKA PD124843 to GN) and by SBP. Library preparation and bioinformatics analysis was performed at the Center of Clinical Genomics and Personalized Medicine of the University of Debrecen. Next-generation sequencing was performed at the Centre National de Genotypage (CNG) Evry, by Steven McGinn, Anne Boland, Doris Lechner and Marie Therese Bihoreau and supported by the European Sequencing and Genotyping Infrastructure (funded by the European Commission, FP7/2007–2013) under grant agreement no. 26205 (ESGI), as part of the ADIPOMACTX transnational access program and also at the Analytical Genomics Core Facility at the SBP. B.D. is supported by the American Heart Association (AHA) postdoctoral fellowship (17POST33660450). H.L.S. is funded by a Wellstone Muscular Dystrophy Cooperative Center grant (U54-AR-052646) from the NIH, and D.W.H. is funded by a grant from the Muscular Dystrophy Association (MDA549004).
Footnotes
DATA AND SOFTWARE AVAILABILITY
Sequencing data sets are available at the NCBI GEO under accession numbers: GSE115505 and GSE110465. Published data sets used are available under: GSE56745 and GSM340799.
Publisher's Disclaimer: This is a PDF file of an unedited manuscript that has been accepted for publication. As a service to our customers we are providing this early version of the manuscript. The manuscript will undergo copyediting, typesetting, and review of the resulting proof before it is published in its final citable form. Please note that during the production process errors may be discovered which could affect the content, and all legal disclaimers that apply to the journal pertain.
References
- Arnold L, Henry A, Poron F, Baba-Amer Y, van Rooijen N, Plonquet A, Gherardi RK, and Chazaud B (2007). Inflammatory monocytes recruited after skeletal muscle injury switch into antiinflammatory macrophages to support myogenesis. J Exp Med 204, 1057–1069. [DOI] [PMC free article] [PubMed] [Google Scholar]
- Brazda P, Krieger J, Daniel B, Jonas D, Szekeres T, Langowski J, Toth K, Nagy L, and Vamosi G (2014). Ligand binding shifts highly mobile retinoid X receptor to the chromatin-bound state in a coactivator-dependent manner, as revealed by singlecell imaging. Molecular and cellular biology 34, 1234–1245. [DOI] [PMC free article] [PubMed] [Google Scholar]
- Broekema MF, Hollman DAA, Koppen A, van den Ham HJ, Melchers D, Pijnenburg D, Ruijtenbeek R, van Mil SWC, Houtman R, and Kalkhoven E (2018). Profiling of 3696 Nuclear Receptor-Coregulator Interactions: A Resource for Biological and Clinical Discovery. Endocrinology 159, 2397–2407. [DOI] [PubMed] [Google Scholar]
- Buenrostro JD, Giresi PG, Zaba LC, Chang HY, and Greenleaf WJ (2013). Transposition of native chromatin for fast and sensitive epigenomic profiling of open chromatin, DNA-binding proteins and nucleosome position. Nature methods 10, 1213–1218.. [DOI] [PMC free article] [PubMed] [Google Scholar]
- Chandra V, Huang P, Hamuro Y, Raghuram S, Wang Y, Burris TP, and Rastinejad F (2008). Structure of the intact PPAR-gamma-RXR- nuclear receptor complex on DNA. Nature 456, 350–356. [DOI] [PMC free article] [PubMed] [Google Scholar]
- Czimmerer Z, Daniel B, Horvath A, Ruckerl D, Nagy G, Kiss M, Peloquin M, Budai MM, Cuaranta-Monroy I, Simandi Z, et al. (2018). The Transcription Factor STAT6 Mediates Direct Repression of Inflammatory Enhancers and Limits Activation of Alternatively Polarized Macrophages. Immunity 48, 75–90 e76. [DOI] [PMC free article] [PubMed] [Google Scholar]
- Daniel B, Balint BL, Nagy ZS, and Nagy L (2014). Mapping the genomic binding sites of the activated retinoid X receptor in murine bone marrow-derived macrophages using chromatin immunoprecipitation sequencing. Methods in molecular biology 1204, 15–24. [DOI] [PubMed] [Google Scholar]
- Daniel B, Nagy G, Hah N, Horvath A, Czimmerer Z, Poliska S, Gyuris T, Keirsse J, Gysemans C, Van Ginderachter JA, et al. (2014). The active enhancer network operated by liganded RXR supports angiogenic activity in macrophages. Genes & development 28, 1562–1577. [DOI] [PMC free article] [PubMed] [Google Scholar]
- Daniel B, Nagy G, Horvath A, Czimmerer Z, Cuaranta-Monroy I, Poliska S, Hays TT, Sauer S, Francois-Deleuze J, and Nagy L (2018). The IL- 4/STAT6/PPARgamma signaling axis is driving the expansion of the RXR heterodimer cistrome, providing complex ligand responsiveness in macrophages. Nucleic acids research 46, 4425–4439. [DOI] [PMC free article] [PubMed] [Google Scholar]
- Davies LC, Jenkins SJ, Allen JE, and Taylor PR (2013). Tissue-resident macrophages. Nature immunology 14, 986–995. [DOI] [PMC free article] [PubMed] [Google Scholar]
- Dekker J, Rippe K, Dekker M, and Kleckner N (2002). Capturing chromosome conformation. Science 295, 1306–1311. [DOI] [PubMed] [Google Scholar]
- Evans RM, and Mangelsdorf DJ (2014). Nuclear Receptors, RXR, and the Big Bang. Cell 157, 255–266. [DOI] [PMC free article] [PubMed] [Google Scholar]
- Glass CK, and Natoli G (2016). Molecular control of activation and priming in macrophages. Nature immunology 17, 26–33. [DOI] [PMC free article] [PubMed] [Google Scholar]
- Hauser S, Adelmant G, Sarraf P, Wright HM, Mueller E, and Spiegelman BM (2000). Degradation of the peroxisome proliferator-activated receptor gamma is linked to ligand-dependent activation. The Journal of biological chemistry 275, 18527–18533. [DOI] [PubMed] [Google Scholar]
- Heinz S, Benner C, Spann N, Bertolino E, Lin YC, Laslo P, Cheng JX, Murre C, Singh H, and Glass CK (2010). Simple combinations of lineage-determining transcription factors prime cis-regulatory elements required for macrophage and B cell identities. Molecular cell 38, 576–589. [DOI] [PMC free article] [PubMed] [Google Scholar]
- Heydemann A, Ceco E, Lim JE, Hadhazy M, Ryder P, Moran JL, Beier DR, Palmer AA, and McNally EM (2009). Latent TGF-beta-binding protein 4 modifies muscular dystrophy in mice. J Clin Invest 119, 3703–3712. [DOI] [PMC free article] [PubMed] [Google Scholar]
- Huang JT, Welch JS, Ricote M, Binder CJ, Willson TM, Kelly C, Witztum JL, Funk CD, Conrad D, and Glass CK (1999). Interleukin-4-dependent production of PPAR-gamma ligands in macrophages by 12/15-lipoxygenase. Nature 400, 378–382. [DOI] [PubMed] [Google Scholar]
- Huang da W, Sherman BT, and Lempicki RA (2009). Systematic and integrative analysis of large gene lists using DAVID bioinformatics resources. Nature protocols 4,44–57. [DOI] [PubMed] [Google Scholar]
- IJpenberg A, Jeannin E, Wahli W, and Desvergne B (1997). Polarity and specific sequence requirements of peroxisome proliferator-activated receptor (PPAR)/retinoid X receptor heterodimer binding to DNA. A functional analysis of the malic enzyme gene PPAR response element. The Journal of biological chemistry 272, 20108–20117. [DOI] [PubMed] [Google Scholar]
- Issemann I, Prince RA, Tugwood JD, and Green S (1993). The peroxisome proliferator-activated receptor:retinoid X receptor heterodimer is activated by fatty acids and fibrate hypolipidaemic drugs. Journal of molecular endocrinology 11, 37–47. [DOI] [PubMed] [Google Scholar]
- Ivashkiv LB (2013). Epigenetic regulation of macrophage polarization and function. Trends in immunology 34, 216–223. [DOI] [PMC free article] [PubMed] [Google Scholar]
- Kaikkonen MU, Spann NJ, Heinz S, Romanoski CE, Allison KA, Stender JD, Chun HB, Tough DF, Prinjha RK, Benner C, and Glass CK (2013). Remodeling of the enhancer landscape during macrophage activation is coupled to enhancer transcription. Molecular cell 51, 310–325. [DOI] [PMC free article] [PubMed] [Google Scholar]
- Kang K, Park SH, Chen J, Qiao Y, Giannopoulou E, Berg K, Hanidu A, Li J, Nabozny G, Kang K, et al. (2017). Interferon-gamma Represses M2 Gene Expression in Human Macrophages by Disassembling Enhancers Bound by the Transcription Factor MAF. Immunity 47, 235–250 e234. [DOI] [PMC free article] [PubMed] [Google Scholar]
- Markov GV, and Laudet V (2011). Origin and evolution of the ligand-binding ability of nuclear receptors. Molecular and cellular endocrinology 334, 21–30. [DOI] [PubMed] [Google Scholar]
- Martinez FO, and Gordon S (2014). The M1 and M2 paradigm of macrophage activation: time for reassessment. F1000prime reports 6, 13. [DOI] [PMC free article] [PubMed] [Google Scholar]
- Martinez FO, Helming L, and Gordon S (2009). Alternative activation of macrophages: an immunologic functional perspective. Annual review of immunology 27, 451–483. [DOI] [PubMed] [Google Scholar]
- Nagy L, Szanto A, Szatmari I, and Szeles L (2012). Nuclear hormone receptors enable macrophages and dendritic cells to sense their lipid environment and shape their immune response. Physiological reviews 92, 739–789. [DOI] [PubMed] [Google Scholar]
- Odegaard JI, Ricardo-Gonzalez RR, Goforth MH, Morel CR, Subramanian V, Mukundan L, Red Eagle A, Vats D, Brombacher F, Ferrante AW, and Chawla A (2007). Macrophage-specific PPARgamma controls alternative activation and improves insulin resistance. Nature 447, 1116–1120. [DOI] [PMC free article] [PubMed] [Google Scholar]
- Ostuni R, Piccolo V, Barozzi I, Polletti S, Termanini A, Bonifacio S, Curina A, Prosperini E, Ghisletti S, and Natoli G (2013). Latent enhancers activated by stimulation in differentiated cells. Cell 152, 157–171. [DOI] [PubMed] [Google Scholar]
- Palmer CN, Hsu MH, Griffin HJ, and Johnson EF (1995). Novel sequence determinants in peroxisome proliferator signaling. The Journal of biological chemistry 270, 16114–16121. [DOI] [PubMed] [Google Scholar]
- Park SH, Kang K, Giannopoulou E, Qiao Y, Kang K, Kim G, Park-Min KH, and Ivashkiv LB (2017). Type I interferons and the cytokine TNF cooperatively reprogram the macrophage epigenome to promote inflammatory activation. Nature immunology 18, 1104–1116. [DOI] [PMC free article] [PubMed] [Google Scholar]
- Patsalos A, Pap A, Varga T, Trencsenyi G, Contreras GA, Garai I, Papp Z, Dezso B, Pintye E, and Nagy L (2017). In situ macrophage phenotypic transition is affected by altered cellular composition prior to acute sterile muscle injury. The Journal of physiology 595, 5815–5842. [DOI] [PMC free article] [PubMed] [Google Scholar]
- Peters JM, Tedeschi A, and Schmitz J (2008). The cohesin complex and its roles in chromosome biology. Genes & development 22, 3089–3114. [DOI] [PubMed] [Google Scholar]
- Piccolo V, Curina A, Genua M, Ghisletti S, Simonatto M, Sabo A, Amati B, Ostuni R, and Natoli G (2017). Opposing macrophage polarization programs show extensive epigenomic and transcriptional cross-talk. Nature immunology 18, 530–540. [DOI] [PMC free article] [PubMed] [Google Scholar]
- Qiao Y, Giannopoulou EG, Chan CH, Park SH, Gong S, Chen J, Hu X, Elemento O, and Ivashkiv LB (2013). Synergistic activation of inflammatory cytokine genes by interferon-gamma-induced chromatin remodeling and toll-like receptor signaling. Immunity 39, 454–469. [DOI] [PMC free article] [PubMed] [Google Scholar]
- Schneider C, Nobs SP, Kurrer M, Rehrauer H, Thiele C, and Kopf M (2014). Induction of the nuclear receptor PPAR-gamma by the cytokine GM-CSF is critical for the differentiation of fetal monocytes into alveolar macrophages. Nature immunology 15, 1026–1037. [DOI] [PubMed] [Google Scholar]
- Soccio RE, Li Z, Chen ER, Foong YH, Benson KK, Dispirito JR, Mullican SE, Emmett MJ, Briggs ER, Peed LC, et al. (2017). Targeting PPARgamma in the epigenome rescues genetic metabolic defects in mice. The Journal of clinical investigation 127, 1451–1462. [DOI] [PMC free article] [PubMed] [Google Scholar]
- Szanto A, Balint BL, Nagy ZS, Barta E, Dezso B, Pap A, Szeles L, Poliska S, Oros M, Evans RM, et al. (2010). STAT6 transcription factor is a facilitator of the nuclear receptor PPARgamma-regulated gene expression in macrophages and dendritic cells. Immunity 33, 699–712. [DOI] [PMC free article] [PubMed] [Google Scholar]
- Step SE, Lim HW, Marinis JM, Prokesch A, Steger DJ, You SH, Won KJ, and Lazar MA (2014). Anti-diabetic rosiglitazone remodels the adipocyte transcriptome by redistributing transcription to PPARgamma-driven enhancers. Genes & development 28, 1018–1028. [DOI] [PMC free article] [PubMed] [Google Scholar]
- Tang Q, Chen Y, Meyer C, Geistlinger T, Lupien M, Wang Q, Liu T, Zhang Y, Brown M, and Liu XS (2011). A comprehensive view of nuclear receptor cancer cistromes. Cancer research 71, 6940–6947. [DOI] [PMC free article] [PubMed] [Google Scholar]
- Tontonoz P, and Spiegelman BM (2008). Fat and beyond: the diverse biology of PPARgamma. Annual review of biochemistry 77, 289–312. [DOI] [PubMed] [Google Scholar]
- Varga T, Mounier R, Patsalos A, Gogolak P, Peloquin M, Horvath A, Pap A, Daniel B, Nagy G, Pintye E, et al. (2016). Macrophage PPARgamma, a Lipid Activated Transcription Factor Controls the Growth Factor GDF3 and Skeletal Muscle Regeneration. Immunity 45, 1038–1051. [DOI] [PMC free article] [PubMed] [Google Scholar]
- Welch JS, Ricote M, Akiyama TE, Gonzalez FJ, and Glass CK (2003). PPARgamma and PPARdelta negatively regulate specific subsets of lipopolysaccharide and IFN-gamma target genes in macrophages. Proceedings of the National Academy of Sciences of the United States of America 100, 6712–6717. [DOI] [PMC free article] [PubMed] [Google Scholar]
Associated Data
This section collects any data citations, data availability statements, or supplementary materials included in this article.