

Abstract
Background
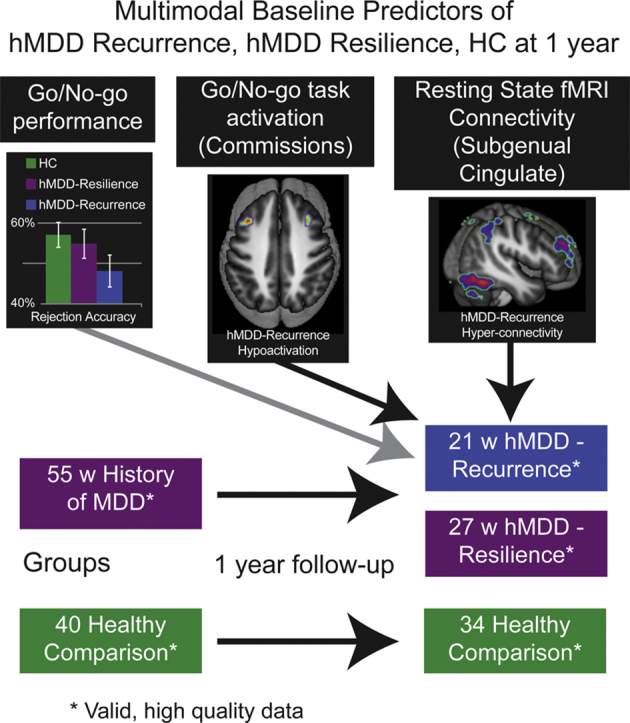
Major Depressive Disorder (MDD) is a prevalent, disruptive illness. A majority of those with MDD are at high risk for recurrence and increased risk for morbidity and mortality. This study examined whether multimodal baseline (and retest) Cognitive Control performance and neuroimaging markers (task activation and neural connectivity between key brain nodes) could differentiate between those with and without future recurrence of a major depressive (MD) episode within one year. We hypothesized that performance and neuroimaging measures of Cognitive Control would identify markers that differ between these two groups.
Methods
A prospective cohort study of young adults (ages 18–23) with history (h) of early-onset MDD (N = 60), now remitted, and healthy young adults (N = 49). Baseline Cognitive Control measures of performance, task fMRI and resting state connectivity (and reliability retest 4–12 weeks later) were used to compare those with future recurrence of MDD (N = 21) relative to those without future recurrence of MDD (N = 34 with resilience). The measures tested were (1) Parametric Go/No-Go (PGNG) performance, and task activation for (2) PGNG Correct Rejections, (3) PGNG Commission errors, and (4 & 5), resting state connectivity analyses of Cognitive Control Network to and from subgenual anterior cingulate.
Results
Relative to other groups at baseline, the group with MDD Recurrence had less bilateral middle frontal gyrus activation during commission errors. MDD Recurrence exhibited greater connectivity of right middle frontal gyrus to subgenual anterior cingulate (SGAC). SGAC connectivity was also elevated in this group to numerous regions in the Cognitive Control Network. Moderate to strong ICCs were present from test to retest, and highest for rs-fMRI markers. There were modest, significant correlations between task, connectivity and behavioral markers that distinguished between groups.
Conclusion
Markers of Cognitive Control function could identify those with early course MD who are at risk for depression recurrence. Those at high risk for recurrence would benefit from maintenance or preventative treatments. Future studies could test and validate these markers as potential predictors, accounting for sample selection and bias in feature detection.
Acronyms: CC, CCN; Cognitive Control, Cognitive Control Network; SEN, Salience and Emotion Network; hMDD, history of Major Depressive Disorder; PGNG, Parametric Go/No-Go Test; ICC, Intraclass Correlation Coefficient; ROI, region of interest; SGAC, subgenual anterior cingulate; rs-fMRI, resting state functional magnetic resonance imaging; MFG, middle frontal gyrus; UM, University of Michigan; UIC, University of Illinois at Chicago; PCIT, Percent Correct Inhibition Trials; HDRS, Hamilton Depression Rating Scale
Graphical abstract
Highlights
-
•
Tools are needed to increase identification of MDD recurrence
-
•
Cognitive control behavior and depression symptoms have been predictive of recurrence in prior studies, but with low accuracy
-
•
In remitted Major Depressive Disorder, those who will go on to have future depressive episodes differed in cognitive control activation and connectivity
-
•
Symptoms, performance, task activation, and seed-based connectivity can contribute to identification of risk for recurrence
1. Introduction
Major Depressive Disorder (MDD) is a highly prevalent disease, affecting 1 in 6 throughout the lifespan. Approximately 50–70% of those with a history (h) of MDD will experience a recurrence (Greden, 2004; Klerman and Weissman, 1992; Levinson et al., 2007; Kendler et al., 2006). Yet, little is known about how to identify those with likelihood of wellness (maintained remission/resilience) versus risk for illness (recurrence) over time. Due to an estimated cost of depression - a half billion dollars per year in the United States alone - and heightened risk for morbidity and mortality, early identification of recurrence is imperative (Greenberg et al., 1993). The ability to engage in proactive, preventative treatments is limited by the lack of available prediction tools in clinical practice. Development of prediction tools is in line with the NIH precision medicine initiative. For example, the clinical decision to continue or discontinue anti-depressant treatment after a first episode is currently random. The clinician balances decision making between potential side effects of medications versus significant treatment costs of psychotherapy and/or medications. In clinical work, decision trees are very weak to non-existent (most used sequenced treatment algorithms (Crismon et al., 1999)), as current risk predictors such as residual depression symptoms, comorbid anxiety, and prior episodes are limited and often non-significant (Steinert et al., 2014; Bockting et al., 2015; Berwian et al., 2017; Kovacs et al., 2016; Chekroud et al., 2017; Chekroud et al., 2016).
At the biological and cognitive level, the progress toward defining the underlying features of MDD has been steady. However, heterogeneity in MDD continues to be a challenge for identifying risk features and subgroups. Some potential key results in MDD include diminished reward anticipation and responsivity (anhedonia), enhanced responsiveness to aversive and threatening stimuli (anxiety), and diminished capacity for regulation (e.g., Cognitive Control) of negative emotions (Langenecker et al., 2014). Major brain networks that appear to underlie and potentially sustain the depressive state include the Salience and Emotion Network (SEN; linked to sadness, negative affect, exaggerated response to threat), and the Cognitive Control Network (CCN; related to attention, set-shifting, regulation, and working memory). The SEN and CCN are based on intrinsic network parcellations (Jacobs et al., 2016a; Yeo et al., 2011; Kaiser et al., 2015).
At this point, it remains unclear which disruptions in these networks and processes increase risk for MDD, or if they instigate or perpetuate the recurrence of MDD. This challenge is likely due to the heterogeneous presentation of symptoms and disease course of MDD at the individual and subgroup levels (Lara et al., 2006; Winokur and Coryell, 1992; Cassano et al., 1992). Indeed, surprisingly few studies have employed cognitive and imaging markers of recurrence. Results to date have been quite modest, if encouraging. For example, cross-hemispheric SGAC connectivity distinguished resilient from recurrent MDD, but only in an ROI analysis (Workman et al., 2017). In addition, the direction of the result was difficult to understand, as the resilient group was most different from the healthy control group, although this could certainly represent compensation. Likewise, in an overlapping sample, hyperconnectivity of subgenual anterior cingulate (SGAC) psychophysiological interaction analyses during a self-blaming task was modestly predictive (75% accuracy) of recurrence (Lythe et al., 2015). Another recent study demonstrated better prediction of clinical outcomes (including recurrence), with right anterior cingulate volume and clinical data predicting 52% of variance in long term depression scores (Serra-Blasco et al., 2016). Yet, this level of accuracy is still not at the level of clinical precision needed for use in clinical decision making, and costs and technical challenges to integration of imaging tools would still be barriers to implementation. Notably, prediction studies using clinical and demographic measures are also able to achieve statistical significance, with accuracies ranging from 51% to 64%, including a recent study demonstrated modest and replicable prediction of recurrence with Hamilton Depression scores (Chekroud et al., 2016; Williams et al., 2015). More work is still needed to identify tools that might aid in prospective identification of individuals who are at high risk for recurrence - for sample selection into clinical trials, or pragmatic decisions about stopping or maintaining treatment in clinical care.
Broadly, here we measure Cognitive Control efficiency as a marker of prospective recurrence, and it is measured using levels of performance, task-based activation with fMRI (brain regions that increase blood flow during specific behaviors), and resting state (rs)-fMRI. rs-fMRI captures temporal correlations in blood flow across brain regions, in relation to the seed region, thought to be a measure of synchronization of neural nodes within a network. In the present study, it is hypothesized that Cognitive Control markers are all negative markers for future depressive episodes (Peters et al., 2017; Langenecker et al., 2007a) because they reflect the capacity to regulate negative mood states and increase problem-solving flexibility and effectiveness. To minimize sources of heterogeneity, we assessed unmedicated individuals early in the course of MDD who were currently in the remitted state and within a discrete age range of 18–23 (Peters et al., 2017). We hypothesized that poorer Cognitive Control performance and less task-induced CCN activation would be present in the group of individuals with history of MDD and future recurrence (MD Recurrence) relative to those without future illness (MDD Resilience) and Healthy Comparison participants. We also assessed differences between these groups with seed-based rs-fMRI connectivity of key network nodes involved in MDD within the CCN (inefficiency via lower connectivity of right middle frontal gyrus node, R MFG) and SEN (interference via higher connectivity of left subgenual anterior cingulate node, L SGAC). Reliability in these assessments was also measured at 4–12 weeks.
2. Methods and materials
2.1. Participants
In the present sample, 109 individuals (49 Healthy Comparison, 60 with a history of history of (h) MDD and currently in remitted state) between ages 18 and 23 were enrolled the study. All study procedures were approved by the University of Michigan (UM) and the University of Illinois at Chicago (UIC) IRBs. Participants were screened over the phone by trained research assistants and provided informed consent in accordance with the Declaration of Helsinki. Participants were recruited from the community in two sites: Ann Arbor, Michigan (of the 41 eligible adults that were initially enrolled from 2010 to 2012, 38 completed the longitudinal follow up) and Chicago, Illinois (of the 82 adults who initially enrolled between 2012 and 2015, 61 completed the longitudinal follow-up), or 80.5% completion of study measures and follow-up interviews.
History of MDD diagnosis and further inclusionary/exclusionary criteria were determined by the Diagnostic Interview for Genetic Studies, which were conducted by trained masters- and doctoral level interviewers (Nurnberger Jr. et al., 1994). Diagnosis at baseline was also confirmed by parental/family interview (i.e. modified Family Interview for Genetic Studies) or treatment records. Participants with a history of MDD (hMDD) had one to five prior episodes of MDD but none in the past month (mode = 1, mean time well >2 years, Table 1). hMDD participants could have a comorbid anxiety diagnosis, and were free of psychotropic medication use in the past three months. Exclusionary criteria for both groups were current or past psychotic symptoms, current or past bipolar disorder or mania, family history of psychosis, history of suicidal attempts or ideation in the past six months, and substance abuse (last six months) and dependence (last 2 years). Healthy comparison participants had no personal history of any psychiatric disorder (all but 3 had negative family history for psychiatric illness).
Table 1.
Demographic and Clinical Information for Healthy Comparison and those with history of Major Depressive Disorder (hMDD).⁎
| Healthy Comparison (n = 39) | hMDD - Resilience (n = 34) | hMDD - Recurrence (n = 21) | |
|---|---|---|---|
| Mean age, years (SD) | 21.03 (1.54) | 21.44 (1.48) | 21.00 (1.38) |
| Females, n (%) | 23 (65.71) | 22 (81.48) | 14 (66.67) |
| Mean education, years (SD) | 14.83 (1.25) | 14.70 (1.38) | 14.33 (1.15) |
| Mean IQ estimate (SD) | 106.69 (9.11) | 106.76 (7.05) | 107.45 (10.56) |
| Mean HDRS (SD)a | 0.49 (1.07) | 2.09 (2.70) | 4.23 (4.42)^ |
| History of co-morbid anxiety, n (%)a | 0 (0) | 9 (33.33) | 7 (33.33) |
| Past psychiatric medication, n (%)a | 0 (0) | 8 (29.63) | 9 (42.86) |
| Mean number of MDEs (SD)a | 0 (0) | 1.85 (1.29) | 2.43 (2.52) |
| Mean age of first onset, years (SD) | – | 16.30 (3.68) | 16.76 (2.47) |
| Global Assessment of Functioning (SD)b | 92.32 (4.56) | 83.57 (8.95) | 80.61 (9.25) |
p < .05.
Healthy Comparison < all hMDD.
Healthy Comparison > all hMDD; hMDD = history of Major Depressive Disorder, currently in remission.
Note that two individuals had elevated HDRS at time of DIGS, but were not tested or scanned until HDRS was below 13.
Participants completed parts of the Parametric Go/No-Go Test (PGNG) during fMRI, a resting state fMRI scan, and self-report questionnaires (Jacobs et al., 2016a; Peters et al., 2017). The PGNG (Supp. Fig. 4) is a validated, reliable inhibitory control test with normative data (Langenecker et al., 2007b; Votruba et al., 2013) that requires minimal working memory load, relies on contextual shifts in correct responses, and elicits a high number of errors so that changes in blood flow can be modeled for both successful (Rejections) and unsuccessful (Commissions) Cognitive Control responses during fMRI. It involves a serial stream of successively presented lower case letters, each for 600 ms, with 0 ms ISI. Across all four runs, the jittered delay between Go (380 total Go events, M jitter = 2209.5 ms, SD = 1258.4 ms) and No-go events (52 total No-go events, M jitter 11,224.5 ms, SD 4531.2 ms) has been reported in prior studies and enables event-related deconvolution of hemodynamic signals for correct go responses (Targets), Correct Rejections and Commissions. Percent Correct Inhibition Trials (PCIT) is a ratio of Correct Rejections in relation to total number of valid No-go trials (Correct Rejections plus Commissions). Three runs of the most difficult level were included to increase the number of Commission Errors, with decreased time. Commission response time is also a variable of interest. Participants were compensated $120 for completion of the fMRI scan and PGNG task (Table 1 for demographic and clinical information). The consort diagram includes the flow of participants through the study and procedures (Supp Fig. 2). Performance differences and stability have been reported previously with this sample for this test (Peters et al., 2017).
Reliability assessment (test-retest of individual differences) was completed between 4 and 12 weeks after the initial assessment. Time between the two measurement dates was an average of 57.6 (SD = 39.8) days and did not differ between groups or by site.
Between 52 and 72 weeks later, participants completed the Longitudinal Interval Follow-Up Evaluation (Geller et al., 2002) by phone with trained masters-level interviewers, for which they were compensated an additional $80. Recurrence of MDD (N = 21 hMDD-Recurrence) was defined as the presence of an MD episode in the follow-up period, or resilience (N = 34 hMDD-Resilience), Supp. Fig. 3. Two from the hMDD group were recruited in the active state and followed to the point of remission for 4 weeks prior to completing study measures. Three hMDD had recurrence before retest had been competed (No Healthy comparisons had a first episode before retest had been completed). Exclusion of these 3 hMDD-Recurrence subjects did not change any results.
2.2. fMRI acquisition parameters and preprocessing
Briefly, resting state data were acquired during an eight-minute eyes-open resting state scan at 3.0 T at UM or UIC using a GE scanner (see supplement for sequences). Resting state analyses with an overlapping subset of these participants have been included in several prior reports including presence of past disease (Deldonno et al., 2017; Jacobs et al., 2014; Bhaumik et al., 2016), reliability and links to affective biases (Stange et al., 2017), symptoms and number of episodes (Jacobs et al., 2016b), relationship to memory performance (Rao et al., 2016), relationship to identification of facial emotions (Jenkins et al., 2017).
Seed-based cross-correlation analysis of functional connectivity was computed in SPM8 for rs-fMRI, according to prior published steps. Briefly, data were: 1. Detrended, 2. mean-centered, 3. white matter and cerebral spinal fluid signals were regressed out (Behzadi et al., 2007), 4. top five principal components from motion parameters were regressed out (Jo et al., 2013), and 5. band-pass filtered over (0.01–0.10 Hz). Correlation coefficients were calculated between mean time course for seed regions and all other voxels of the brain, resulting in a 3-dimensional correlation coefficient image (r image). These r images were transformed to z scores using a Fisher transformation. Resulting z images were used in two-sample Student t-tests implemented in SPM8.
fMRI event-related data was collected during the PGNG, according to past parameters, but with only low (one 4 min run) and high (three 4 min runs, excluding moderate difficulty levels) levels of difficulty to increase the ratio of Commission Errors to Correct Rejections (Langenecker et al., 2007b). Preprocessing was the same procedure for images collected at both sites and both tasks, including removal of those with excessive movement (Jacobs et al., 2016a; Peters et al., 2017; Crane et al., 2016). The three groups did not differ in any movement parameters for rs-fMRI connectivity or PGNG during fMRI (ps > 0.05, see Supplement for full details).
2.3. Statistical analyses and estimates for multiple comparisons adjustments
Whole brain adjustment of alpha was estimated for each analysis at p < .016 by conducting 10,000 Monte Carlo simulations in 3dClustSim (vers 2/2016) to determine a joint threshold of height and extent (p < .005, cluster extent of 440 mm3), for family-wise error of 0.096 for six comparisons. Sex, site, and movement were covariates of no interest in each model. The proportion of subjects from each group was equivalent across sites (X = −0.69, p = .71). Power was initially estimated based upon an even distribution or those with and without recurrence, and resulted in ability to detect small to moderate effect sizes. As we had fewer with recurrence, power was reduced and only medium or larger effect sizes were detectable.
Reliability (completed between 4 and 12 weeks later) was assessed using intraclass correlation coefficients (ICC), two way random, using all relevant clusters for a given contrast, collapsed across regions and over time. The two-way random ICC strategy (within subject reliability) was to estimate how well the combined measures estimate some relevant latent variable (brain regions that represent latent variables for classification, further description is included in the supplement). The supplement provides some examples of parameter estimates - how the markers could be used as predefined features in future studies for prediction of MDD Recurrence.
3. Results
3.1. Behavioral performance on the parametric Go/No-Go Test (Supp Fig. 5)
Groups did not differ in Commission Error Response Time (F(2, 80) = 0.04, p = .97, added R2 = 0.02, or PCIT (F(2, 80) = 1.12, p = .33, added R2 = 0.01, Supp. Fig. 5).
3.2. Failed regulation (commission errors of No-Go lures)
Primary activation for Commissions in Healthy Comparisons includes bilateral anterior insula and dorsal anterior cingulate, as well as bilateral DLPFC. hMDD-Recurrence had lower activation of bilateral MFG for Commissions compared to the Healthy Comparison group and the hMDD-Resilience group (ps < 0.005, mm3 > 440, added R2 = 0.14, Fig. 1, Panels B and C. Table 2 and Supp. Fig. S6 also illustrates differences between Healthy Comparisons and hMDD-Recurrence groups in other regions). ICC (two-way random), including time 1 and time 2 measurements for these same two clusters was strong (0.69, F = 3.17, p < .0001).
Fig. 1.
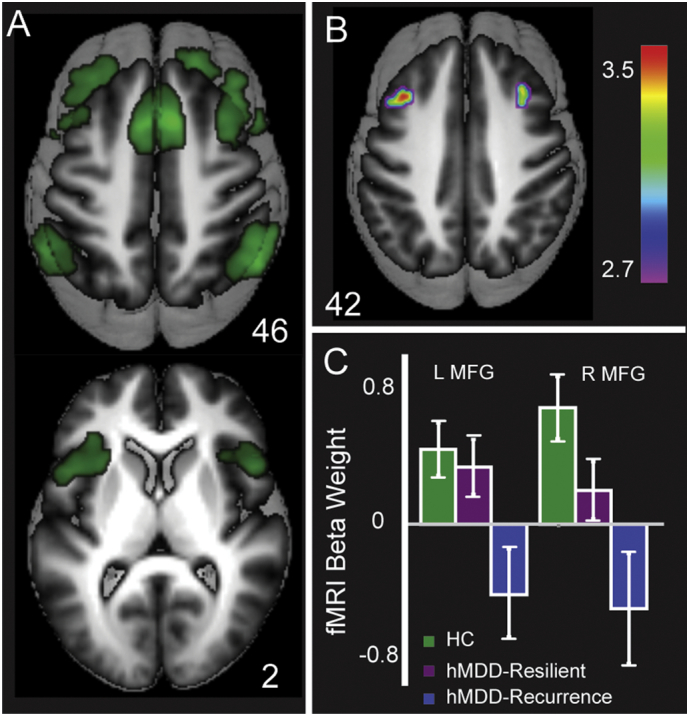
Activation for Commission errors for Healthy Comparisons (Green) in Panel A (t > 10), primarily in the Salience and Emotion Network including dorsal anterior cingulate and anterior insula (Fig. 1, Panel A), and also within the Cognitive Control Network (MFG, Inferior Parietal Lobule). Healthy Comparisons and hMDD-Resilience exhibited greater activation than hMDD-Recurrence in bilateral MFG (Panel B). Mean activation beta weights for MFG clusters are portrayed in Panel C. Error bars reflect SEE. MFG, Middle Frontal Gyrus.
Table 2.
Significantly different activation during Commissions and Rejections on the Parametric Go/No-Go Test in Healthy Comparisons, hMDD-Resilience and hMDD-Recurrence.
| Contrast | Brain Region | Peak MNI Coordinates |
k | T-value | ||
|---|---|---|---|---|---|---|
| x | y | z | ||||
| Healthy Comparison & hMDD-Resilience < hMDD-Recurrence | ||||||
| Commissions | Cerebellum Declive | 20 | −66 | −24 | 81 | 3.37 |
| Amygdala ROI | 22 | −6 | −24 | 47 | 2.45 | |
| Rejections | Amygdala ROI | 16 | −8 | 20 | 76 | 2.57 |
| −22 | 4 | −20 | 19 | 2.51 | ||
| Healthy Comparison & hMDD-Resilience > hMDD-Recurrence | ||||||
| Commissions | MFG | 36 | 18 | 42 | 114 | 3.58 |
| −36 | 22 | 36 | 78 | 3.51 | ||
| Rejections | NA | |||||
| Healthy Comparison < hMDD-Recurrence | ||||||
| Commissions | NA | |||||
| Rejections | L SGAC | −4 | 28 | −8 | 57 | 3.54 |
| Healthy Comparison > hMDD-Recurrence | ||||||
| Commissions | MFG | 38 | 16 | 44 | 222 | 4.28 |
| −36 | 22 | 36 | 176 | 3.68 | ||
| IFG | −42 | 26 | 18 | 64 | 3.83 | |
| D ACC | 10 | 22 | 40 | 77 | 3.25 | |
| −8 | 20 | 42 | 79 | 3.16 | ||
| IPL | 54 | −56 | 38 | 133 | 3.57 | |
| −56 | −46 | 44 | 70 | 3.54 | ||
| Rejections | NA | |||||
k: Cluster Size, ROI: Region of Interest, MFG: Middle Frontal Gyrus, IFG: Inferior Frontal Gyrus, D ACC: Dorsal Anterior Cingulate, IPL: Inferior Parietal Lobule, SGAC: subgenual anterior cingulate, NA: no significant clusters, L: Left. For all seven clusters that were greater in Healthy Comparison relative to hMDD-Recurrence, the ICC was 0.88 for all clusters over time (F = 9.01, p < .0001, TWR).
3.3. Regulation (correct rejections of No-Go lures)
Primary activation patterns for Rejections in Healthy Comparisons were in right lateralized regions of the CCN (Fig. 2, Panel A), including right MFG, inferior frontal gyrus, dorsal anterior cingulate, as well as bilateral superior frontal gyrus and supplementary motor area. The hMDD-Recurrence group had greater activation for rejections in left SGAC (p < .005, mm3 > 440, added R2 = 0.04) relative to Healthy Comparisons and hMDD-Resilience groups, as well as in two amygdala regions of interest (p < .05, mm3 > 40, added R2 = 0.04, ROIs defined with Wake Forest PickAtlas, Fig. 2, Panels B and C, including after truncation of one outlier). The Healthy Comparison group had greater activation than the hMDD-Recurrence group in other regions that are described in Table 2. For the three clusters that were greater in hMDD-Recurrence relative to Healthy Comparison group, ICC was strong over time 1 and 2 (0.82, F = 5.65, p < .0001).
Fig. 2.
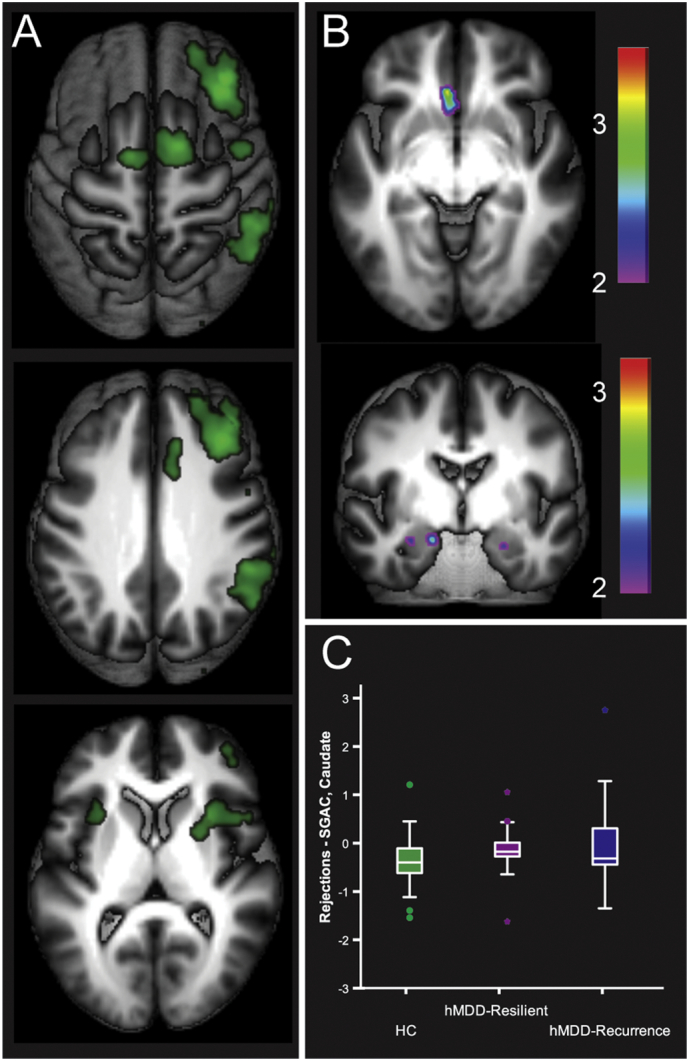
Activation for Correct Rejections for Healthy Comparisons (Green) in Panel A (t > 10), primarily in a right lateralized Cognitive Control Network (Fig. 2, Panel A), and also including the Salience and Emotional Network (anterior insula). hMDD-Recurrence exhibited greater activation relative to Healthy Comparisons and hMDD-Resilience in left subgenual cingulate and bilateral amygdala (ROI, Fig. 2, Panel B). Mean activation beta weights for these clusters are portrayed in Panel C. Error bars reflect SEE.
3.4. Resting state network – cross-network convergence in differentiating those with future recurrence
The PGNG served as an effective probe in eliciting SGAC hyperactivation during successful regulation (Rejections) and MFG hypoactivation during failed regulation trials (Commissions) in hMDD-Recurrence relative to both other groups. We further probed inefficient functioning of those nodes with a parallel analysis using seed-based rs-fMRI using the left SGAC (Margulies et al., 2007; Kelly et al., 2009) and right MFG seeds (Yeo et al., 2011).
3.5. Right middle frontal gyrus connectivity
Right MFG connectivity revealed a bilateral representation of the Cognitive Control network in Healthy Comparison group (Yeo et al., 2011; Stange et al., 2017). There was lower within-network connectivity and higher out-of-network connectivity for hMDD-Recurrence relative to Healthy Comparison and hMDD-Resilience groups. There was greater rs-fMRI connectivity of right MFG in Healthy Comparisons and hMDD-Resilience groups relative to the hMDD-Recurrence group (Fig. 3, Panel B) in right inferior frontal gyrus, left inferior parietal lobule, right substantia nigra, and left globus pallidus (ps < 0.005, mm3 > 440, added R2 = 0.26 also Supp. Fig. S6, Table 3). ICC for all of these clusters across time 1 and time 2 was weak (0.35, F = 1.50, p = .01). There was greater connectivity for hMDD-Recurrence relative to Healthy Comparisons and hMDD-Resilience in SGAC, ventral anterior cingulate, caudate head, superior temporal gyrus and cuneus (ps < 0.005, mm3 > 440, added R2 = 0.33, Fig. 3, Panel C). ICC for all these clusters at time 1 and time 2 was moderate (0.58, F = 2.46, p < .0001).
Fig. 3.
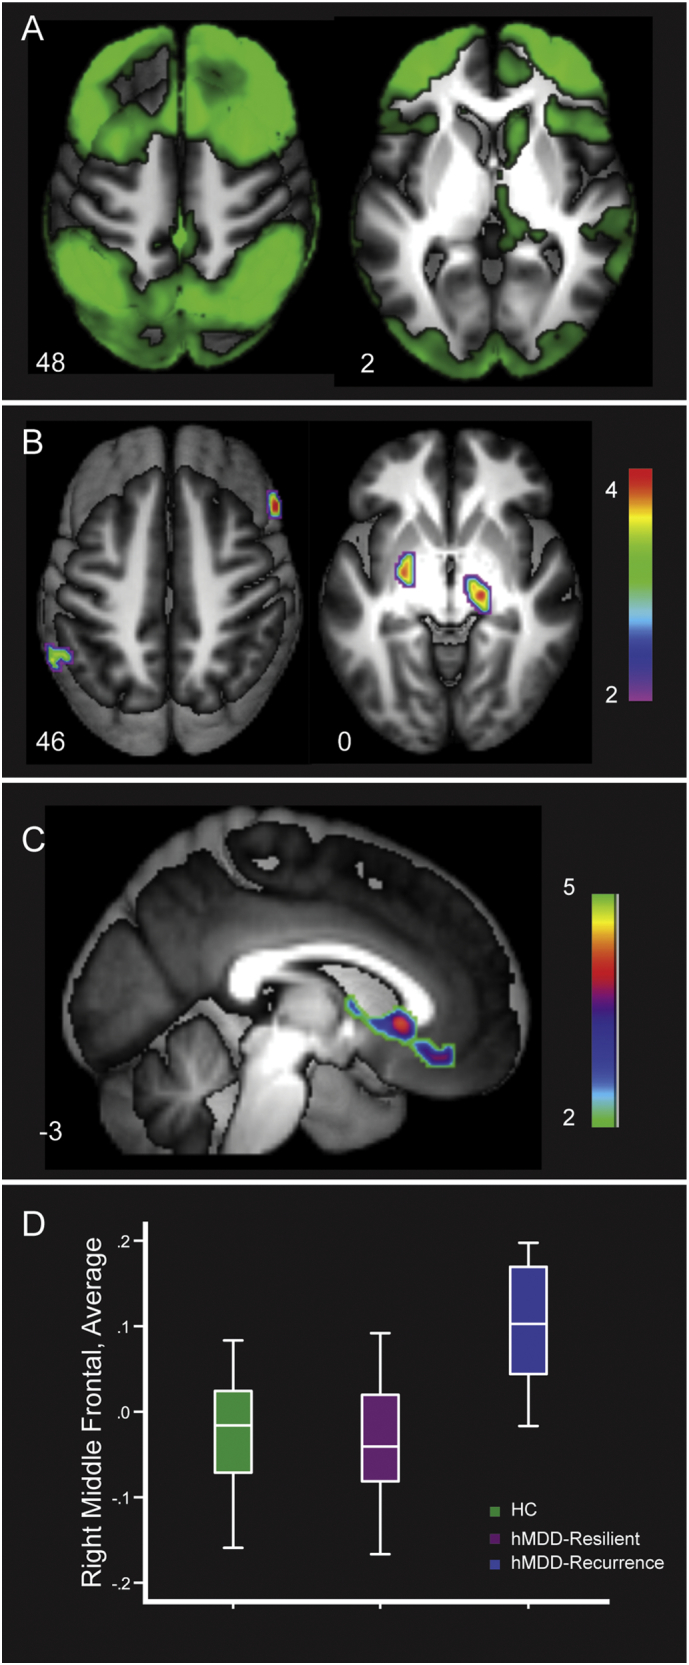
Panel A shows connectivity of right middle frontal gyrus in Healthy Comparisons (green, t > 10), including a fronto-parietal network (Fig. 3, Panel A, bilateral dorsolateral prefrontal cortex, inferior parietal lobule, dorsal anterior cingulate, precuneus, right caudate head). Panel B illustrates regions of greater connectivity in Healthy Comparisons and hMDD-Resilience relative to hMDD-Recurrence. Panel C demonstrates hMDD-Recurrence higher connectivity relative to Healthy Comparisons and hMDD-Resilience. Panel D. Average of regions of differences between hMDD-Recurrence and Healthy Comparison.
Table 3.
Rs-fMRI Connectivity Differences between hMDD subgroups and Healthy Comparison using left subgenual anterior cingulate and right middle frontal gyrus seeds.
| Seed | Region | Location | Peak MNI Coordinates |
k | T-value | ||
|---|---|---|---|---|---|---|---|
| x | y | z | |||||
| Healthy Comparison & hMDD-Resilience < hMDD-Recurrence | |||||||
| SGAC | Frontal | SFG | −18 | 54 | 32 | 86 | 4.12 |
| 16 | 8 | 62 | 56 | 4.04 | |||
| MFG | −36 | 48 | 12 | 425 | 4.23 | ||
| 28 | 8 | 54 | 154 | 3.89 | |||
| 36 | 44 | 24 | 1088 | 4.88 | |||
| SMA | −1 | 4 | 66 | 836 | 6.36 | ||
| Parietal | Precuneus | 8 | −52 | 66 | 474 | 3.59 | |
| −10 | −70 | 56 | 299 | 3.77 | |||
| IPL | −42 | −52 | 52 | 113 | 3.60 | ||
| 52 | −44 | 46 | 332 | 3.67 | |||
| 34 | −58 | 52 | 131 | 3.53 | |||
| Temporal | Fusiform | 38 | −56 | −22 | 1717 | 4.90 | |
| Subcortical | Habenula | 0 | −32 | 4 | 120 | 3.83 | |
| Culmen | −2 | −54 | −24 | 87 | 3.60 | ||
| Cerebellum Crus | −50 | −64 | −26 | 1377 | 4.64 | ||
| −12 | −80 | −28 | 120 | 3.38 | |||
| Cerebellar Tonsil | −16 | −78 | −36 | 60 | 3.60 | ||
| Caudate | 6 | 4 | 2 | 242 | 4.57 | ||
| MFG | Frontal | rMed FG | −2 | 36 | −14 | 81 | 3.27 |
| SGAC | 2 | 18 | −2 | 225 | 5.28 | ||
| Temporal | STG | 68 | −30 | 18 | 168 | 5.04 | |
| MTG | −30 | −62 | 14 | 55 | 3.35 | ||
| Subcortical | Vermis | 2 | −74 | −36 | 57 | 3.52 | |
| Healthy Comparison & hMDD-Resilience > hMDD-Recurrence | |||||||
| SGAC | NA | ||||||
| MFG | Frontal | IFG | 58 | 26 | 12 | 101 | 3.81 |
| Parietal | SMG | −64 | −52 | 32 | 126 | 3.45 | |
| Subcortical | Lateral GP | −24 | −10 | −6 | 56 | 3.59 | |
| Substantia Nigra | 18 | −20 | −6 | 76 | 3.76 | ||
| Healthy Comparison < hMDD-Recurrence | |||||||
| SGAC | Frontal | MFG | 38 | 66 | 18 | 1292 | 5.52 |
| −36 | 50 | 12 | 1143 | 4.94 | |||
| 48 | 6 | 42 | 94 | 3.69 | |||
| SMA | −1 | 4 | 66 | 1222 | 6.13 | ||
| SGAC | −10 | 30 | −4 | 104 | 4.12 | ||
| Parietal | IPL | 34 | −56 | 54 | 852 | 4.51 | |
| −42 | −52 | 54 | 502 | 4.11 | |||
| 40 | −36 | 54 | 256 | 3.99 | |||
| Precuneus | −4 | −82 | 50 | 350 | 4.07 | ||
| Temporal | Fusiform | 38 | −54 | −22 | 2134 | 5.18 | |
| Subcortical | Cerebellar Tonsil | −22 | −52 | −42 | 124 | 4.73 | |
| Cerebellum Crus | −50 | −64 | −26 | 1559 | 4.77 | ||
| Ant Nuc | −10 | −8 | 12 | 745 | 5.81 | ||
| Caud Body | −16 | 2 | 26 | 55 | 3.40 | ||
| MFG | Frontal | SGAC/ | 2 | 20 | −2 | 515 | 5.54 |
| Med FG | 10 | 44 | −10 | 75 | 3.68 | ||
| Temporal | STG | 68 | −30 | 18 | 158 | 4.54 | |
| Healthy Comparison > hMDD-Recurrence | |||||||
| SGAC | Frontal | MFG | 21 | 27 | 27 | 64 | 4.08 |
| Occipital/ Temporal | Cuneus/PHG | −10 | −50 | 8 | 265 | 3.83 | |
| MFG | Parietal | IPL | 36 | −50 | 46 | 160 | 3.55 |
| −54 | −52 | 48 | 140 | 3.26 | |||
| Temporal | Fusiform | 42 | −52 | −16 | 66 | 4.11 | |
k: Cluster Size, ROI: Region of Interest, SFG: Superior Frontal gyrus, MFG: Middle Frontal Gyrus, SMA: Supplementary Motor Area, SGAC: subgenual anterior cingulate, Ant: Anterior, Nuc: Nucleus, Caud: Caudate, rMed FG: rostral Medial Frontal gyrus, STG: Superior Temporal Gyrus, MTG: Middle Temporal gyrus, PHG: Parahippocampal gyrus, GP: Globus Pallidus, IFG: Inferior Frontal Gyrus, IPL: Inferior Parietal Lobule, NA: no significant clusters, SMG: Supramarginal gyrus, R: Right.
3.6. Left subgenual anterior cingulate connectivity
Left SGAC connectivity in the Healthy Comparison group represented a ventral, subcortical and medial temporal network, extending into ventral anterior insula. Group differences were primarily out-of-network and of greater hMDD-Recurrence connectivity to CCN regions relative to hMDD-Resilience and Healthy Comparisons (Fig. 4, Panels B and C). These differences were in bilateral inferior frontal gyrus, MFG, inferior parietal lobule, anterior nucleus of the thalamus, supplementary motor area, precuneus, and posterior inferior temporal gyrus (ps < 0.005, mm3 > 440, added R2 = 0.27, Supp. Fig. S6 shows the mean connectivity differences for each group for these regions and Table 3 lists differences between hMDD-Recurrence and Healthy Comparisons). The ICC for these clusters across time 1 and 2 was high (0.92, F = 13.27, p < .0001).
Fig. 4.
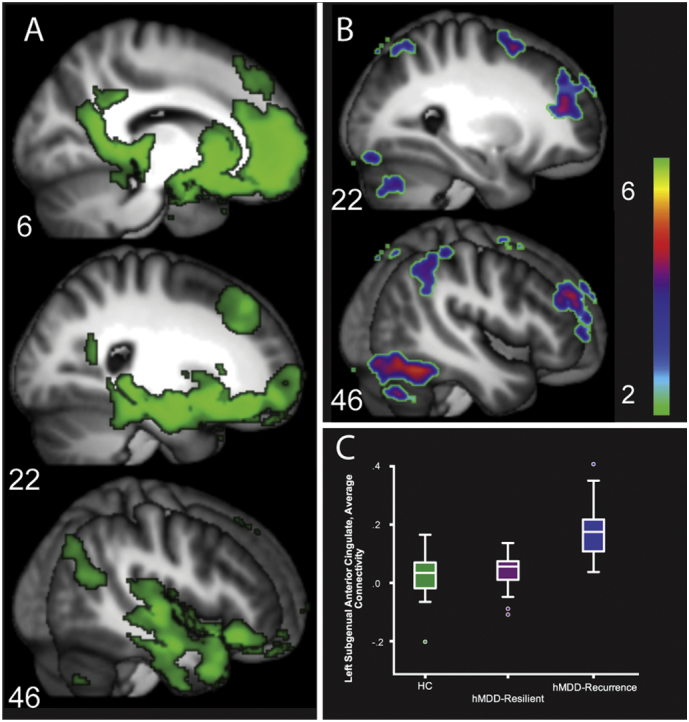
Connectivity of left subgenual anterior cingulate (LSGAC) to the entire brain (Panel A, Healthy Comparisons = Green, t > 10), including rostromedial prefrontal cortex, amygdala, hippocampus and parahippocampal gyrus, and retrosplenial cingulate (Fig. 4, Panel A, Table 3). Regions of greater LSGAC connectivity in hMDD-Recurrence relative to Healthy Comparisons and hMDD-Resilience groups are displayed in Panel B. Boxplot graph representing regions of greater connectivity in hMDD-Recurrence.
3.7. Cross-network convergence in activation and connectivity
Broadly, these results suggest task activation and connectivity for CCN were decreased in hMDD-Recurrence, and that SEN to CCN connectivity was increased (Yeo et al., 2011; Stange et al., 2017). We quantified the degree of CCN and SEN engagement in both task activation and connectivity with post-hoc analyses. We used contrasts between the three groups in right MFG and left SGAC connectivity maps to establish maps of neural connectivity networks. For simplicity, we combined Ventral Attention and Limbic Networks to create a larger SEN and Fronto-Parietal and Dorsal Attention networks to create a CCN (Yeo et al., 2011) based upon the models of Menon and colleagues (Uddin et al., 2010). The % displayed in Supp. Fig. 7 represents the % of voxels that differ in the contrast between HC/hMDD-Resilience and hMDD-Recurrence (negative percentage reflects hMDD-Recurrence less than and positive percentage reflects hMDD-Recurrence greater than Healthy Comparisons and hMDD-Resilience) within the CCN (decreased) and SEN (increased) maps respectively (from Tables 2 and 3). Fig. 5 is an illustration of the relationship of baseline variables (and also retest variables) to hMDD-Recurrence at one year and relationships between measurements (at baseline). The Figure also illustrates the modest, significant, cross-correlations between the variables that differentiated between those with and without future recurrence.
Fig. 5.

Complete model showing relative correlation values (B) for each set of markers. Note that activation and connectivity values are weighted averages over time and across clusters. * Significant correlation at time 1. ^ Significant correlation at both time 1 and time 2. Behavioral performance variables are Commissions Response time and Commissions Accuracy (in blue). Task-based fMRI BOLD signal values are in black for Commission Errors and Correct Rejections. Rs-fMRI connectivity values in relation to remission status, based upon seed, are illustrated in red.
4. Discussion
Measures of Cognitive Control and CCN activation and efficiency were significantly different in those with a future risk for MDD recurrences. These are potentially markers of inefficiency, whether measured by task-based activation or suggested in convergence with resting-state connectivity. On the other hand, they may represent markers of altered network functioning, including of compensation. The markers were generally stable over time, typically more so in the hMDD group. Notably, the disruptions include disrupted engagement of CCN and heightened connectivity of CCN with the SGAC, a key node in the SEN – possibly a marker of interference or increased salience. As illustrated in Fig. 5 (and Supp Fig. 8), the task and connectivity analyses highlight decreased activation of CCN when needed, increased activation of SEN, perhaps when not needed, increased connectivity of middle frontal gyrus to SEN, and increased connectivity of SGAC to CCN, all likely markers of decreased CCN integrity and efficiency. Together, our results suggest that these CCN metrics (Fig. 5) could be tested in models in the future, even if these models are now at the initial development stage (Collins et al., 2015; Steyerberg and Vergouwe, 2014). The goal of this strategy would be to mitigate risk for subsequent episodes through preventative treatments or maintenance treatments. Preventative and maintenance treatment strategies that have been attempted in related work can significantly reduce chances of recurrence (e.g., (Gueorguieva et al., 2017)), however the tools to identify those at increased risk for recurrence have modest odds ratios and predictive value (Gueorguieva et al., 2017; Elkin et al., 1995; Nierenberg et al., 2003; Segal et al., 2003). One possible example would be to use cognitive remediation to adjust and adapt the functioning of the CCN. A recent meta-analysis suggests that mindfulness-based cognitive therapy significantly reduces recurrence of MDD (Kuyken et al., 2015; Kuyken et al., 2016), perhaps via improvements in Cognitive Control circuitry (Chen et al., 2015; Tang et al., 2015).
The Parametric Go/No-Go Test elicited robust activation within networks known to be important for both error detection and Cognitive Control (Garavan et al., 2002; Supekar et al., 2009). Activation and connectivity that differed between those with future recurrence (vs resilience) was observed in a reliable, cross-network fashion. For errors, it was lower activation in CCN regions that differed by future recurrence, even though SEN region engagement is a prototypic error response pattern. This degree of engagement of CCN during errors predicted better performance on the task and was higher in resilient individuals. This suggests that CCN engagement may have facilitated learning and performance improvement, but to a lesser extent in those who are likely to have recurrence of illness. For correct rejections, it was the opposite pattern – engagement of SEN regions in addition to CCN regions, particularly SGAC, was present in those with future recurrence. Finally, despite concerns about clinical specificity of rs-fMRI, cross-network connectivity markers were the most different for those with recurrence within one year (relative to those hMDD with resilience and healthy comparison participants), and had the highest within-sample reliabilities. Here again, heightened connectivity from a CCN seed (MFG) to SEN regions, and of a SEN seed (SGAC) to many CCN regions was evident in those with elevated risk for recurrence. In light of the task-based activation and performance data, Cognitive Control inefficiency and SEN interference appear to be pervasive for those with increased risk for depression recurrence.
Cognitive control functioning, across a number of studies, is related to degree of response to treatments for depression, and even for ability to sustain wellness (Gyurak et al., 2015; Crane et al., 2017; Dawson et al., 2017; Langenecker et al., 2007c; Siegle et al., 2007; Siegle et al., 2012). Surprisingly, little work has been completed on how Cognitive Control functioning might be related to longitudinal course to illness, including recurrence. Salience and emotion tasks have also been heavily represented in the treatment prediction and recurrence literature, with significant albeit relatively modest results (Phillips, 2016; Lemoult et al., 2017). The pattern here, however, is not as clear, for how these networks may be related to future recurrence. If one were to hypothesize an interference model, then SEN to CCN connectivity should be inversely correlated with accuracy, but we see the opposite effect. SEN to CCN connectivity was positively related to commissions activation in bilateral MFG, suggesting some sort of compensation and increased risk for recurrence. In contrast, and consistent with a failed or inefficient compensation model, decreased task activation in CCN was related to risk for recurrence and poorer performance, possibly a marker for chronic, recurrent MDD. Future work could include targeted predictors from both Cognitive Control and emotion processing domains to improve the ability to prospectively identify those at increased risk. Furthermore, we expect that a heterogeneous disorder like depression would have multiple pathologies and subphenotypes (Langenecker et al., 2014). Deep phenotyping across multiple modalities may provide tools to identify chronic, recurrent MDD at an early age.
Limitations for the study include a focus on executive functioning and Cognitive Control to the exclusion of other possible markers. Furthermore, the sample sizes here are modest for differentiating between clinical subtypes of MDD. The sample sizes, combined with effect sizes and statistical adjustments for multiple comparisons, could have led to type II error (e.g., insufficient statistical power). This concern is assuaged to an extent by the use of replication (within sample, retest replication). While the within-sample retest and replication is encouraging, additional replication with a separate sample and by a separate group is still needed. Finally, the limited age range, medication free sample, and early course illness reduced heterogeneity in MDD. While reducing heterogeneity in clinical features strengthens internal validity, these study design features limit the degree to which this model might be extrapolated to different age ranges and those with more chronic disease.
In sum, these neuroimaging measures of Cognitive Control may reflect biomarkers that can be captured early in the illness to provide continuum-of-care decisions for longitudinal studies and embedded clinical care models. The results from such longitudinal studies could then be translated into modified treatment and secondary prevention models. In particular, early course models could employ these neuropsychological and neuroimaging tools with the idea that prevention reduces cost (lost jobs, failed education), morbidity (social, educational) and mortality (suicide).
Acknowledgments
Supported by a NIMH Biobehavioral Research Award for Innovative New Scientists (BRAINS MH091811, SAL). We thank the UM Prechter Bipolar research team (Kelly A. Ryan, Melvin G. McInnis, Gloria Harrington), the Multifaceted Explorations of the Neurobiology of Depressive Disorders laboratory (MEND2, Sara L. Weisenbach, Kelly A Ryan, Laura B. Gabriel, Anne L. Weldon, Michelle T Kassel, Kortni K. Meyers, Erica Hymen, Bethany Pester, Kristy A. Skerrett, and Natania A. Crane) for assistance in data collection, diagnostic interviews, and longitudinal follow-up evaluations. We thank Kristy A. Nielson, Ph.D. and Angela F. Caveney, Ph.D. for comments on earlier versions of this manuscript. Parts of this work were presented at a talk at the annual meeting of the American College of Neuropsychopharmacology in 2015, Hollywood, FL by SAL. The authors have no conflicts of interest to report. All authors had access to the present data and contributed to collection (SAL, LMJ, JPS, SRD, KLB, RHJ), analysis (SAL, LMJ, JPS, YC, AMP, OA, RB, RHJ), and interpretation (all) of the data and writing and editing (all) of the manuscript.
Footnotes
Supplementary data to this article can be found online at https://doi.org/10.1016/j.nicl.2018.10.004.
Appendix A. Supplementary data
Supplementary material
References
- Berwian I.M., Walter H., Seifritz E., Huys Q.J.M. Predicting relapse after antidepressant withdrawal – a systematic review. Psychol. Med. 2017;47:426–437. doi: 10.1017/S0033291716002580. [DOI] [PMC free article] [PubMed] [Google Scholar]
- Behzadi Y., Restom K., Liau J., Liu T.T. A Component Based Noise Correction Method (CompCor) for BOLD and Perfusion Based fMRI. NeuroImage. 2007;37(1):90–101. doi: 10.1016/j.neuroimage.2007.04.042. [DOI] [PMC free article] [PubMed] [Google Scholar]
- Bhaumik R. Multivariate pattern analysis strategies in detection of remitted major depressive disorder using resting state functional connectivity. NeuroImage Clin. 2016;16:390–398. doi: 10.1016/j.nicl.2016.02.018. [DOI] [PMC free article] [PubMed] [Google Scholar]
- Bockting C.L.H., Hollon S.D., Jarrett R.B., Kuyken W., Dobson K. A lifetime approach to major depressive disorder: the contributions of psychological interventions in preventing relapse and recurrence. Clin. Psychol. Rev. 2015;41:16–26. doi: 10.1016/j.cpr.2015.02.003. [DOI] [PubMed] [Google Scholar]
- Cassano G.B., Savino M., Perugi G., Musetti L., Akiskal H.S. Major depressive episode: unipolar and bipolar II. Encéphale. 1992:15–18. 18 Spec No 1. [PubMed] [Google Scholar]
- Chekroud A.M. Cross-trial prediction of treatment outcome in depression: a machine learning approach. Lancet Psychiatry. 2016;3:243–250. doi: 10.1016/S2215-0366(15)00471-X. [DOI] [PubMed] [Google Scholar]
- Chekroud A.M., Lane C.E., Ross D.A. Computational psychiatry: embracing uncertainty and focusing on individuals, not averages. Biol. Psychiatry. 2017;82:e45–e47. doi: 10.1016/j.biopsych.2017.07.011. [DOI] [PMC free article] [PubMed] [Google Scholar]
- Chen F. The effect of body–mind relaxation meditation induction on major depressive disorder: a resting-state fMRI study. J. Affect. Disord. 2015;183:75–82. doi: 10.1016/j.jad.2015.04.030. [DOI] [PubMed] [Google Scholar]
- Collins G.S., Reitsma J.B., Altman D.G., Moons K.G. Transparent reporting of a multivariable prediction model for individual prognosis or diagnosis (TRIPOD): the TRIPOD Statement. BMC Med. 2015;13:1. doi: 10.1186/s12916-014-0241-z. [DOI] [PMC free article] [PubMed] [Google Scholar]
- Crane N.A. Comorbid anxiety increases cognitive control activation in major depressive disorder. Depress. Anxiety. 2016;33:967–977. doi: 10.1002/da.22541. [DOI] [PMC free article] [PubMed] [Google Scholar]
- Crane N.A. Multidimensional prediction of treatment response to antidepressants with cognitive control and functional MRI. Brain. 2017;140:472–486. doi: 10.1093/brain/aww326. [DOI] [PMC free article] [PubMed] [Google Scholar]
- M. L. Crismon et al. (Physicians Postgraduate Press, US, 1999), vol. 60, pp. 142–156.
- Dawson E.L. Executive functioning at baseline prospectively predicts depression treatment response. Primary Care Companion. 2017;19:e1–e7. doi: 10.4088/PCC.16m01949. [DOI] [PMC free article] [PubMed] [Google Scholar]
- Deldonno S.R. Affective traits and history of depression are related to functional connectivity of the ventral striatum. J. Affect. Disord. 2017;221 doi: 10.1016/j.jad.2017.06.014. [DOI] [PMC free article] [PubMed] [Google Scholar]
- Elkin I., Gibbons R.D., Shea M.T., Sotsky S.M. Initial severity and differential treatment outcome in the National Institute of Mental Health Treatment of Depression Collaborative Research Program. J. Consult. Clin. Psychol. 1995;63:841–847. doi: 10.1037//0022-006x.63.5.841. [DOI] [PubMed] [Google Scholar]
- Garavan H., Ross T., Murphy K., Roche R.A., Stein E.A. Dissociable executive functions in the dynamic control of behavior: inhibition, error detection, and correction. NeuroImage. 2002;17:1820–1829. doi: 10.1006/nimg.2002.1326. [DOI] [PubMed] [Google Scholar]
- Geller B. Two-year prospective follow-up of children with a prepubertal and early adolescent bipolar disorder phenotype. Am. J. Psychiatr. 2002;159:927–933. doi: 10.1176/appi.ajp.159.6.927. [DOI] [PubMed] [Google Scholar]
- Greden J.F. Diagnosing and treating depression earlier and preventing recurrences: still neglected after all these years 5. Curr. Psychiatry Rep. 2004;6:401–402. doi: 10.1007/s11920-004-0001-4. [DOI] [PubMed] [Google Scholar]
- Greenberg P.E., Stiglin L.E., Finkelstein S.N., Berndt E.R. The economic burden of depression in 1990. J. Clin. Psychiatry. 1993;54:405–418. [PubMed] [Google Scholar]
- Gueorguieva R., Chekroud A.M., Krystal J.H. Trajectories of relapse in randomised, placebo-controlled trials of treatment discontinuation in major depressive disorder: an individual patient-level data meta-analysis. Lancet Psychiatry. 2017;4:230–237. doi: 10.1016/S2215-0366(17)30038-X. [DOI] [PMC free article] [PubMed] [Google Scholar]
- Gyurak A. Frontoparietal activation during response inhibition predicts remission to antidepressants in patients with major depression. Biol. Psychiatry. 2015;79:274–281. doi: 10.1016/j.biopsych.2015.02.037. [DOI] [PubMed] [Google Scholar]
- Jacobs R.H. Increased coupling of intrinsic networks in remitted depressed youth predicts rumination and cognitive control. PLoS One. 2014;9:e104366. doi: 10.1371/journal.pone.0104366. [DOI] [PMC free article] [PubMed] [Google Scholar]
- Jacobs R.H. Decoupling of the amygdala to other salience network regions in adolescent onset recurrent major depressive disorder. Psychol. Med. 2016;46:1055–1067. doi: 10.1017/S0033291715002615. [DOI] [PMC free article] [PubMed] [Google Scholar]
- Jacobs R.H. Decoupling of the amygdala to other salience network regions in adolescent-onset recurrent major depressive disorder. Psychol. Med. 2016;46:1055–1067. doi: 10.1017/S0033291715002615. [DOI] [PMC free article] [PubMed] [Google Scholar]
- Jenkins L.M. Integrated cross-network connectivity of amygdala, insula, and subgenual cingulate associated with facial emotion perception in healthy controls and remitted major depressive disorder. Cogn. Affect. Behav. Neurosci. 2017;17:1242–1254. doi: 10.3758/s13415-017-0547-3. [DOI] [PMC free article] [PubMed] [Google Scholar]
- Jo H.J., Gotts S.J., Reynolds R.C., Bandettini P.A., Martin A., Cox R.W. Effective preprocessing procedures virtually eliminate distance-dependent motion artifacts in resting state fMRI. J Appl Math. 2013 doi: 10.1155/2013/935154. 1±9. [DOI] [PMC free article] [PubMed] [Google Scholar]
- Kaiser R.H., Andrews-Hanna J.R., Wager T.D., Pizzagalli D.A. Large-scale network dysfunction in major depressive disorder: a meta-analysis of resting-state functional connectivity. JAMA Psychiatry. 2015;6:603–611. doi: 10.1001/jamapsychiatry.2015.0071. [DOI] [PMC free article] [PubMed] [Google Scholar]
- Kelly A.M. Development of anterior cingulate functional connectivity from late childhood to early adulthood. Cereb. Cortex. 2009;19:640–657. doi: 10.1093/cercor/bhn117. [DOI] [PubMed] [Google Scholar]
- Kendler K.S., Gatz M., Gardner C.O., Pedersen N.L. A Swedish national twin study of lifetime major depression. Am. J. Psychiatry. 2006;163:109–114. doi: 10.1176/appi.ajp.163.1.109. [DOI] [PubMed] [Google Scholar]
- Klerman G.L., Weissman M.M. The course, morbidity, and costs of depression. Arch. Gen. Psychiatry. 1992;49:831–834. doi: 10.1001/archpsyc.1992.01820100075013. [DOI] [PubMed] [Google Scholar]
- Kovacs M., Obrosky S., George C. The course of major depressive disorder from childhood to young adulthood: Recovery and recurrence in a longitudinal observational study. J. Affect. Disord. 2016;203:374–381. doi: 10.1016/j.jad.2016.05.042. [DOI] [PMC free article] [PubMed] [Google Scholar]
- Kuyken W. The effectiveness and cost-effectiveness of mindfulness-based cognitive therapy compared with maintenance antidepressant treatment in the prevention of depressive relapse/recurrence: results of a randomised controlled trial (the PREVENT study) Health Technol. Assess. 2015;19 doi: 10.3310/hta19730. [DOI] [PMC free article] [PubMed] [Google Scholar]
- Kuyken W. Efficacy of mindfulness-based cognitive therapy in prevention of depressive relapse: an individual patient data meta-analysis from randomized trials. JAMA Psychiatry. 2016;73:565–574. doi: 10.1001/jamapsychiatry.2016.0076. [DOI] [PMC free article] [PubMed] [Google Scholar]
- Langenecker S.A., Caveney A.F., Giordani B. The sensitivity and psychometric properties of a brief computer-based cognitive screening battery in a depression clinic. Psychiatry Research. 2007;152(2-3):143–154. doi: 10.1016/j.psychres.2006.03.019. [DOI] [PubMed] [Google Scholar]
- Langenecker S., Zubieta J., Young E., Akil H., Nielson K.A. A task to manipulate attentional load, set-shifting, and inhibitory control: convergent validity and test-retest reliability of the Parametric Go/No-Go Test. J. Clin. Exp. Neuropsychol. 2007;29(12) doi: 10.1080/13803390601147611. [DOI] [PubMed] [Google Scholar]
- Langenecker S.A. Frontal and limbic activation during inhibitory control predicts treatment response in major depressive disorder. Biol. Psychiatry. 2007;62:1272–1280. doi: 10.1016/j.biopsych.2007.02.019. [DOI] [PMC free article] [PubMed] [Google Scholar]
- Langenecker S.A., Jacobs R.H., Passarotti A.M. Current neural and behavioral dimensional constructs across mood disorders. Curr. Behav. Neurosci. Rep. 2014;1:114–153. doi: 10.1007/s40473-014-0018-x. [DOI] [PMC free article] [PubMed] [Google Scholar]
- Lara D.R., Pinto O., Akiskal K., Akiskal H.S. Toward an integrative model of the spectrum of mood, behavioral and personality disorders based on fear and anger traits: I. Clinical implications. J. Affect. Disord. 2006;94:67–87. doi: 10.1016/j.jad.2006.02.025. [DOI] [PubMed] [Google Scholar]
- Lemoult J., Kircanski K., Prasad G., Gotlib I.H. Negative self-referential processing predicts the recurrence of major depressive episodes. Clin. Psychol. Sci. 2017;5:174–181. doi: 10.1177/2167702616654898. [DOI] [PMC free article] [PubMed] [Google Scholar]
- Levinson D.F. Genetics of recurrent early-onset major depression (GenRED): significant linkage on chromosome 15q25-q26 after fine mapping with single nucleotide polymorphism markers. Am. J. Psychiatry. 2007;164:259–264. doi: 10.1176/ajp.2007.164.2.259. [DOI] [PubMed] [Google Scholar]
- Lythe K.E. Self-blame–selective hyperconnectivity between anterior temporal and subgenual cortices and prediction of recurrent depressive episodes. JAMA Psychiatry. 2015;72:1119–1126. doi: 10.1001/jamapsychiatry.2015.1813. [DOI] [PubMed] [Google Scholar]
- Margulies D.S. Mapping the functional connectivity of anterior cingulate cortex. NeuroImage. 2007;37:579–588. doi: 10.1016/j.neuroimage.2007.05.019. [DOI] [PubMed] [Google Scholar]
- Nierenberg A., Petersen T., Alpert J. Prevention of relapse and recurrence in depression: the role of long-term pharmacotherapy ad psychotherapy. J. Clin. Psychiatry. 2003;64:13–17. [PubMed] [Google Scholar]
- Nurnberger J.I., Jr. Diagnostic interview for genetic studies. Rationale, unique features, and training. NIMH Genetics Initiative. Arch. Gen. Psychiatry. 1994;51:849–859. doi: 10.1001/archpsyc.1994.03950110009002. [DOI] [PubMed] [Google Scholar]
- Peters A.T. Domain-specific impairment in cognitive control among remitted youth with a history of major depression. Early Interven. Psychiatry. 2017;11(5):383–392. doi: 10.1111/eip.12253. [DOI] [PMC free article] [PubMed] [Google Scholar]
- Phillips M.L. Identifying predictors, moderators, and mediators of antidepressant response in major depressive disorder: neuroimaging approaches. Am. J. Psychiatr. 2016;172:124–138. doi: 10.1176/appi.ajp.2014.14010076. [DOI] [PMC free article] [PubMed] [Google Scholar]
- Rao J.A. Differential resting state connectivity patterns and impaired semantically cued list learning test performance in early course remitted major depressive disorder. J. Int. Neuropsychol. Soc. 2016;22:225–239. doi: 10.1017/S1355617716000011. JINS. [DOI] [PMC free article] [PubMed] [Google Scholar]
- Segal Z., Pearson J., Thase M. Challenges in preventing relapse in major depression. Report of a National Institute of Health Workshop on state of science of relapse prevention in major depression. J. Affect. Disord. 2003;77:97–108. doi: 10.1016/s0165-0327(02)00112-x. [DOI] [PubMed] [Google Scholar]
- Serra-Blasco M. Naturalistic course of major depressive disorder predicted by clinical and structural neuroimaging data: a five year follow-up. Depress. Anxiety. 2016;33:1055–1064. doi: 10.1002/da.22522. [DOI] [PubMed] [Google Scholar]
- Siegle G.J., Thompson W., Carter C.S., Steinhauer S.R., Thase M.E. Increased amygdala and decreased dorsolateral prefrontal BOLD responses in unipolar depression: related and independent features. Biol. Psychiatry. 2007;61:198–209. doi: 10.1016/j.biopsych.2006.05.048. [DOI] [PubMed] [Google Scholar]
- Siegle G.J. Toward clinically useful neuroimaging in depression treatment: prognostic utility of subgenual cingulate activity for determining depression outcome in cognitive therapy across studies, scanners, and patient characteristics. Arch. Gen. Psychiatry. 2012;69:913–924. doi: 10.1001/archgenpsychiatry.2012.65. [DOI] [PMC free article] [PubMed] [Google Scholar]
- Stange J.P. Attenuated intrinsic connectivity within cognitive control network among individuals with remitted depression: temporal stability and association with negative cognitive styles. Hum. Brain Mapp. 2017;38:2939–2954. doi: 10.1002/hbm.23564. [DOI] [PMC free article] [PubMed] [Google Scholar]
- Steinert C., Hofmann M., Kruse J., Leichsenring F. The prospective long-term course of adult depression in general practice and the community. A systematic literature review. J. Affect. Disord. 2014;152-154:65–75. doi: 10.1016/j.jad.2013.10.017. [DOI] [PubMed] [Google Scholar]
- Steyerberg E.W., Vergouwe Y. Towards better clinical predictionmodels: seven steps for development and anABCDfor validation. Eur. Heart J. 2014;35 doi: 10.1093/eurheartj/ehu207. Epub. [DOI] [PMC free article] [PubMed] [Google Scholar]
- Supekar K., Musen M., Menon V. Development of large-scale functional brain networks in children. PLoS Biol. 2009;7 doi: 10.1371/journal.pbio.1000157. [DOI] [PMC free article] [PubMed] [Google Scholar]
- Tang Y., Hölzel B., Posner M. The neuroscience of mindfulness meditation. Nat. Rev. Neurosci. 2015;16:213. doi: 10.1038/nrn3916. [DOI] [PubMed] [Google Scholar]
- Uddin L.Q., Supekar K., Menon V. Typical and atypical development of functional human brain networks: insights from resting-state fMRI. Front. Syst. Neurosci. 2010;21 doi: 10.3389/fnsys.2010.00021. [DOI] [PMC free article] [PubMed] [Google Scholar]
- Votruba K.L., Rapport L.J., Whitman R.D., Johnson A., Langenecker S. Personality differences among patients with chronic aphasia predict improvement in speech-language therapy. Top. Stroke Rehabil. 2013;20:421–431. doi: 10.1310/tsr2005-421. [DOI] [PubMed] [Google Scholar]
- Williams L.M. Amygdala reactivity to emotional faces in the prediction of general and medication-specific responses to antidepressant treatment in the randomized iSPOT-D trial. Neuropsychopharmacology. 2015;40:2398–2408. doi: 10.1038/npp.2015.89. [DOI] [PMC free article] [PubMed] [Google Scholar]
- Winokur G., Coryell W. Familial subtypes of unipolar depression: a prospective study of familial pure depressive disease compared to depression spectrum disease. Biol. Psychiatry. 1992;32:1012–1018. doi: 10.1016/0006-3223(92)90062-5. [DOI] [PubMed] [Google Scholar]
- Workman C.I., Lythe K.E., McKie S., Moll J. A novel resting-state functional magnetic resonance imaging signature of resilience to recurrent depression. Psychol. Med. 2017;47:597–607. doi: 10.1017/S0033291716002567. [DOI] [PMC free article] [PubMed] [Google Scholar]
- Yeo B.T.T. The organization of the human cerebral cortex estimated by intrinsic functional connectivity. J. Neurophysiol. 2011;106:1125–1165. doi: 10.1152/jn.00338.2011. [DOI] [PMC free article] [PubMed] [Google Scholar]
Associated Data
This section collects any data citations, data availability statements, or supplementary materials included in this article.
Supplementary Materials
Supplementary material