Abstract
Methanol is the simplest alcohol and possible energy carrier because it is easier to store than hydrogen and burns cleaner than fossil fuels. It is a colorless liquid, completely miscible with water and organic solvents and is very hygroscopic. Here, simple two-dimensional models of methanol, based on Mercedes–Benz (MB) model of water, are examined by Monte Carlo simulations. Methanol particles are modeled as dimers formed by an apolar Lennard-Jones disk, mimicking the methyl group, and a sphere with two hydrogen bonding arms for the hydroxyl group. The used models are the one proposed by Hribar-Lee and Dill (Acta Chimica Slovenica, 53:257, 2006.) with the overlapping discs and a new model with tangentially fused dimers. The comparison was done between the models, in connection to the MB water, as well as with experimental results and with new simulations done for 3D models of methanol. Both 2D models show similar trends in structuring and thermodynamics. The difference is the most pronounced at lower temperatures, where the smaller model exhibits spontaneous crystallization, while the larger model shows metastable states. The 2D structural organization represents well the clustering tendency observed in 3D models, as well as in experiments. The models qualitatively agree with the bulk methanol thermodynamic properties like density and isothermal compressibility, however, heat capacity at the constant pressure shows trend more similar to the water behavior. This work on the smallest amphiphilic organic solute provides a simple testing ground to study the competition between polar and non-polar effects within the molecule and physical properties.
I. INTRODUCTION
The rich variety of structural organization is present in solutions of so-called amphiphilic molecules, which possess polar and hydrophobic constituents. Such compounds are significant in material science, chemistry and biology, and are studied with the aim of relating the polar and non-polar features to the structural and physico-chemical properties of the system1–3. The most explored behavior of amphipathic molecules is their mixing with water, where, in general, associations are formed by minimizing the hydrophobic contact with polar water. However, structure in pure amphipathic systems is also non-trivial, as shown in the case of alcohol clustering4,5.
Methanol is the simplest example of alcohols. The hydroxyl group is strongly polarized and can participate in hydrogen bonding with other methanol or water molecules. The methyl group has small polarizability and eschews polar environment. Due to its small size, both effects are noticeable in methanol. Thus, methanol is miscible with very polar solvents, such as water or acetic acid, and weakly polar solvents, such as benzene. Methanol shares similarities with water. It is a small and simple, hydrogen-bond forming molecule, but interestingly enough it does not exhibit the famous density anomaly at normal pressures. The reason probably lies in fact that methanol can only form chain- and ring-like structures comparing to water which can form 3D hydrogen bonded structures. Theoretical predictions of its phase diagram show rich behaviour similar to that of water6. A second critical point at very low temperatures is also predicted similarly as for water7.
The liquid state of methanol is characterized by the predominance of chains and rings of various sizes, as it has been pointed out by experiments4,5,8,9, as well as by simulation studies10–12. For example, simulation results highlighted the discrepancy in the methanol sites’ organization. The OH-hydrogen bonding sites are strongly correlated and form chainlike clusters with the preferential clusters formed by 3–7 O sites, while the methyl sites preserve the random distribution10.
Simulations studies made a huge advance in the understanding of other small scale polar and amphipathic systems13–19. For example, Su et al.20 modeled an amphiphilic solute in a so-called Jagla solvent with the intention of mimicking the water-methanol system, showing that both the dimer and monomer methanol representations preformed well in reproducing the thermodynamic properties. Also, the lattice gas model of amphiphilic molecules in solutions described in21, was able to follow structural trends such as bilayers and clustering, depending on the temperature and concentration.
As it can be seen, many properties of molecular solutions can be captured by simple models22,23. One class of such simpler models has been developed by Nezbeda and coworkers24–27. One of the simplest models for water is the so-called Mercedes–Benz (MB) model28–33, which was originally proposed by Ben–Naim in 197134,35. In this 2-dimensional model, each water molecule is represented as a disk that interacts with other such waters through: (1) a Lennard–Jones (LJ) interaction and (2) an orientation–dependent hydrogen bonding interaction through three radial arms arranged as in the Mercedes–Benz (MB) logo. The advantages of the MB model, compared to more realistic water models, are: i) the computer simulations of thermodynamic properties (heat capacity for example) can be obtained in reasonable amounts of computer time, and ii) the underlying physical principles can be more readily explored and visualized in two dimensions. NPT Monte Carlo simulations have shown that the MB model predicts qualitatively the density anomaly, the minimum in the isothermal compressibility as a function of temperature, the large heat capacity, as well as the experimental trends for the thermodynamic properties of nonpolar solutes’ solvation29,31,32,36 and cold denaturation of proteins37. The model was also extensively studied with analytical methods like integral equation and thermodynamic perturbation theory38–43. The most recent development in 2D models is the so-called rose potential44, which is structurally similar to MB water and demonstrates the same water-like anomalous properties. There have been efforts to extend 2D modeling to more complex and biologically important systems, one such example being the MB model of neutral amino-acid side chains45.
In this study we seek to construct the model for the smallest amphipathic molecule inspired by the MB water. Our primary goal is to uncover the structural and thermodynamic properties exhibited by this simplest model, which is the first representative of the larger class of systems that can be built based on the MB-idea. The modeling of alcohols is rather limited, however, a similar model for alcohols was already developed by Hribar-Lee and Dill46, but mostly focusing on representing alcohol-water mixtures. The authors showed that the volumetric properties followed qualitatively the experiments, but the enthalpy of mixing was not represented well by the 2D model46. We included in our analysis both 2D models, which differ in the distance between the centers of the disks that represent the polar and hydrophobic sites. The reason why we introduced a new model is its versatility in regards to various theoretical approaches like integral equation theory and thermodynamic perturbation theory. Those theories are more accurate when dimers are tangentially fused. We will show that both models exhibit similar properties, but our model has access to an expanded range of techniques that could be applied in the investigations.
This paper is organized as follows. In section II, the MB model is presented. Sections III and IV contain descriptions of the computational methods used. Then, in Section V, we present our computed structural and thermodynamic results, comparing the latter trends with those of experiments on bulk methanol. The last Section VI discuss the main results and further explorations.
II. MODEL DETAILS
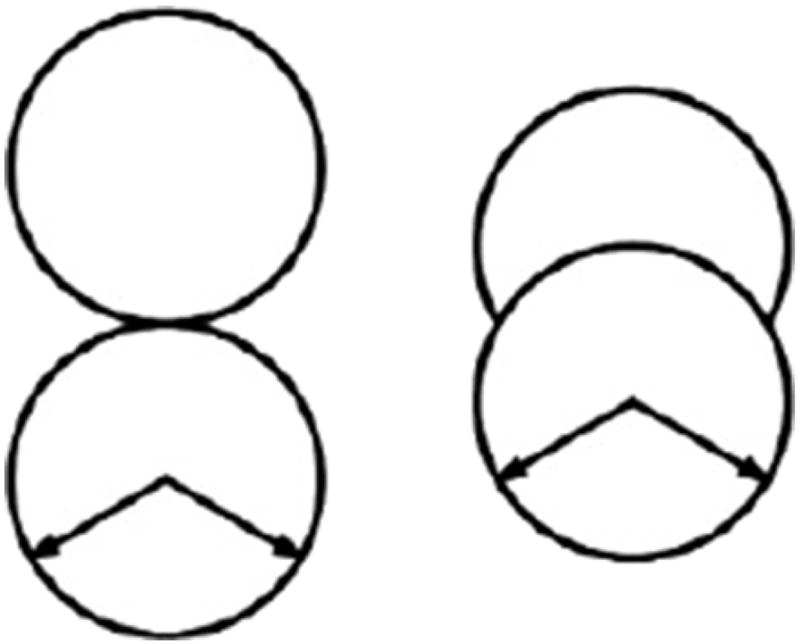
Molecules of a simple model of methanol or a Mercedes Benz methanol (Figure 1) are modeled as a dimer consisting of two disks at a fixed separation l. The first disk, named site 1, is the methyl group and interacts with other particles only by Lennard-Jones interaction. The second disk, named site 2, is the hydroxyl group and is interacting with other sites 1 by LJ interactions and with other sites 2 by LJ and hydrogen bonding (HB) interaction. The potential energy for the interaction of two dimers U (Ri, Rj) is defined as the pairwise sum of Lennard-Jones energies ULJ involving constituent sites and HB interaction between hydroxyl sites, that is,
| (1) |
where Ri and Rj are position vectors of centers-of-mass and of orientation of dimers i and j, respectively and Xi and Xj orientational vectors. riα is the position vector of site α in molecule i. A similar definition applies to rjβ. The Lennard-Jones energy is calculated using standard form
| (2) |
where εLJ denotes the well–depth of LJ part of potential and σLJ the contact parameter. LJ parameters for both sites are identical (εLJ =ε1=ε2 and σLJ =σ1=σ2). In reality, methyl groups are bigger, but since disks are fused at contact this has a similar effect to one group being bigger and therefore overlapping. Each hydroxyl site has beside a soft LJ core also two arms separated by an angle of 120° and forming angle 120° with position of the methyl group and can interact with arms of the hydroxyl group of other molecule. The hydrogen bonding part of the interaction potential is the sum of all interactions between both arms of each molecule
| (3) |
where describes the interaction between two arms of different molecules and is defined as
| (4) |
Expressing the scalar products explicitly gives the following form of the HB potential
| (5) |
where k and l stand for the different arms and G(x) is an unnormalized Gaussian function
| (6) |
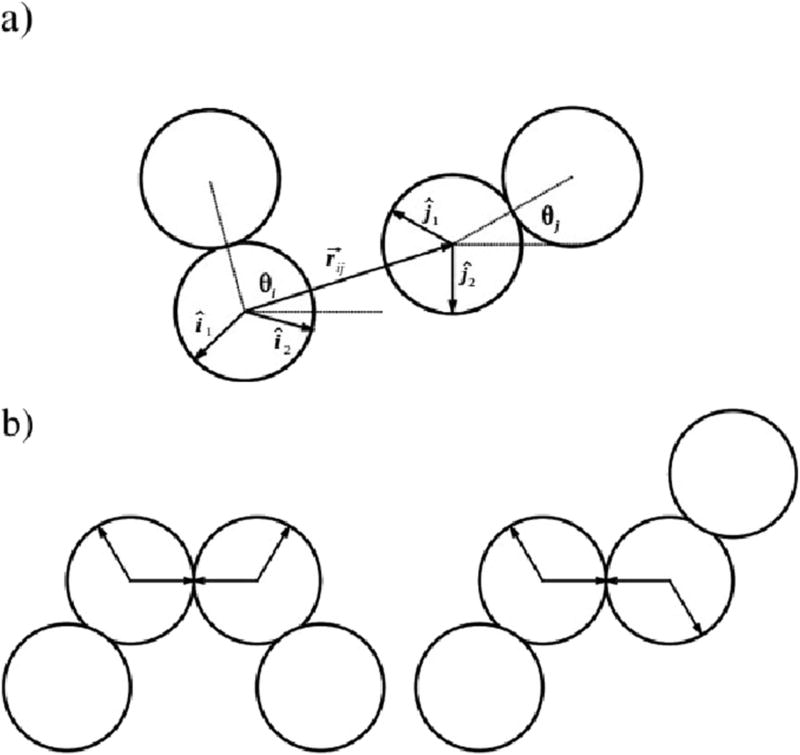
Further, εHB = −1 is a hydrogen bond energy parameter and rHB = 1 is a characteristic hydrogen bond length. is the unit vector along and is the unit vector representing the kth arm of the ith particle, where θi is the orientation of ith particle. The orientation of a molecule is defined by the angle of vectors between the hydroxyl and methyl group. The strongest hydrogen bond occurs when an arm of one particle is co–linear with the arm of another particle and the two other arms point in the opposite directions (Figure 2). The LJ well–depth εLJ is 0.1 times the HB interaction energy εHB and the Lennard–Jones contact parameter σLJ is 0.7rHB.
FIG. 1.
Illustration of the 2D MB methanol models: H-L/D on the right, our model on the left.
FIG. 2.
Illustration of the MB interactions panel a) and panel b) two preferential types of Hbonding formed by MB methanol, resulting in ringlike (left) and chainlike clusters (right).
We approached the modelling of MB methanol in a straightforward fashion. The first idea was to simply borrow MB water, remove one HBond arm and attach a nonpolar group at the end of the hydroxyl group, making sure that the two disks don’t overlap. Further steps in modifying the model could include changing the overlap of the two disks or the directionality of the Hbond. If one were to enforce the overlap between the two groups so that the center of one disk rests on the rim of the other, we would obtain the Hribar-Lee and Dill model46. We’ve taken their model into consideration and show its peculiarities alongside our proposed model in Section V.
We have also varied the directionality of the Hbond for our proposed model. The reduction of directionality was done by enlarging the width of the Gaussian function for the angle definition, all while keeping the same energy well-depth. The greater contact area of the MB arms caused the decrease in the energy and volume of the system, as well as in the quantities connected to fluctuations. In the structural sense, the system displayed larger connectivity resulting in richer types of clustering, such as longer chains, u-shape pins and closed polygons with four to six molecules. The system’s dynamics was also changed, resulting in molecules that could move faster locally, all while being more strongly associated to supermolecular entities. Even though this flexible system is more stable, having lower energy and smaller volume, there is one caveat. The flexible model failed strongly to represent the twofold bonding of the methanol hydroxyl group, since in some cases, the flexible MB molecule had three or four bonds (as seen from the visual inspection, data not shown).
III. MONTE CARLO SIMULATIONS
Monte Carlo simulations using constant particle number, pressure and temperature were used to access the properties of the system. At one MC step, a randomly chosen particle was either translated to new coordinates (x, y) or rotated to a new orientation. One cycle included moving and rotating all particles, once on average, and possible modifications of the system volume. The periodic boundary conditions and the minimum image convention were used to mimic an infinite system of particles. The temperature range was from 0.11 to 0.4, and the pressure was as the one used for the MB water, p* = 0.19, all in the reduced units. The number of particles were N = 60, which corresponds to about 500 in 3D29. Increasing the number of particles to N = 120, as we tested for a few cases, had no significant effect on the values of the calculated quantities.
Each temperature point had several starting configurations selected at random. At the lower temperatures, we observed very slow kinetics and the possible formation of the glassy state. It is interesting to notice that the bulk methanol also vitrifies, but in the supercooled region and at elevated pressures47,48. As for the solid state methanol, the two widely accepted structures are alpha and beta phases at ambient pressure, which are both represented by infinite, linear and anti-parallel H-bonded chains, with the difference in the OH-bond packing49,50. Similar forms of the alternating chains were also observed in the transient structures during equilibration of the low-temperature states of MB methanol, where a substantial amount of particles, or even the whole system in the case of the less restricted H-L/D model, spontaneously crystallized. Following these crystallization patterns, we artificially created tentative 2D crystal initial states for our MD model and tested the region of their stability by imposing defects in the form of one or two missing particles. The initial crystal structure had 72 particles, which could span a system of the approximately same size as the one used for the random initial configurations.
Several thermodynamic properties, such as internal energy and volume, were monitored during equilibration, which then lasted for 30000 cycles for higher, and up to 50000 for the lower temperatures. A similar procedure was applied also for the production runs, which then varied from 106 to 107 cycles depending on temperature. During the equilibration as well as the production, the acceptance ratio was kept 0.5 by regulating the maximum value of translational, rotational and volume changes in each step. Thermodynamic quantities were calculated as statistical averages over the course of the simulations51. Based on the formalism of statistical mechanics52, we calculated fluctuations, such as: the isothermal compressibility,
related to fluctuations of volume; constant pressure heat capacity,
related to enthalpy fluctuations; and isobaric expansion coefficient,
related to the combination of volume and entropy fluctuations.
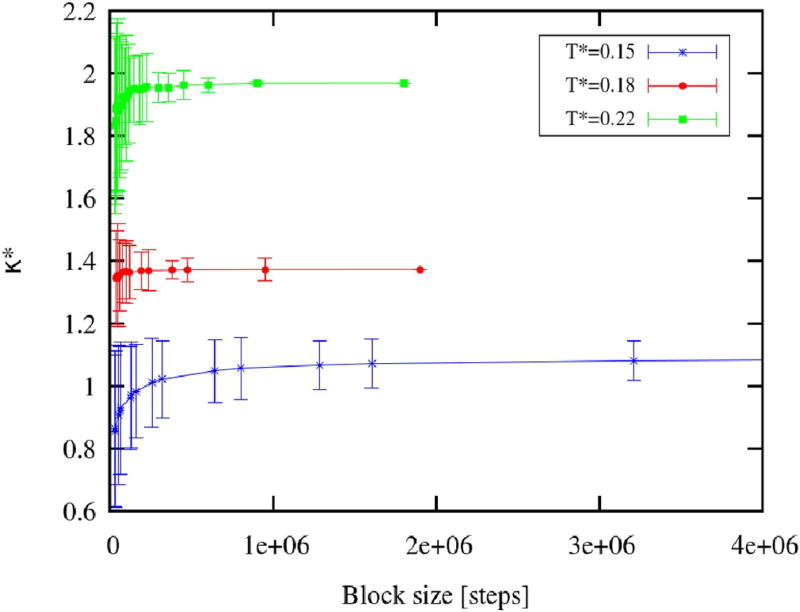
The calculation related to the fluctuations imposed the necessity of using blocking techniques to estimate the averages and the corresponding standard deviations. Moreover, the optimal block size varied depending on the system dynamics at different phase points. For each point, the calculations were done using different block sizes, until the convergence was achieved, as shown in Figure 3.
FIG. 3.
Convergence of compressibility with the increase in block size, for: T* = 0.15 (blue stars), T* = 0.18 (red dots) and T* = 0.22 (green squares).
The hydrogen bond statistics were calculated using an energy criterion for the MB potential. Since the MB potential is defined by Gaussian functions (see Section II), the σ parameters of Gaussian corresponding to both the angular and radial part of the potential are chosen such that only a small interval of distances around rHB and a small interval of angles around 0° (corresponding to the arms alignment) form significant interactions. Thus, choosing an energy threshold for the MB potential of two particles uniquely defines the hydrogen bond.
IV. MOLECULAR DYNAMIC SIMULATIONS
Molecular dynamic simulations simulations were performed using the Gromacs 4.5.5. program package53, in order to access properties of 3D methanol models. One of the earliest 3D methanol models, the so-called optimized potential for liquid simulations (OPLS) model was proposed by Jorgensen54, followed by the work of van Leeuwen and Smit on L1 model55. Also popular are the H1 model of Haughney et al.56,57, the L2 model of Hasse et al.58,59, the Transferable potential for phase equilibria (TraPPE) force field developed by the Siepmann group60 and the Kirkwood-Buff derived force field (KBFF) by Smith’s group61. In all simulations we used both OPLS-UA54 and TraPPe-UA model60. Simulation were done in the NPT ensemble at the atmospheric pressure and at the range of temperatures starting from 173 K to 330 K, which corresponds to the liquid state of methanol. However, in Vega’s work on the phase diagram of methanol obtained by simulating the OPLS model6, it’s noted that the melting point of model methanol is overestimated by approximately 40K with respect to the realistic value.
The temperature and pressure were maintained close to the reference values using the V-rescale thermostat62 (the time constant 0.2 ps) and the Parinello-Rahman barostat63,64 (with the time constant 2 ps). The leap-frog integration scheme was used at every time-step of 2 fs65. The short-range interactions were calculated within the 1.5 nm cut-off radius and the dispersion correction was included in the energy calculations, while electrostatics were handled with the PME method66.
The initial configurations of 1000 methanol molecules were obtained with Packmol67. All the simulations followed the same protocol: the initial configuration would undergo energy minimization; then the equilibration of 1 ns and production runs of 12 ns (for the two lowest temperatures) or 4 ns (for all other temperatures). The thermodynamic properties were calculated by the Gromacs utility g_energy53, and using our program with the adaptable block size for the estimation of the thermodynamic fluctuations and corresponding errors. The cluster size distributions were calculated for the hydrogen bonded clusters. The bonded pair is defined by the Stillinger distance criteria, that corresponds to the first minima of the OO radial distribution function rcut_off = 3.7 nm68. Several different statistical approaches were used, but we show results for the cluster size probability function:
| (7) |
where Nc is the number of configurations, Nmol is the number of O sites, and sn is the probability for the cluster formed of n oxygen sites and s(k, n) represents the number of clusters of the size n in the configuration k.
V. RESULTS AND DISCUSSION
All our results for MB model of methanol are shown in reduced units; the excess internal energy and temperature are normalized to the HB energy parameter and the distances are scaled to the hydrogen bond characteristic length and the reduced entropy is . NPT simulations were done at the same pressure used for simulations of the MB model of water (p* = 0.19).
A. Structural properties
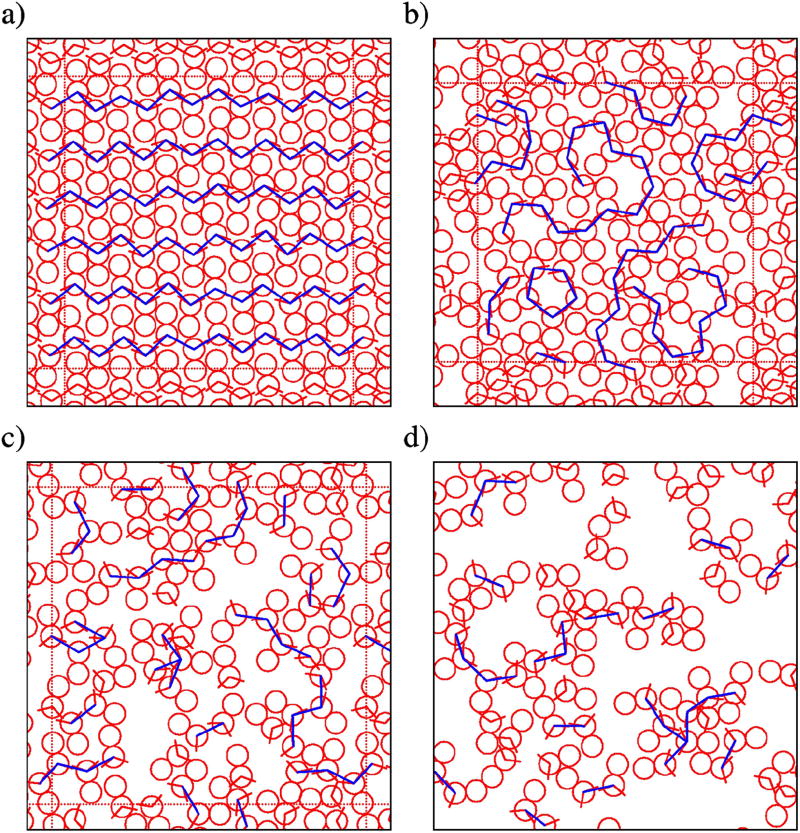
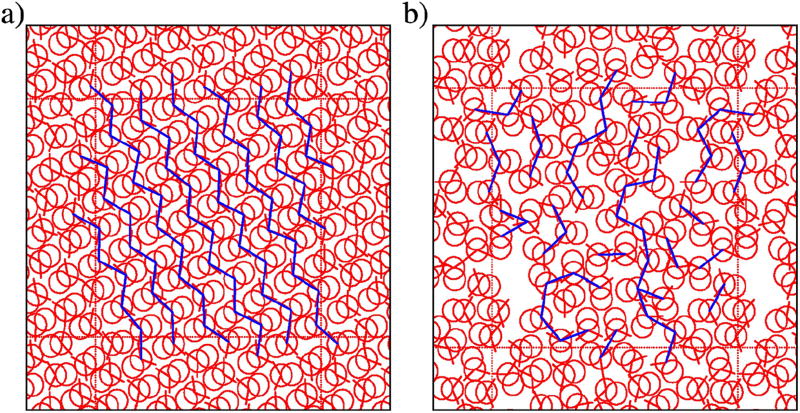
Amphiphile systems favor associations, such as clustering in neat liquids and micro-heterogeneous organization in mixtures of alcohols10,11,15. Therefore, we visually inspect simulation snapshots and compare them to known structuring in real methanol. Figure 4 shows the configurations of our MB methanol model at different points in the phase diagram. Two cases represent structuring at low temperatures, which we show in Figure 4, panel a) and b), for T* = 0.12. The first one corresponds to ordered crystals in the form of zig-zag chains, analogous to one of the structures observed in real methanol69. The second one exhibits metastable random structuring, with large fluctuations due to the partly crystal-like and partly liquid-like structuring. We can argue that the restricted geometry and strong and directional H-bonding, at lower temperatures, highly reduce dynamics of the system, resulting in such frozen states. We named this region glassy phase, although the physics behind glass transitions or supercooled states is quite different.
FIG. 4.
Snapshot of 2D methanol at: a) T* = 0.12, started from a crystal initial configuration, b) T* = 0.12, started from a random initial configuration, c) T* = 0.18, d) T* = 0.25, also from initial random configurations.
We tentatively defined the higher temperature states as liquid states, despite lacking information about the entire phase diagram, and following what was done for the case of 2D MB model of water. As representatives of these so-called liquid states we show the configuration at the temperature T* = 0.18 (Figure 4c)), in which Hbond clustering of closed and open forms is indicated as the specificity of this phase region. At an even higher temperature, the organization comprises of single particles and linear clusters including mostly three particles. This combination of a gas and liquid phase could be considered as the fluid regime which is presented in Figure 4, panel d), for T* = 0.25.
As for the H-L/D model, two representative configurations are shown in Figure 5, for temperatures T* = 0.135 and T* = 0.18, respectively. Unlike our model, the H-L/D model spontaneously crystallizes at temperatures below T* = 0.15, with the resulting structures being variations of the structure in Figure 5, panel a). Above that threshold, the H-L/D methanol can be regarded as being in the liquid phase, as witnessed in Figure 5, panel b).
FIG. 5.
Snapshot of 2D H-L/D methanol at: a) T* = 0.135 representing a crystal configuration, b) T* = 0.18 as a liquid state, both started from a random initial configuration.
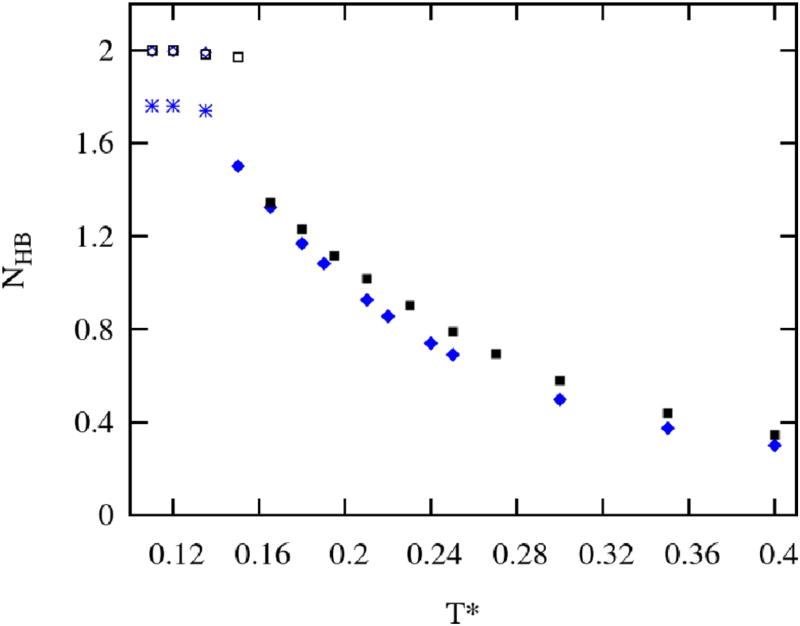
In Figure 6 we show the change of the average number of Hbonds per particle, as hydrogen bonding highly influences structure in 2D systems. At the lower temperatures and crystalline states nearly all methanol particles fully saturate their 2 available Hbond interaction arms. A plateau-like feature is also observed for the glassy region but around 1.8 bonds per particle. As for the liquid states, with the temperatures rise, hydrogen bonding decreases reaching a less than one bond in the fluid region, with the linear shape of the decreasing functions for the temperatures below T* = 0.25, and change of the trend to a polynomial form above T* = 0.25.
FIG. 6.
Average number of hydrogen bonds per particle. The blue starts (glassy states), open (crystalline states) and filled (liquid and fluid states) diamonds represent Hbonding in our model, black open (crystalline states) and filled (liquid and fluid states) squares are results for H-L/D model.
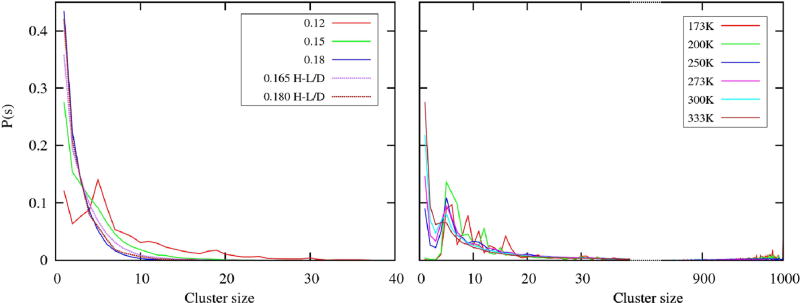
Since the visual inspection highlighted the predominance of clusters-type structuring, we expanded our analysis to include the calculation of cluster size distributions. As shown in our previous simulations studies10,11, hydrogen bonded clusters in 3D methanol have preferential sizes. These preferential particle numbers in a cluster of OO sites are defined by the local maximum in the corresponding cluster size distribution. A similar calculation was performed for the studied 2D methanols. Figure 7 confirms the existence of preferential clusters in the 2D model, however, the local maximum in the cluster size distribution is clearly visible only in the glassy region. These maxima around 5 particles represent formation of open and closed chains as can also be seen from snapshots (Figure 4). The corresponding peak is absent in the case of the H-L/D model, as it doesn’t have a glassy phase. We can conclude that MB models represent well the hydrogen-bond induced clustering in methanol; the low-temperature states in the form of zig-zag chains and chain and ring clusters at the higher temperatures. Also, the structure of 2D MB methanol is completely different in comparison to 2D MB water which has the tendency to form hexagonal-like structures, yet no rings and chains.
FIG. 7.
Cluster size distributions calculated for 2D (left panel) and 3D methanols (right panel). In order to represent the overall range for both distributions, we used the break in the x-axis for 3D methanols. The right part of the 3D plot shows probabilities for large size clusters, which are close to the size of the system (1000 molecules). The color code is contained in the legend box for each panel.
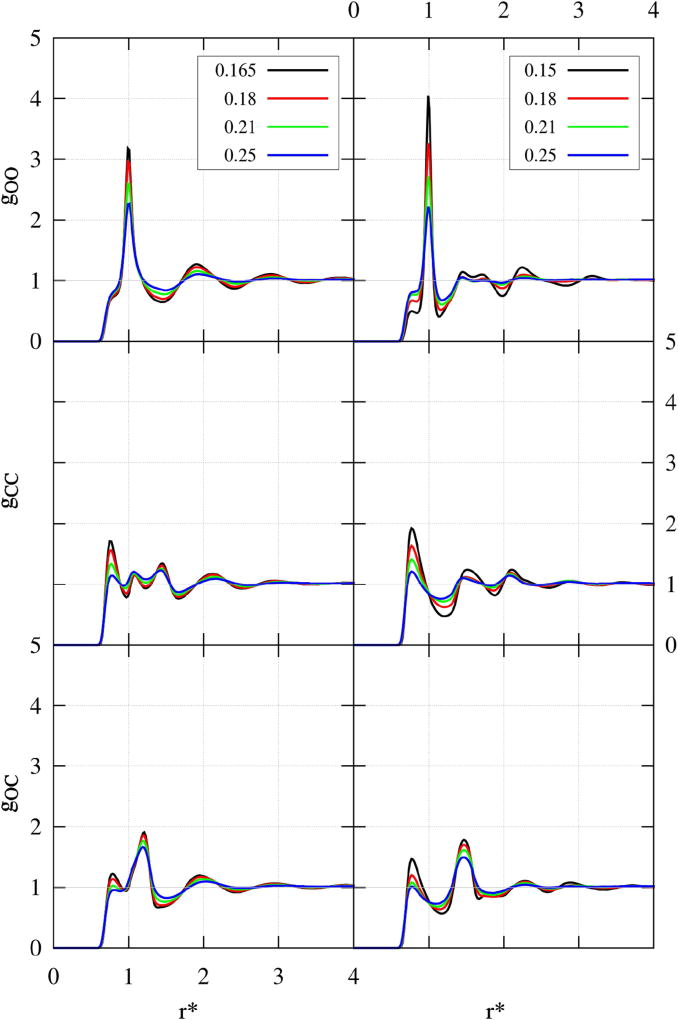
More detailed information on the structure is contained in site-site radial distribution functions (RDFs) in Figure 8, where right panel corresponds to our model, while left panel represents H-D/L model. Both 2D models reproduce the key signature of hydrogen bonding - the pronounced first peak in OO RDFs, which increases as the temperature decreases (Figure 8, top panels). The MB OO correlations have slight shoulders at distances smaller than Hbond, which is a consequence of the smaller van der Waals radius. This is a characteristic of MB 2D models29. Our model has a more defined Hbond peak located at r* = 1 and is more structured. Namely, the second shell peak at r = 1.7 in the H-L/D model splits into two peaks in our model. These peaks at r = 1.4 and r = 1.7 correspond to a hydrogen bonded chain and the distance between two Hbonded chains, respectively. Our model also has a peak positioned at r = 2.2, which is between third neighbours in a hydrogen bonded chain and molecule in a nearby HB chain.
FIG. 8.
Radial distribution functions: our model (right column) and H-L/D model (left column). Top panels contain O-O sites; middle C-C sites and bottom panel C-O sites. The color code is contained in the legend box for each panel.
This is at variance with MB water, which lacks peaks at r* = 1.4 and r* = 2.2, while retaining those at r* = 1 and r* = 1.7, all due to formation of HBs (as showed in Silverstein et al.29, Figure 2).
The hydrophobic sites RDFs (Figure 8, middle panels) show liquid-like oscillations for both models. The C sites, on average, get closer as the temperature increases, demonstrating that the 2D system is more constrained by the Hbond interaction. Its two pronounced peaks at r* = 0.7 and r* = 1.5 correspond to the contact distance between two methyl groups, and the distance between two methyl groups in an Hbonded chain, respectively. The H-L/D 2D methanol, aside from the analogous two peaks at r* = 0.7 and r* = 1.5, also has another peak sandwiched between them. This peak, located at r* = 1.1, corresponds to the distance between two methyl groups when they are separated by the HB disk of one molecule (e.g. when their respective methanol molecules are positioned one after the other in a single line).
The cross correlations (OC), shown in Figure 8, bottom panels, have two pronounced peaks for first and second neighbours. Those peaks correspond to the contact distance between the two cross sites, and the distance between those two sites in an Hbonded chain. In the case of our 2D methanol, they are positioned at r* = 0.7 and r* = 1.5, while the more compact H-L/D model has the second peak located at a slightly smaller distance, r* = 1.2. The temperature dependence of the peaks’ positions is the same as for CC RDFs. The cross sites also get closer with the increase in temperature.
B. Thermodynamics
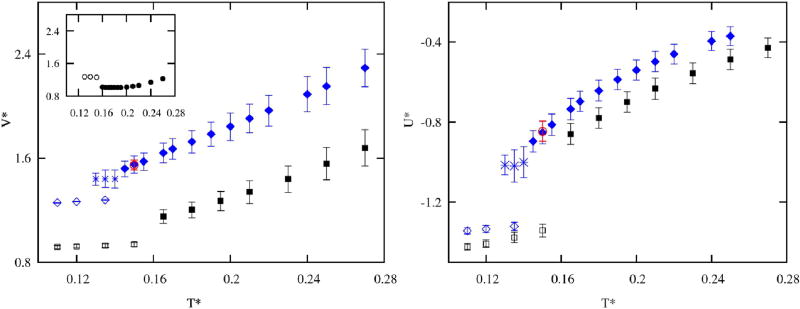
In this section, we examine how the preferential cluster-type structuring translates into the thermodynamic properties. The simulations protocols are described in sections III and IV, and the following color code was used. Black squares, both open and closed, represent the H-L/D model. Our model was depicted in a blue color filled diamonds are for data in the liquid and fluid phase; stars for the glassy region and open diamonds for the crystalline phase started from the ordered crystal configurations. The red open circle is the result for the system that started from the crystalline configuration and in the equilibrium ended at the same point as the system that started from the random configuration. Therefore we may conjecture that the melting point lies between temperatures for which the crystalline structure is stable and the one which exhibits melting. Based on the more detailed analysis of the thermodynamics in this section, we extrapolate the melting temperature for our model to be around 0.145 at pressure 0.19.
The dependence of volume on temperature, shown in Figure 9 (left panel), exhibits monotonous, almost linear behavior. As expected, the H-L/D model has smaller volume due to its more compact molecule. In the glassy and crystalline regions, the volumes remain almost constant. The temperature change of the potential energy (Figure 9, right panel) is correlated with the number of hydrogen bonds in the system (see Figure 6) and shows the same trends between the models, as well as smaller discrepancies when compared to the volume matching. Unlike water, methanol does not show any anomalous behavior in terms of molar volume (Figure 9, inset). The reason is the fact that MB methanol forms more compact structures due to only 2 HB arms and this compactness decreases with the increase of temperature. This is at variance with MB water which forms open low density structures, caused by three HB arms. Upon the increase of temperature, HBs melt and form more compact, denser structures. However, as the temperature is increased further, this compactness is diminished.
FIG. 9.
On the left panel volumes as functions of temperature, and in the inset temperature dependence of volume for MB water29 and on the right panel potential energies as functions of temperature. The color code is the following: blue filled diamonds are for liquid and fluid regime, and open for crystalline region, blue stars show glassy states and the red open point represents a simulation started from an initial crystal configuration. Black squares show H-L/D model results, filled liquid and fluid, and open crystal states.
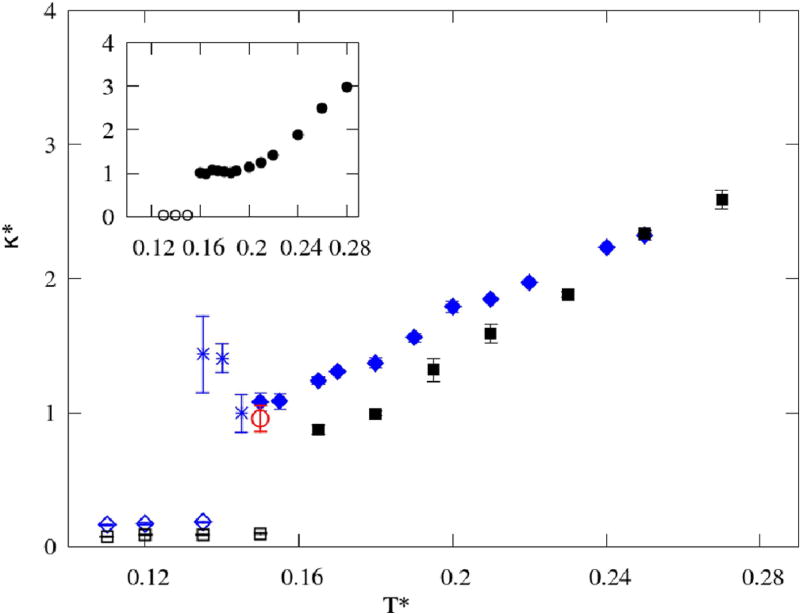
Even though the volumetric change with temperature appeared similar for both 2D models, the compressibility shows important differences, as presented in Figure 10. Similar tendencies are present only for the lower temperatures, with the smaller κ for H-L/D, and reduced fluctuations in the glassy or solid region. Both models show an increase of compressibility with the temperature, however, the smaller and less restricted H-L/D has a faster change, resulting in the κ for the H-D/L model becoming higher for T* = 0.25. It is interesting to notice that both models show a change of inclination around the same temperature (T* = 0.25), which might be connected to the loss of hydrogen bonds. Namely, for higher temperatures, the average number of bonds per molecule changes is less than 0.8, as presented in Figure 6. In comparison to MB water, the compressibility behaves similarly, however MB methanols do not display the pronounced minima present in MB water after melting29.
FIG. 10.
Isothermal compressibility κ as functions of temperature, with the MB water results29 shown in the inset. The color code is the same as in Figure 9.
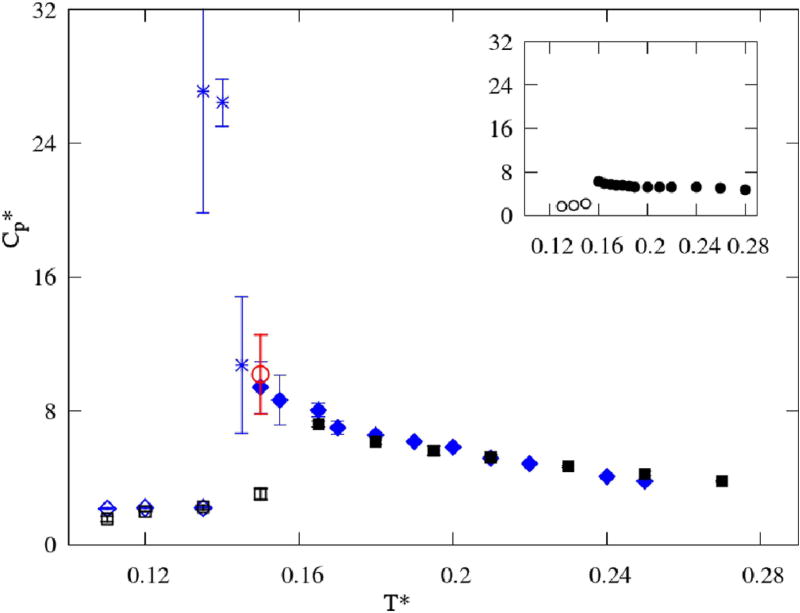
The most intriguing behavior is that of the heat capacity at constant pressure (Figure 11). The highest values for Cp(T) are observed in the glassy region and the difference between the values in liquid and in solid states is significant, as the 2D heat capacity is increasing with the temperature decrease. The results for both models are superimposed in the liquid region. This behavior is characteristic for water and has been successfully reproduced by the MB water model29. The hydrogen bonds work as additional energy storage, so with the drop in temperature the Hbond network is tightened, which then contributes to the rise of the heat capacity29. This effect is especially pronounced in 2D MB models, as the Hbonding primarily defines both the kinetics and energetics of the system at lower temperatures. Therefore, the key feature that drives enthalpy fluctuations is the hydrogen bond representation and the influence of the steric constraint, included by adding one more disk to MB water, is negligible.
FIG. 11.
Heat capacities CP as functions of temperature, with the MB water results29 in the inset. The color code is the same as in Figure 9.
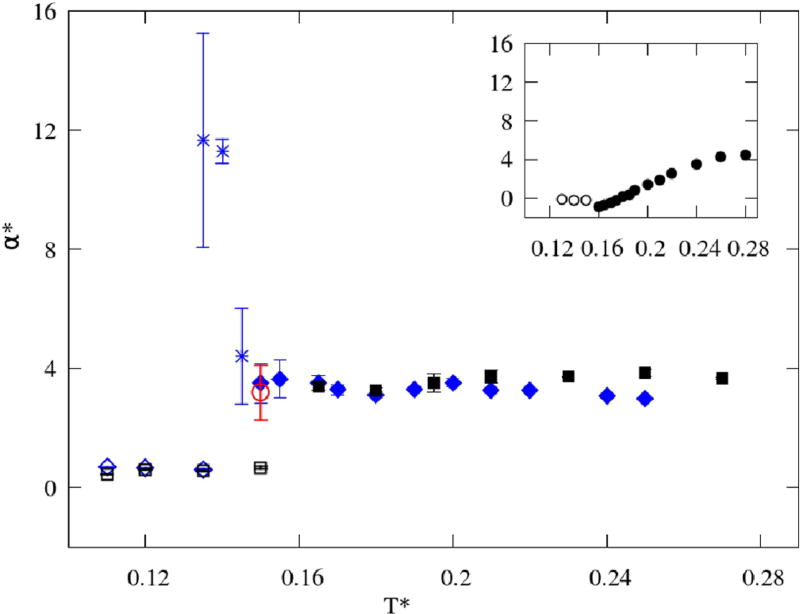
The opposite trends in enthalpy and volume fluctuation are combined in the isobaric expansion coefficient (Figure 12), which then reproduces very small variations of α(T) with values being some average of the other two. The 2D models differ mostly in the higher temperature region, same as the trends of compressibility (Figure 10). In regards to MB water, the trend is opposite. The reason for this lies in the different behavior of volume as a function of temperature.
FIG. 12.
Coefficients of isobaric expansion α as functions of temperature, with the MB water results29 shown in the inset. The color code is the same as in Figure 9.
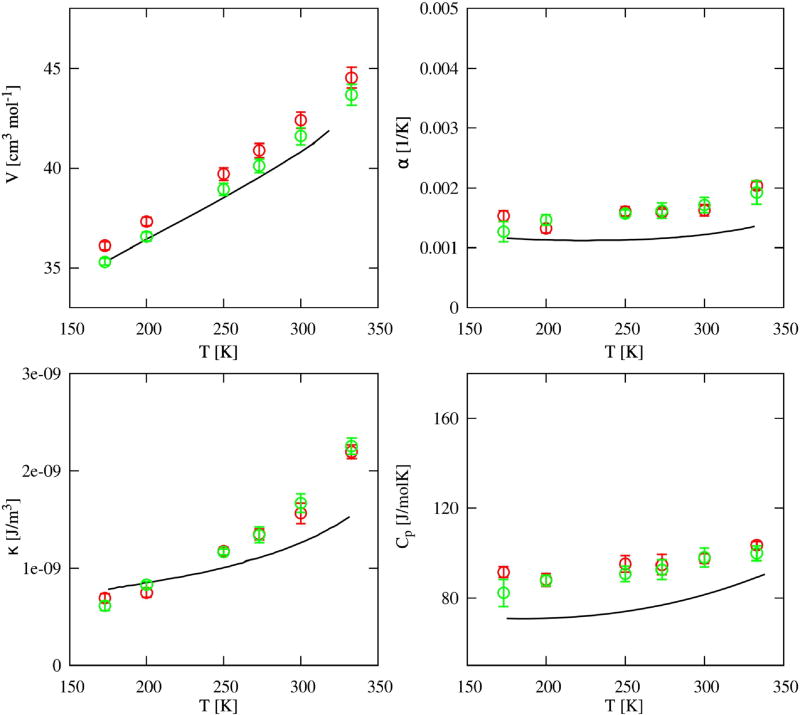
Finally, we tested whether the MB representation of the Hbonding would be equally satisfying in reproducing the thermodynamic properties of liquid methanol, as it was in the case of MB water. Therefore, we used similar simulation conditions such as the pressure and temperature range. The results for the 3D models, as well as experimental measurements70–75, are shown in Figure 13. The top panels are the volume and isobaric expansion coefficient temperature dependences, and bottom panels are the compressibility and heat capacity changes with temperature, all for the liquid states of bulk methanol, where black lines depict the experimental data and red and green circles simulation data for the OPLS and TraPPe model, respectively. The 3D models of methanol, as expected, agree well with the experimental results, with the TraPPe model performing better, especially in representing volumetric properties. Both models experience a slowdown of the systems’ dynamics for the two lowest temperatures, as evidenced in several calculated properties. This is consistent with the data for OPLS methanol shown in Vega’s paper6. As for the capacity of the 2D models to represent the temperature trends in thermodynamics of bulk methanol, the quantities connected to the volume fluctuations, such as density and isothermal compressibility, qualitatively follow experimental trends. Meanwhile, properties which are enthalpy and entropy dependent, like heat capacity and isobaric expansion coefficient, are more inclined to reproduce similar trends as MB water.
FIG. 13.
Thermodynamic results from experiments (black line) and simulations of 3D methanol models, open red circles for OPLS and green circles for TraPPE model. Top panels hold temperature dependence of volume on the left, and coefficients of isobaric expansion on the right, while bottom panels are temperature dependence of isothermal compressibility on the left and heat capacity on the right. Experimental results are V (T)70–73, α(T)75, κ(T)75, and CP (T)74.
VI. CONCLUSION
Here we present two-dimensional models, for which the system properties are the result of competition between two effects an apolar Lennard-Jones disk and a sphere with two hydrogen bonding arms as in the Mercedes Benz model of water. The former mimics the methyl group and favors random dense states, while the latter acts as the hydroxyl group, preferring ordered open states. The main idea is to uncover how these two opposing effects connect with the underlying structural and thermodynamic behavior.
We used two models which differ only in the distance between the discs, our model where two discs touch at the rim, and H-L/D model46 where there is an overlap of discs with the distance of the centers equal to the discs’ radius. The analysis of the properties for both models is calculated as a function of system temperatures. The volume dependent properties showed larger disagreement between the models. The H-D/L model exhibits crystallization at the lower temperature, while the larger model shows a tendency towards glassy states. However, both models follow similar trends, moreover the results for the heat capacity are the same. Similarly, both models exhibit cluster-like structuring. At low temperatures, the models adopt a stable crystal structure consisting of long zig-zag chains and at higher temperatures, they reproduce chain- and ring-like clustering. This organization is witnessed in every configuration, however, the signatures of the preferential clusters are only present at lower temperatures.
Comparing the results to the bulk 3D counterpart was not as promising as it was in the case of MB water and liquid water. The properties of water are highly defined by the three-dimensional hydrogen bonding, and the reduction in 2D keeps the similar symmetry and the energetics, preserving water features driven by the Hbond formation such as the density anomaly and the minimum of heat capacity. However, the amphipathicity of methanol or anisotropy of its constituents makes 3D to 2D reduction problematic. The hydrogen bonding, which shares an anisotropy in donor and acceptor bonds and leads to planar patterns, may be suitable for the 2D representation. But, its contribution due to the reduced kinetics is too strong and 2D systems exhibit some methanol-like and some water-like properties.
With that respect, more appealing directions might lead to connecting 2D models with the real methanol in reduced geometry. Morishige and Kawano76 argue that in a very small nanotube methanol shows possible vitrification observed in the diffraction pattern throughout a range of temperatures. In a recent article on methanol confined between two graphene sheets, authors Zangi and Roccatano77 show the formation of long chain phases at the lower temperature and the transition to small chains and rings at the high temperature for a dense methanol system. Comparison of the snapshots shows that our systems and confined methanol display very similar trends in structure depending changes with the temperature. This is further confirmed by similarities in the radial distributions functions as well as temperature dependence of the energy and hydrogen bonding77.
As for the temperature trends in thermodynamics, the heat capacity under constant pressure shows the most interesting behavior. In general, the heat capacity in the classical state is related to the number of degrees of freedom that may store thermal energy. For a simple system at higher temperatures, the majority of contributions comes from the kinetic degrees of freedom and in the case of simple solids from the thermal vibrations78. As for liquids or more complex systems, the theoretical approach is still under development79,80. In associated systems, the formations of the Hbonds provide an additional mechanism to store thermal energy. This is very important for water, where at lower temperatures near the freezing point, stabilizations of the Hbonds add to a very small but noticeable rise in the heat capacity29. Why isn’t a similar trend present in methanol? We may suppose that the key is in coupling kinetic degrees of freedom with the constraint imposed by Hbonding. 3D tetrahedral Hbonding highly influences the translational motion of each water molecule. At the lower temperature, where the kinetics is reduced even more by the temperature decrease, the Hbond contributions to the heat capacity define the change in trends. Methanol, on the other hand, has a smaller number of bonds and is just partly restricted by the bonding. Therefore, it shows the standard decrease of the heat capacity when approaching to the melting temperature.
In the case of confined methanol, the kinetics is reduced due to a spatial restriction and the Hbond contributions, as we speculate based on the 2D system thermodynamics, may win over the kinetics. It is also interesting to mention the transition observed in the measurement of the isochoric heat capacity of bulk methanol at high temperatures and high pressure81. The heat capacity in this critical region also exhibits an increase with the decrease of the temperature. A similar discussion may also relate to the supercritical methanol. Due to the high pressure, the kinetic degrees of freedom are also restricted, and the Hbond network governs the heat capacity. This experiment also highlights the issue of exploring the phase space for 2D models and obtaining a more reliable connection between 2D and 3D.
Finally, the investigation of confined liquids has gained noticeable research interest recently77,82, both for the physics of the mechanism behind observed structural, dynamical and thermodynamical changes, as well as potential applications83,84. A recent study of water encapsulated by graphene showed a structural order with low entropy and order-to-disorder transition at 480–490 K with the sharp reduction in a number of hydrogen bonds and increase in the entropy82. This study, as the authors state, provides an ideal platform to explore the thermodynamics of condensed matter in confined space. Our 2D results also indicate the possible change in thermodynamic trends for confined methanol, which is yet to be explored.
Highlights.
Simple model of methanol is developed
Model is based on MercedesBenz (MB) model of water
Thermodynamics and structural properties of the model are studied
Comparison was done with experimental results and with new simulations done for 3D models of methanol.
Acknowledgments
TU acknowledges the support by the NIH (GM063592) and Slovenian Research Agency (P1 0103–0201, N1-0042) and the National Research, Development and Innovation Office of Hungary (SNN 116198). FS, LZ, TP and MP thank the Croatian Science Foundation (Installation Research Project UIP-11-2013-4514) and the Croatian Ministry of science and education (Croatian-Slovenian collaboration 2016./2017.) for their financial support.
Footnotes
Publisher's Disclaimer: This is a PDF file of an unedited manuscript that has been accepted for publication. As a service to our customers we are providing this early version of the manuscript. The manuscript will undergo copyediting, typesetting, and review of the resulting proof before it is published in its final citable form. Please note that during the production process errors may be discovered which could affect the content, and all legal disclaimers that apply to the journal pertain.
References
- 1.Ulery BD, Petersen LK, Phanse Y, Kong CS, Broderick SR, Kumar D, Ramer-Tait AE, Carrillo-Conde B, Rajan K, Wannemuehler MJ, Bellaire BH, Metzger DW, Narasimhan B. Rational design of pathogen-mimicking amphiphilic materials as nanoadjuvants. Scientific Reports. 2011;1:198. doi: 10.1038/srep00198. [DOI] [PMC free article] [PubMed] [Google Scholar]
- 2.Förster S, Antonietti M. Amphiphilic block copolymers in structure-controlled nanomaterial hybrids. Advanced Materials. 1998;10:195. [Google Scholar]
- 3.Sloan ED. Fundamental principles and applications of natural gas hydrates. Nature. 2003;426:353. doi: 10.1038/nature02135. [DOI] [PubMed] [Google Scholar]
- 4.Narten AH, Habenschuss A. Hydrogen bonding in liquid methanol and ethanol determined by xray diffraction. The Journal of Chemical Physics. 1984;80:3387. [Google Scholar]
- 5.Magini M, Paschina G, Piccaluga G. On the structure of methyl alcohol at room temperature. The Journal of Chemical Physics. 1982;77:2051. [Google Scholar]
- 6.Gonzalez Salgado D, Vega C. Melting point and phase diagram of methanol as obtained from computer simulations of the opls model. The Journal of Chemical Physics. 2010;132:094505. doi: 10.1063/1.3328667. [DOI] [PubMed] [Google Scholar]
- 7.Huš M, Urbic T. Existence of a liquid-liquid phase transition in methanol. Physical Review E. 2014;90:062306. doi: 10.1103/PhysRevE.90.062306. [DOI] [PubMed] [Google Scholar]
- 8.Ludwig R. The structure of liquid methanol. ChemPhysChem. 2005;6:1369. doi: 10.1002/cphc.200400663. [DOI] [PubMed] [Google Scholar]
- 9.Yamaguchi T, Hidaka K, Soper AK. The structure of liquid methanol revisited: a neutron diffraction experiment at 80 c and +25 c. Molecular Physics. 1999;96:1159. [Google Scholar]
- 10.Zoranić L, Sokolić F, Perera A. Microstructure of neat alcohols: A molecular dynamics study. The Journal of Chemical Physics. 2007;127:024502. doi: 10.1063/1.2753482. [DOI] [PubMed] [Google Scholar]
- 11.Perera A, Sokolić F, Zoranić L. Microstructure of neat alcohols. Physical Review E. 2007;75:060502(R). doi: 10.1103/PhysRevE.75.060502. [DOI] [PubMed] [Google Scholar]
- 12.Bakó I, Jedlovszky P, Pálinkás G. Molecular clusters in liquid methanol: a reverse monte carlo study. Journal of Molecular Liquids. 2000;87:243. [Google Scholar]
- 13.Chitra R, Smith PE. Properties of 2,2,2-trifluoroethanol and water mixtures. The Journal of Chemical Physics. 2001;114:426. [Google Scholar]
- 14.Lee ME, van der Vegt NFA. A new force field for atomistic simulations of aqueous tertiary butanol solutions. The Journal of Chemical Physics. 2005;122:114509. doi: 10.1063/1.1862625. [DOI] [PubMed] [Google Scholar]
- 15.Perera A, Zoranić L, Sokolić F, Mazighi R. A comparative molecular dynamics study of watermethanol and acetonemethanol mixtures. Journal of Molecular Liquids. 2011;159:52. [Google Scholar]
- 16.Požar M, Lovrinčević B, Zoranić L, Mijaković M, Sokolić F, Perera A. A re-appraisal of the concept of ideal mixtures through a computer simulation study of the methanol-ethanol mixtures. The Journal of Chemical Physics. 2016;145:064509. [Google Scholar]
- 17.Galicia-Andrés E, Pusztai L, Temleitner L, Pizio O. Microscopic structure of methanol-water mixtures: Synchrotron x-ray diffraction experiments and molecular dynamics simulations over the entire composition range. Journal of Molecular Liquids. 2015;209:586. [Google Scholar]
- 18.González-Salgado D, Zemánková K, Noya EG, Lomba E. Temperature of maximum density and excess thermodynamics of aqueous mixtures of methanol. The Journal of Chemical Physics. 2016;144:184505. doi: 10.1063/1.4948611. [DOI] [PubMed] [Google Scholar]
- 19.Dougan L, Crain J, Finney JL, Soper AK. Molecular self-assembly in a model amphiphile system. Physical Chemistry Chemical Physics. 2010;12:10221. doi: 10.1039/c003407j. [DOI] [PubMed] [Google Scholar]
- 20.Su Z, Buldyrev SV, Debenedetti PG, Rossky PJ, Stanley HE. Modeling simple amphiphilic solutes in a jagla solvent. The Journal of Chemical Physics. 2012;136:044511. doi: 10.1063/1.3677185. [DOI] [PubMed] [Google Scholar]
- 21.Ackland GJ, Guerin JA. Structure of an amphiphilic lattice gas, and its relationship to microclustering of methanol in water. Physical Review E. 2006;73:021504. doi: 10.1103/PhysRevE.73.021504. [DOI] [PubMed] [Google Scholar]
- 22.Truskett TM, Debenedetti PG, Sastry S, Torquato S. A single-bond approach to orientation-dependent interactions and its implications for liquid water. The Journal of Chemical Physics. 1999;111:2647. [Google Scholar]
- 23.Dill KA, Truskett TM, Vlachy V, Hribar-Lee B. Modeling water, the hydrophobic effect, and ion solvation. Annual Review of Biophysics and Biomolecular Structure. 2005;34:173. doi: 10.1146/annurev.biophys.34.040204.144517. [DOI] [PubMed] [Google Scholar]
- 24.Nezbeda I, Kolafa J, Kalyuzhnyi YuV. Primitive model of water. Molecular Physics. 1989;68:143. [Google Scholar]
- 25.Nezbeda I, Iglesias-Silva GA. Primitive model of water. Molecular Physics. 1990;69:767. [Google Scholar]
- 26.Nezbeda I. Simple short-ranged models of water and their application. a review. Journal of Molecular Liquids. 1997;73:317. [Google Scholar]
- 27.Nezbeda I, Jirsak J. Water and aqueous solutions: simple non-speculative model approach. Physical Chemistry Chemical Physics. 2011;13:19689. doi: 10.1039/c1cp21903k. [DOI] [PubMed] [Google Scholar]
- 28.Andaloro G, Sperandeo-Mineo RM. Monte carlo simulation of hydrophobic hydration for pedagogical purposes. European Journal of Physics. 1990;11:275. [Google Scholar]
- 29.Silverstein KAT, Haymet ADJ, Dill KA. A simple model of water and the hydrophobic effect. Journal of the American Chemical Society. 1998;120:3166. [Google Scholar]
- 30.Silverstein KAT, Dill KA, Haymet ADJ. Hydrophobicity in a simple model of water: solvation and hydrogen bond energies. Fluid Phase Equilibria. 1998;150151:83. [Google Scholar]
- 31.Southall NT, Dill KA. The mechanism of hydrophobic solvation depends on solute radius. The Journal of Physical Chemistry B. 2000;104:1326. [Google Scholar]
- 32.Silverstein KAT, Dill KA, Haymet ADJ. Hydrophobicity in a simple model of water: Entropy penalty as a sum of competing terms via full, angular expansion. The Journal of Chemical Physics. 2001;114:6303. [Google Scholar]
- 33.Hribar B, Southall NT, Vlachy V, Dill KA. How ions affect the structure of water. Journal of the American Chemical Society. 2002;124:12302. doi: 10.1021/ja026014h. [DOI] [PMC free article] [PubMed] [Google Scholar]
- 34.BenNaim A. Statistical mechanics of waterlike particles in two dimensions. i. physical model and application of the percusyevick equation. The Journal of Chemical Physics. 1971;54:3682s. [Google Scholar]
- 35.Ben-Naim A. Statistical mechanics of water-like particles in two-dimensions. Molecular Physics. 1972;24:705. [Google Scholar]
- 36.Dias CL, Hynninen T, Ala-Nissila T, Foster AS, Karttunen M. Hydrophobicity within the three-dimensional mercedes-benz model: Potential of mean force. The Journal of Chemical Physics. 2011;134:065106. doi: 10.1063/1.3537734. [DOI] [PubMed] [Google Scholar]
- 37.Dias CL. Unifying microscopic mechanism for pressure and cold denaturations of proteins. Physical Review Letters. 2012;109:048104. doi: 10.1103/PhysRevLett.109.048104. [DOI] [PubMed] [Google Scholar]
- 38.Urbič T, Vlachy V, Kalyuzhnyi YuV, Southall NT, Dill KA. A two-dimensional model of water: Theory and computer simulations. The Journal of Chemical Physics. 2000;112:2843. [Google Scholar]
- 39.Urbič T, Vlachy V, Kalyuzhnyi YuV, Southall NT, Dill KA. A two-dimensional model of water: Solvation of nonpolar solutes. The Journal of Chemical Physics. 2002;116:723. doi: 10.1063/1.2779329. [DOI] [PubMed] [Google Scholar]
- 40.Urbič T, Vlachy V, Kalyuzhnyi YuV, Dill KA. Orientation-dependent integral equation theory for a two-dimensional model of water. The Journal of Chemical Physics. 2003;118:5516. [Google Scholar]
- 41.Urbič T, Vlachy V, Pizio O, Dill KA. Water-like fluid in the presence of lennardjones obstacles: predictions of an associative replica ornsteinzernike theory. Journal of Molecular Liquids. 2004;112:71. Recent Progress in Liquid State Theory. A collection of papers in the honour of Professor Myroslav Holovko on the Occasion of his 60th birthday. [Google Scholar]
- 42.Urbič T, Vlachy V, Kalyuzhnyi YuV, Dill KA. Theory for the solvation of nonpolar solutes in water. The Journal of Chemical Physics. 2007;127:174505. doi: 10.1063/1.2779329. [DOI] [PubMed] [Google Scholar]
- 43.Urbič T, Holovko MF. Mercedesbenz water molecules near hydrophobic wall: Integral equation theories vs monte carlo simulations. The Journal of Chemical Physics. 2011;135:134706. doi: 10.1063/1.3644934. [DOI] [PMC free article] [PubMed] [Google Scholar]
- 44.Williamson CH, Hall JR, Fennell CJ. Two-dimensional molecular simulations using rose potentials. Journal of Molecular Liquids. 2017;228:11. From simple liquids to macromolecular solutions: recent experimental and theoretical developments. In Honor of the 70th birthday of Vojko Vlachy. [Google Scholar]
- 45.Becker J-P, Collet O. Mercedes benz model of neutral amino-acid side chains. Journal of Molecular Structure: THEOCHEM. 2006;774:23. [Google Scholar]
- 46.Hribar-Lee B, Dill KA. Modeling simple alcohols in two dimensions. Acta Chimica Slovenica. 2006;53:257. [Google Scholar]
- 47.Sugisaki M, Suga H, Seki S. Calorimetric study of the glassy state. iii. novel type calorimeter for study of glassy state and heat capacity of glassy methanol. Bulletin of the Chemical Society of Japan. 1968;41:2586. [Google Scholar]
- 48.Allan DR, Clark SJ, Brugmans MJP, Ackland GJ, Vos WL. Structure of crystalline methanol at high pressure. Physical Review B. 1998;58:R11809. [Google Scholar]
- 49.Torrie BH, Weng S-X, Powell BM. Structure of the -phase of solid methanol. Molecular Physics. 1989;67:575. [Google Scholar]
- 50.Torrie BH, Binbrek OS, Strauss M, Swainson IP. Phase transitions in solid methanol. Journal of Solid State Chemistry. 2002;166:415. [Google Scholar]
- 51.Frenkel D, Smit B. Understanding Molecular Simulation. From Algorithms to Applications. Academic Press; 2002. [Google Scholar]
- 52.Landau LD, Lifshitz EM. Statistical Physics. 2013 [Google Scholar]
- 53.van der Spoel D, Lindahl E, Hess B, Groenhof G, Mark AE, Berendsen HJC. Gromacs: Fast, flexible, and free. Journal of Computational Chemistry. 2005;26:1701. doi: 10.1002/jcc.20291. [DOI] [PubMed] [Google Scholar]
- 54.Jorgensen WL. Optimized intermolecular potential functions for liquid alcohols. The Journal of Physical Chemistry. 1986;90:1276. [Google Scholar]
- 55.van Leeuwen ME, Smit B. Molecular simulation of the vapor-liquid coexistence curve of methanol. The Journal of Physical Chemistry. 1995;99:1831. [Google Scholar]
- 56.Haughney M, Ferrario M, McDonald IR. Pair interactions and hydrogen-bond networks in models of liquid methanol. Molecular Physics. 1986;58:849. [Google Scholar]
- 57.Haughney M, Ferrario M, McDonald IR. Molecular-dynamics simulation of liquid methanol. The Journal of Physical Chemistry. 1987;91:4934. [Google Scholar]
- 58.Schnabel T, Srivastava A, Vrabec J, Hasse H. Hydrogen bonding of methanol in super-critical co2: comparison between 1h nmr spectroscopic data and molecular simulation results. The Journal of Physical Chemistry B. 2007;111:9871. doi: 10.1021/jp0720338. [DOI] [PubMed] [Google Scholar]
- 59.Guevara-Carrion G, Nieto-Draghi C, Vrabec J, Hasse H. Prediction of transport properties by molecular simulation: Methanol and ethanol and their mixture. The Journal of Physical Chemistry B. 2008;112:16664. doi: 10.1021/jp805584d. [DOI] [PubMed] [Google Scholar]
- 60.Chen B, Potoff JJ, Siepmann JI. Monte carlo calculations for alcohols and their mixtures with alkanes. transferable potentials for phase equilibria. 5. united-atom description of primary, secondary, and tertiary alcohols. The Journal of Physical Chemistry B. 2001;105:3093. [Google Scholar]
- 61.Weerasinghe S, Smith PE. A kirkwoodbuff derived force field for methanol and aqueous methanol solutions. The Journal of Physical Chemistry B. 2005;109:15080. doi: 10.1021/jp051773i. [DOI] [PubMed] [Google Scholar]
- 62.Bussi G, Donadio D, Parrinello M. Canonical sampling through velocity rescaling. The Journal of Chemical Physics. 2007;126:014101. doi: 10.1063/1.2408420. [DOI] [PubMed] [Google Scholar]
- 63.Parrinello M, Rahman A. Crystal structure and pair potentials: A molecular-dynamics study. Physical Review Letters. 1980;45:1196. [Google Scholar]
- 64.Parrinello M, Rahman A. Polymorphic transitions in single crystals: A new molecular dynamics method. Journal of Applied Physics. 1981;52:7182. [Google Scholar]
- 65.Allen MP, Tildesley DJ. Computer Simulation of Liquids. Clarendon Press; Oxford: 1987. [Google Scholar]
- 66.Darden T, York D, Pedersen L. Particle mesh ewald: An nlog(n) method for ewald sums in large systems. The Journal of Chemical Physics. 1993;98:10089. [Google Scholar]
- 67.Martínez JM, Martínez L. Packing optimization for automated generation of complex system’s initial configurations for molecular dynamics and docking. Journal of Computational Chemistry. 2003;24:819. doi: 10.1002/jcc.10216. ibid. [DOI] [PubMed] [Google Scholar]; Martínez L, Andrade R, Birgin EG, Martínez JM. Journal of Computational Chemistry. 2009;30(13):21572164. doi: 10.1002/jcc.21224. [DOI] [PubMed] [Google Scholar]
- 68.Stillinger FH. Rigorous basis of the frenkelband theory of association equilibrium. The Journal of Chemical Physics. 1963;38:1486. [Google Scholar]
- 69.Lin T-J, Hsing C-R, Wei C-M, Kuo J-L. Structure prediction of the solid forms of methanol: an ab initio random structure searching approach. Physical Chemistry Chemical Physics. 2016;18:2736. doi: 10.1039/c5cp06583f. [DOI] [PubMed] [Google Scholar]
- 70.Radtsig AV. Viskositt und dichte von einwertigen n-alkoholen bei niedrigen temperaturen. Ukrainskii Fizicheski Zhurnal (Russian edition) 1967;12:681. [Google Scholar]
- 71.Levichev SA. Oberflchenspannung, dichte und exzessvolumina in binren und ternren lsungen. Fiziko-chimiceskie Svojstva Rastvorov(J.80) 1964:219. [Google Scholar]
- 72.Levichev SA. Composition and surface layer thickness of hexan-alcohols solutions. Vestnik Leningradskogo Universiteta. 1967:124. [Google Scholar]
- 73.Krestov GA. Volumeneigenschaften des systems wasser-methanol bei 278–318 k. Zhurnal Fizicheskoi Khimii. 1986;60:2202. [Google Scholar]
- 74.Khasanshin TS, Zykova TB. Specific heat of saturated monatomic alcohols. Journal of engineering physics. 1989;56:698. [Google Scholar]
- 75.Goodwin RD. Methanol thermodynamic properties from 176 to 673 k at pressures to 700 bar. Journal of Physical and Chemical Reference Data. 1987;16:799. [Google Scholar]
- 76.Morishige K, Kawano K. Freezing and melting of methanol in a single cylindrical pore: Dynamical supercooling and vitrification of methanol. The Journal of Chemical Physics . 2000;112(24):11023. [Google Scholar]
- 77.Zangi R, Roccatano D. Strings-to-rings transition and antiparallel dipole alignment in two-dimensional methanols. Nano Letters. 2016;16:3142. doi: 10.1021/acs.nanolett.6b00460. [DOI] [PubMed] [Google Scholar]
- 78.Dill KA, Bromberg S. Molecular Driving Forces: Statistical Thermodynamics in Biology, Chemistry, Physics, and Nanoscience. Garland Science; 2011. [Google Scholar]
- 79.Rowlinson JS, Swinton FL. Liquids and Liquid Mixtures. Butterworth Scientific; London: 1982. [Google Scholar]
- 80.Bolmatov D, Brazhkin VV, Trachenko K. Thermodynamic behaviour of supercritical matter. Nature Communications. 2013 Aug;4:2331. doi: 10.1038/ncomms3331. [DOI] [PubMed] [Google Scholar]
- 81.Abdulagatov IM, Polikhronidi NG, Abdurashidova A, Kiselev SB, Ely JF. Thermodynamic properties of methanol in the critical and supercritical regions. International Journal of Thermophysics. 2005;26:1327. [Google Scholar]
- 82.Jiao C, Duan S, Xu Z. Structures and thermodynamics of water encapsulated by graphene. Scientific Reports. 2017;7:2646. doi: 10.1038/s41598-017-02582-7. [DOI] [PMC free article] [PubMed] [Google Scholar]
- 83.Zanotti J-M, Judeinstein P, Dalla-Bernardina S, Creff G, Brubach J-B, Roy P, Bonetti M, Ollivier J, Sakellariou D, Bellissent-Funel M-C. Competing coexisting phases in 2d water. Scientific Reports. 2016;6:25938. doi: 10.1038/srep25938. [DOI] [PMC free article] [PubMed] [Google Scholar]
- 84.Goracci G, Monasterio M, Jansson H, Cerveny S. Dynamics of nano-confined water in portland cement comparison with synthetic c-s-h gel and other silicate materials. Scientific Reports. 2017;7(1):8258. doi: 10.1038/s41598-017-08645-z. [DOI] [PMC free article] [PubMed] [Google Scholar]


