

Abstract
Background
Recent large-scale clinical studies demonstrate that sodium-glucose cotransporter 2 (SGLT2) inhibitors protect the diabetic kidney. However, clinical and animal studies have not shown the changes of the total glomeruli in the whole kidney treated with SGLT2 inhibitors.
Methods
We performed computed tomography (CT) imaging on mice using synchrotron radiation to investigate the impact of luseogliflozin, a SGLT2 inhibitor, on the number and volume of glomeruli in the whole kidney.
Findings
We did not observe a significant difference in the total glomerular number (Nglom) among mice. Luseogliflozin redistributed the number of glomeruli in different regions, accompanied by the normalization of diabetes-augmented renal volume (Vkidney). Diabetic db/db mice had a larger glomerular volume in the mid-cortex than did control db/m mice, and luseogliflozin increased the glomerular volume in all renal cortical zones of the whole kidney in db/db mice. According to the multivariate regression analysis, hemoglobin A1c level was the most relevant determinant of Vkidney, not Nglom or mean glomerular volume (Vglom), indicating that hyperglycemia induced renal (tubular) hypertrophy, but not glomerular enlargement. Luseogliflozin increased hypoxia in the juxtamedullary region, sustained upregulated renal renin expression and plasma renin activity, and failed to decrease albuminuria by downregulating megalin in db/db mice.
Interpretation
Based on our findings, SGLT2 inhibitors may alter glomerular distribution and size in addition to their glucose-lowering effects, presumably by affecting oxygen metabolism and humoral factors.
Fund
Funding for this research was provided by The Japan Society for the Promotion of Science, the Japan Diabetes Foundation, and Asahikawa Medical University.
Abbreviations: micro-CT, microcomputed tomography; SPring-8, Super Photon ring-8 G electron volts the power output of the ring; SGLT, sodium/glucose cotransporter; HbA1c, hemoglobin A1c; UAE, urinary albumin excretion; PAS, periodic acid-Schiff; TR, Texas Red; Nglom, total glomerular number; Vglom, mean glomerular volume; SBP, systolic blood pressure; FBS, fasting blood sugar; Vkidney, kidney volume; Rglom/kidney, ratio of the total glomerular volume to the kidney volume; CV, coefficient of variation (SD/mean); EA, efferent arterioles; AA, afferent arterioles
Keywords: Sodium glucose cotransporter-2 inhibitor, Diabetic nephropathy, Glomerular number, Glomerular volume, Megalin, Hypoxia
Research in context.
Evidence before this study
Diabetic nephropathy (DN) is now a leading cause of end-stage renal failure and constitutes a major portion of progressive kidney disease. Knowing glomerular number and size is important to prevent or predict DN. Although humans have approximately one million glomeruli in each kidney, we can observe only approximately ten glomeruli obtained by renal biopsy, which is responsible for the underrepresentation of DN.
Recent large-scale clinical studies demonstrate that sodium-glucose cotransporter 2 (SGLT2) inhibitors protect the diabetic kidney. However, clinical and animal studies have not shown the changes in total glomeruli in the whole kidney treated with SGLT2 inhibitors.
Added value of this study
This is the first study to reveal the impacts of diabetes and an SGLT2 inhibitor on total glomerular number and mean glomerular volume throughout the kidney. This work was accomplished by developing an imaging and analysis system using synchrotron micro-CT. The loss of glomerular number was not involved in the pathogenesis of DN, and glomerular volume might be determined by complicated mechanisms and not simply by plasma glucose level. Moreover the SGLT2 inhibitor luseogliflozin changed the distribution of the glomeruli, increased glomerular size and decreased kidney volume in diabetic mice. These data suggest that luseogliflozin induces the remodeling of renal architecture and hemodynamics.
Implications of all the available evidence
The present work reveals the novel effects of an SGLT2 inhibitor on the glomeruli throughout the diabetic kidney as well as on oxygen metabolism, renin activity and megalin expression in the proximal tubular cells. Because these effects are at least partially independent of glucose-lowering actions, SGLT2 inhibitors may provide therapeutic target candidates to prevent DN rather than blood glucose levels, by altering oxygen metabolism and megalin-mediated protein reabsorption.
Alt-text: Unlabelled Box
1. Introduction
Diabetic nephropathy (DN) is now a leading cause of end-stage renal failure, and DN therefore constitutes a major proportion of progressive kidney disease cases. For the past several decades, DN was postulated to be a primarily glomerular disease, rather than a disease based on tubular interstitial lesions, and glomerular hypertrophy is pathophysiologically associated with glomerular sclerosis [1]. Although reversible glomerular hypertrophy is defined as the remission of the renal disease [2], glomerular enlargement leads to glomerular sclerosis, and then the glomerular size returns to normal or smaller sizes [3]. Finally, obsolete glomeruli are nonfunctional and are absorbed to reduce the number of glomeruli. The remaining glomeruli increase in size as a compensatory response to glomerular loss, leading to the viscous cycle of further glomerular sclerosis and shifting to a larger glomerular size by hyperperfusion. Thus, the glomerular size and number are very important data for predicting prognosis of the subjects with renal disease [[4], [5], [6]]. In contrast, the glomerular size did not correlate with the severity and the percentage of glomerulosclerosis in a previous study [2]. In addition, kidney biopsies from patients with insulin-dependent diabetes mellitus presenting with persistent albuminuria revealed correlations between the glomerular volume and the parameters of diabetic glomerulopathy that failed to reach significance [7]. Interestingly, the mean glomerular volume is not affected by the number of obsolescent glomeruli nor diabetes in Pima Indians, who have a very high prevalence of type 2 diabetes [8]. Thus, the impacts of diabetes on the glomeruli still remain controversial.
Two recent clinical trials, EMPA-REG OUTCOME [9] and CANVAS [10,11], have reported the renoprotective effects of sodium-glucose cotransporter 2 (SGLT2) inhibitors on DN. However, current clinical studies have not presented the pathological changes in the glomeruli by performing a renal biopsy of patients with diabetes who are treated with SGLT2 inhibitors. However, in an in vivo study, empagliflozin failed to improve albuminuria and glomerulosclerosis in diabetic db/db mice [12]. In contrast, an SGLT2-selective inhibitor, JNJ 39933673, prevented increases in urinary albumin excretion in db/db mice [13]. This change was associated with a decrease in mesangial expansion in db/db mice, as determined by periodic acid-Schiff (PAS) staining, but had no impact on glomerular size [13]. Therefore, the impacts of SGLT2 inhibitors on the glomeruli in vivo also remain controversial.
However, conventional methodologies have limitations that prevent a precise representation of glomerular structure [[14], [15], [16], [17], [18]]. Because the glomerulus, when open, forms a glomerular capillary tuft, the intracapillary contrast agent must accurately visualize the size of the open glomerulus. Thus, synchrotron radiation microcomputed tomography (micro-CT) in SPring-8 (Super Photon ring-8 G electron volts, the power output of the ring) [19] has been proposed as an alternative method for counting tiny glomeruli throughout the kidney without destroying it. Here, we show the impacts of diabetes and luseogliflozin, an SGLT2 inhibitor, on glomerular number and volume in whole kidneys from mice that were intravenously injected with contrast medium using synchrotron radiation micro-CT.
2. Materials and methods
2.1. Animal study
All animal experiments conformed to the National Institutes of Health Guide for the Care and Use of Laboratory Animals and were approved by the Research Center for Animal Life Science at Asahikawa Medical University. The male db/db (Leprdb/db) mice used as a model of type 2 diabetes [20] and db/m mice (on a C57BLKs/J background) used as controls were purchased from the Institute for Animal Reproduction (Ibaraki, Japan). The mice were housed on a 12-h light/dark cycle and provided regular chow, namely, MF (Oriental Yeast Co., Tokyo, Japan). All mice were assessed for glomerular morphology, body weight (BW), blood pressure, and hemoglobin A1c (HbA1c) levels. Systolic blood pressure (SBP) and mean blood pressure (MBP) were measured in conscious mice using an automated tail-cuff manometer system (MK-2000ST; Muromachi Kikai, Tokyo, Japan). The average of 10 consecutive measurements from each mouse was calculated. Glucose levels in whole blood extracted from the tail were quantified using a One Touch glucose analyzer (LifeScan Inc., Milpitas, CA, USA). HbA1c levels were measured using the DCA 2000 analyzer (Siemens Medical Solutions Diagnostics, Tokyo, Japan). Mice in each group were placed in metabolic balance cages for 24-h urine collections to measure urine samples. Plasma and renal cortical renin activities were measured using the fluorometric renin assay kit from Abcam (Ab138875, Abcam Inc., Cambridge, MA, USA) with a Tide Fluor™ 3 (TF3)/Tide. Quencher™ 3 (TQ3) fluorescence resonance energy transfer (FRET) peptide [21]. The fluorescent signal was measured using a GloMax® Discover multimode microplate reader (Promega, Madison, WI, USA). Renal function was assessed by measuring urinary albumin excretion (UAE) and plasma cystatin C levels, using ELISA kits for UAE (Exocell, Philadelphia, PA, USA) and plasma cystatin C (R&D Systems, Minneapolis, MN, USA).
Eight-week-old male db/db mice received luseogliflozin (0.01% in chow; 15 mg/kg/day) in a regular rodent diet (MF, Oriental Yeast, Tokyo, Japan) for 8 to 14 weeks to examine the effects of an SGLT2 inhibitor on the diabetic kidney. Following the treatment with luseogliflozin, we performed three series of studies. First, we measured the glomerular number and volume in mice using synchrotron micro CT-imaging at SPring-8. Second, we performed histological and biochemical studies, including the detection of hypoxia, immunohistochemical staining, western blots for megalin and electron microscopy of mouse tissue sections. Third, confocal microscopy was performed to determine albumin endocytosis in vivo. Luseogliflozin was provided by Taisho Pharmaceutical (Tokyo, Japan).
2.2. Kidney sample preparation for the analysis of glomerular morphology using synchrotron radiation micro-CT
The contrast medium was prepared using the protocol published by Toyota et al. [22]. Briefly, the contrast medium consisted of 40% wt/vol (in distilled water) BaSO4 and 8% wt/vol gelatin. Mice were anesthetized with pentobarbital (55 mg/kg of body weight, intraperitoneal injection). The abdomen and thorax were cut via a midline incision extending from the symphysis pubis to the jugulum. Three hundred units of heparin were injected in the beating left ventricle of the heart using a 24-gauge catheter. The right atrium was then cut, and the mouse was perfused first with 42 °C prewarmed heparinized saline (100 IU/ml heparin in 0.9% NaCl) and then with the contrast medium (42 °C). Immediately after perfusion, cold saline (<4 °C) was gently poured into the abdominal cavity. The mouse was carefully placed in an ice bucket for 10 min to solidify the contrast medium. Thereafter, the kidneys, which were filled with contrast medium, were removed and stored in a freezer.
2.3. Imaging of kidney samples
Samples were visualized using the synchrotron micro-CT system in BL20B2 at SPring-8 [19]. The synchrotron radiation beam is produced by deflecting the electron beam with a bending magnet, and the flux is much higher than laboratory X-ray sources. The X-ray was monochromatized with a Si (111) double crystal monochromator, and the beam then irradiated the samples. As the X-ray beam is approximately parallel, each horizontal line corresponded to a slice position along the rotation axis, and images of multiple slices (the slice pitch was equal to the pixel size, namely, the “cubic voxel”) were easily obtained in one rotation (3D-CT).
A high-resolution image detector (Beam monitor 5 and ORCA-Flash4.0; Hamamatsu Photonics, Hamamatsu, Japan) was used for radiographic imaging [23]. The format of the 3D image was 2048 × 2048 × 1320 pixels, with cubic voxels of 15.53 μm3 (3.72 × 10⁻⁶ mm3). The scintillator, which converts the X-ray beam to visible light, was a 25-μm layer of GADOX (Gd2O2S: Tb±, P43). The X-ray energy was 37.6 or 35 keV, and the exposure time per projection was 100 ms.
For each sample, 1800 radiographic images were acquired over an angular range of 0–180° within 3 min. In this study, the kidney sample, on the rotating stage was placed in an insulated chamber with double Kapton and foamed styrol walls and then scanned while cryogenic temperatures were maintained using dry ice. After scanning, we reconstructed the CT images from the radiographic images by using a conventional tomography algorithm and convolution back projection.
2.4. Segmentation of glomeruli and kidneys
When enhanced with contrast agents, glomeruli have higher CT values than other tissues. We therefore conducted segmentation based on a region-growing algorithm with multiple seed points to count the glomeruli within the whole kidney. Segmentation was conducted with constraints on anisotropy and the volume of the objects to filter out noise and remove unwanted objects.. The anisotropy ψ was defined as follows:
| (1) |
where λmax and λmin are the maximum and minimum eigenvalues of the object, respectively. The monochromatic X-ray used the absorption edge of the contrast media (barium), and the X-ray energy was 37.6 keV. In addition, CT imaging was conducted with an X-ray energy level of 35 keV when renal vessels neighboring the glomeruli-related streak artifacts were observed in 37.6 keV images, and these artifacts were substantially reduced in the 35 keV images. We introduced the following correction coefficient to compensate for the glomerular volume measurements conducted between the two energy levels of the beam:
| (2) |
where V and V′ are the volumes of glomeruli before and after the correction, respectively, and c is the correction coefficient. We imaged the samples with both 37.6 keV and 35 keV, and compared the volume of glomeruli at the same position to determine the correction coefficient (Supplemental Fig. 1).
Good linearity was observed between the glomerular volumes measured using the images obtained at 35 keV and those obtained at 37.6 keV. We applied a linear regression analysis using Eq. (2) that had no intercept to the data, and this calculation provided the correction coefficient c of 2.5966. The object volume was determined from the number of voxels in the object and the correction coefficient. Objects with an anisotropy of 0–0.75 and a corrected volume of 43,826–631,932 μm3 yielded an equivalent spherical diameter of 53–129 μm and were regarded as glomeruli. Finally, the spatial distribution of glomeruli within the kidney was assessed. For this experiment, the kidney was divided into 10 layers according to the normalized distance from the centroid of the kidney to the surface, and the number of glomeruli in each layer was counted.
2.5. Quantification of morphology
We repeated the experiment without contrast media (db/m, db/db, luseogliflozin-treated db/m or db/db mice; n = 5–6 mice per group) and the kidneys were fixed by perfusion as described in a previous study to confirm the histological findings [24]. We performed periodic acid-Schiff (PAS) staining on these sections using previously described methods to evaluate the changes in renal structure [24,25]. Using coronal sections of the kidney, 15 consecutive glomeruli per mouse were examined to evaluate the glomerular mesangial expansion. The mesangial expansion index was defined as the ratio of the mesangial area to the glomerular tuft area. The mesangial area was determined by assessing the PAS-positive and nucleus-free areas in the mesangium using ImageJ software (Image Pro Plus v. 6·0 for Windows, Media Cybernetics; Silver Spring, MD, USA). The semiquantitaive morphometric analysis of tubular injury was performed using the paraffin sections stained with PAS. Tubular damage was scored by evaluating the percentage of injured tubules showing dilation or atrophy, brush border loss, cell lysis, and cast formation in the corticomedullary junction and outer medulla. Armanni-Ebstein lesions were also evaluated by determining the percentage of injured tubules appearing empty or full of PAS-positive materials. Then, grading on a scale from one to five, where one indicated lack of injury, two indicated that <10% of tubules were injured, three indicated ≥10% and < 25% of tubules were injured, four indicated ≥25% and < 50% of tubules were injured, and five indicated that >50% of tubules were injured in 15 randomly selected fields of view (original magnification,400×) in each section per kidney. Morphometry was conducted in a blinded mannerby two experienced nephrologists.
2.6. Immunohistochemistry
Immunohistochemistry was performed with a rabbit polyclonal anti-renin antibody (1:400) (ab 180,608, Abcam Inc.), mouse polyclonal anti-megalin antibody (1:100) (Santa Cruz Biotechnology, Santa Cruz, CA, USA) and rabbit polyclonal anti-aquaporin 1 antibody (1:100) (Novus Biologicals, Littleton, CO, USA). Immunohistochemical staining was performed as previously described [25]. For the analysis, the total renin-immunoreactive area per kidney section was related to the number of visible glomeruli in the sections. For each kidney used for the morphometric analysis, 10 highly visible afferent arterioles were selected for measurement. Since 5–6 kidneys from mice in each experimental group were analyzed, 50–60 afferent arterioles were measured in each experimental group. The total renin-immunoreactive area multiplied by its mean intensity per kidney section was measured using ImageJ software. The immunoreactive score for megalin expression was determined by the extent of positive immunoreactivity: one for negative, two for positive immunoreactivity <10%, three for ≥10% and <25%, four for ≥25% and <50%, and five for >50% of each megalin-positive section.
2.7. Electron microscopy
Parts of the removed kidneys were cut into small tissue blocks (1 mm3) and fixed with 2.0% glutaraldehyde and 2.0% paraformaldehyde in 0.1 mol/l phosphate buffer at 4 °C. After fixation with 2% osmium tetroxide, the tissues were dehydrated in a series of graded ethanol solutions, and ethanol was then substituted with propylene oxide. The tissues were then embedded in epoxy resin. Ultrathin sections were double-stained with uranyl acetate and lead. Sections were examined under an electron microscope (JEM1200EX, JEOL, Tokyo, Japan) at 80 kV.
2.8. Western blot analysis
Total cellular extracts from mouse kidneys were prepared, and Western blotting was performed using a denaturing 3–8% Tris-acetate gel (Invitrogen, Carlsbad, CA, USA) under reducing conditions, as previously described [25]. Membranes were blocked and incubated with a primary rabbit anti-megalin antibody (kindly provided by Prof. Akihiko Saito, Niigata University Graduate School of Medical and Dental Sciences, Niigata, Japan) [26] for 2 h at room temperature, followed by an incubation with horseradish peroxidase-conjugated secondary antibodies for 1 h. For loading controls, the same membranes were stripped and reprobed with a β-actin antibody (Sigma-Aldrich, St. Louis, MO, USA). Immunoreactive proteins were detected using an enhanced chemiluminescence (ECL) system according to the manufacturer's instructions (Amersham). Immunoblots were quantified using National Institutes of Health ImageJ software. The ratio between the intensities of megalin and β-actin bands was used to normalize megalin expression in each sample.
2.9. Detection of renal hypoxia
For the detection of hypoxic conditions in mice, pimonidazole (60 mg/kg) was injected intraperitoneally 1 h before the animals were euthanized [27]. The kidneys were fixed by perfusion to eliminate artificial staining, as recommended in a previous study [27]. Staining was performed using Hydroxyprobe (Pharmacia International, Belmont, MA, USA), according to the manufacturer's instructions [25].
2.10. Confocal microscopy analysis of albumin endocytosis in vivo
Anesthetized mice were intravenously injected with 10 μg/g body weight of Texas Red (TR) conjugated-albumin (Molecular Probes, Eugene, OR, USA) 30 min before euthanasia [28]. TR-albumin was visualized using a confocal laser scanning biological microscope (Olympus Fluoview FV 1000, Olympus, Tokyo, Japan).
2.11. Statistics
The sample sizes for the animal studies were determined according to a previous publication [22] that studied the heterogeneity in glomerular volume distribution in a model of diabetic nephropathy but focused on different aspects. Values are presented as means±standard deviation (SD). All measured parametric variables were log(e) transformed for all statistical analyses. The significance of differences between groups was determined using unpaired Student's t-tests and one-, two-way repeated-measures ANOVAs with Bonferroni's multiple comparison post hoc tests as needed. Welch's corrections were used when variances between groups were unequal. Non-parametric analyses of histological scores were conducted using a Kruskal-Wallis test with the unpaired, non-parametric Mann-Whitney U test as a post hoc analysis. We used a multivariate linear regression model with a stepwise forward method to predict significant variations between variables. P-values <.05 were considered significant. The Spearman correlation coefficient was calculated to analyze the correlations between two variables using GraphPad Prism ver. 6.0 software (GraphPad, San Diego, CA, USA). The other statistical analyses described above were performed using SPSS ver. 24 (SPSS, Chicago, IL, USA). The sample exclusion criteria were determined before the CT scan for technical failures, such as mis-injection of the contrast medium in the left ventricle or insufficient perfusion.
3. Results
3.1. Glomerular number, volume, and distribution
We performed CT imaging on nondiabetic control db/m mice, type 2 diabetic model db/db mice [20] and luseogliflozin-treated db/db mice at 22 weeks of age with the medical imaging beamline BL20B2 at SPring-8 (Fig. 1a). The glomeruli filled with contrast medium were detected using synchrotron radiation micro-CT as described in a previous study using punched-out renal tissue specimens (column) [22] (Fig. 1b). Additional observations were performed on kidney samples after completing the micro-CT visualization to validate the quality of the synchrotron radiation micro-CT images. The histopathological findings of an optional cross-section were compared with CT images in the same layer. Corresponding glomerular images were consistent with the histological findings (Fig. 1c). Fig. 1d shows the results obtained from an automated 3D segmentation algorithm to identify individual glomeruli. Identified glomeruli are arbitrarily colored in slices of the 3D images of excised kidneys of contrast medium-injected mice (Fig. 1d). Then, the glomerular number (Fig. 1e), individual glomerular volume (Fig. 1e), kidney volume (Fig. 1f), and glomerular distribution in the kidney (Fig. 1g) were assessed using Amira software.
Fig. 1.

Detection of glomeruli in synchrotron radiation micro-CT images.
(a) Synchrotron radiation micro-CT imaging at SPring-8. (b) Images of glomerular tufts filled with contrast medium (gray-colored granules) (left panel, scale bar, 10 μm. right panel, scar bar, 2 mm). A representative axial image of the kidney of mice injected with contrast medium from the micro-CT dataset (right panel). (c) The two panels show magnified images of the sections identified by the squares in the left and right panels. The dimensions of the glomerulus measured in PAS-stained kidney sections (red circles) are similar to those measured in the CT image (white spots). Scale bars in PAS-stained sections, 300 μm. Scale bar in the left CT image, 2 mm. (d) The reconstructed data were analyzed with a 3D counting algorithm to identify individual glomeruli using the program Amira (left and middle panels). The glomeruli in 100 slices of CT images are displayed (right panel). Glomerular number and individual glomerular volume (e), kidney volume (left panel, scale bar, 2 mm) (f), and the distribution of glomeruli in 10 layers from the centroid (G) of the kidney to the surface (g) were assessed by using the program Amira.
3.2. Glomerular number and volume estimated by synchrotron radiation micro-CT at SPring-8
We did not observe a difference in the total glomerular number (Nglom) among the mice (Fig. 2a). The mean glomerular volume (Vglom) did not significantly increase in diabetic db/db mice compared to the control db/m mice, because of the wide distribution (Fig. 2b and Table 1). Interestingly, db/db mice treated with the SGLT2 inhibitor luseogliflozin (SGLT2i group) exhibited an increased Vglom compared with db/m mice (p < 0.01, one-way repeated-measures ANOVA with Bonferroni's multiple comparison post hoc tests), similar to db/db mice (p > 0.05) (Fig. 2b and Table 1). Consistent with the reduction in blood glucose levels (Fig. 3a, b and Supplemental Table 1), the SGLT2i group exhibited a reduction in whole kidney volume (390 ± 57.2 mm3 in db/db mice vs. 304.7 ± 52.08 mm3 in SGLT2i mice, p < 0.001) (Fig. 2c), but still showed glomerular hypertrophy (Fig. 2b and Table 1). Because the glomeruli constitute <2% of the total kidney volume (Fig. 2d and Table 1), these changes in renal volume were largely attributed to tubular volume, suggesting that the renal tubules are the susceptible lesions in diabetic db/db mice. The glomerular or renal hypertrophy observed in db/db mice was attributed to a decrease in the volume of the glomeruli or kidney normalized to the body weight (Fig. 2e and f), suggesting that either glomerular or renal sizes, but not Nglom (Fig. 2g), might be partially affected by body weight. The density of glomeruli per kidney (Nglom/Vkidney) was increased in the SGLT2i group, due to the attenuation of renal hypertrophy (p < 0.01, Fig. 2h). The mean glomerular volume normalized to the renal volume (Vglom/Vkidney) was not different among the mice, because of the wide distribution (Fig. 2i). A larger coefficient of variation (CV; SD/mean) of glomerular volume was calculated for db/db mice than db/m mice (0.472 ± 0.048 for db/m mice vs. 0.519 ± 0.044 for db/db mice, p < 0.001), and luseogliflozin restored this variation (Fig. 2j).
Fig. 2.


Glomerular number and volume estimated using synchrotron radiation micro-CT at SPring-8.
(a) The glomerular number (Nglom) in kidneys. (b) The mean glomerular volume (Vglom) in kidneys. (c) The renal volume (Vkidney). (d) The ratio of the total glomerular volume to the kidney volume (Rglom/kidney). (e) The normalized Vglom divided by body weight (BW) (Vglom/BW). (f) The normalized Vkidney divided by BW (Vkidney/BW). (g) The normalized Nglom divided by BW (Nglom/ BW). (h) The normalized Nglom divided by Vkidney (Nglom/Vkidney). (i) The normalized Vglom divided by Vkidney (Vglom/Vkidney). (j) CV (SD/mean of Vglom). (k) The histograms of glomerular volume in mice. (l) The number of glomeruli within each of the 10 spatial layers created by normalizing the distance from the surface to the centroid of the kidney. (m) The difference in mean glomerular volumes (Vglom) in the spatial distribution (from the surface to the juxtamedullary region). Black circles: db/m (n = 14); red triangles: db/db (n = 14); blue triangles: luseogliflozin-treated db/db mice (n = 6). Values are presented as means±standard deviation (SD). One-way (a-j) and two-way (k-m) repeated-measures ANOVAs with Bonferroni's multiple comparison post hoc tests, *p < 0.05, **p < 0.01, and p*** < 0.001.
Table 1.
Glomerular number, glomerular volume and kidney volume measured using synchrotron radiation micro-CT at SPring-8.
| Mouse Kidney | Nglom | Vkidney (mm3) | Nglom /Vkidney | Rglom/Kidney | Vglom (mm3) |
Vglom/Vkidney |
||||
|---|---|---|---|---|---|---|---|---|---|---|
| Mean | SD | CV | Mean | SD | ||||||
| db/m | Mean | 9546.29 | 322.22 | 29.68 | 0.81% | 2.70E-04 | 1.27E-04 | 4.72E-01 | 8.42E-07 | 3.97E-07 |
| n = 14 | SD | 1912.79 | 22.47 | 5.83 | 0.18% | 1.63E-05 | 1.15E-05 | 4.77E-02 | 6.23E-08 | 4.18E-08 |
| db/db | Mean | 9871.71 | 389.98 | 25.44 | 0.76% | 2.99E-04 | 1.55E-04 | 5.19E-01 | 7.75E-07 | 4.01E-07 |
| n = 14 | SD | 1434.65 | 57.20 | 2.90 | 0.16% | 4.16E-05 | 2.55E-05 | 4.41E-02 | 1.13E-07 | 5.95E-08 |
| SGLT2i | Mean | 10,168.5 | 304.66 | 34.11 | 1.22% | 3.48E-04 | 1.61E-04 | 4.68E-01 | 1.21E-06 | 5.55E-07 |
| n = 6 | SD | 1210.24 | 51.98 | 6.08 | 0.44% | 8.73E-05 | 3.49E-05 | 2.81E-02 | 4.78E-07 | 1.90E-07 |
Nglom: glomerular number; Vglom: glomerular volume; Vkidney: kidney volume: Rglom/Kidney: ratio of the total glomerular volume to kidney volume; CV: coefficient of variation (SD/mean).
Fig. 3.

The characteristics of type 2 diabetic model mice, and the effects of luseogliflozin on the laboratory parameters in db/db mice.
(a) FBS levels. (b) HbA1c levels. (c) BW. (d) SBP. (e) Mean blood pressure (MBP). (f) Food intake for 24 h. (g) Water intake for 24 h. (h) Urinary volume for 24 h. (i) Urinary albumin levels per day. (j) Plasma cystatin C levels. Black circles: db/m mice (n = 7); red triangles: db/db mice (n = 7); blue triangles: luseogliflozin-treated db/db mice (n = 3). Values are presented as means±standard deviation (SD). One-way repeated-measures ANOVA with Bonferroni's multiple comparison post hoc tests, *p < 0.05, **p < 0.01, and ***p < 0.001.
3.3. Spatial or regional heterogeneity of the glomeruli in diabetic mice
Next, we analyzed the distribution of the volume of individual glomeruli in the kidney (Fig. 2k). We identified an interaction between the distribution of glomerular volume and the group of mice using two-way ANOVA (p < 0.001). The glomerular volume was shifted rightward (larger volume) in diabetic db/db mice, particularly in luseogliflozin-treated db/db mice, compared to the db/m mice (Fig. 2k). We also analyzed the spatial distribution of the glomeruli in the ten segmented layers from the centroid to the surface of the kidney (Fig. 2l, m and Supplemental Table 2). We identified a weak interaction in the distribution of glomerular number between db/db and luseogliflozin-treated db/db mice (p = 0.050, two-way ANOVA, Fig. 2l). Luseogliflozin decreased the glomerular number in the juxtamedullary region by one-half compared with the db/m and db/db mice, accompanied by an increase in the number of glomeruli in the superficial cortex (Fig. 2l and Supplemental Table 2a). In addition, we observed a significant correlation in the distribution of glomerular volume (Vglom) between db/m and db/db mice (p = 0.004, two-way ANOVA, Fig. 2m and Supplemental Table 3). The db/db mice had significantly larger glomeruli in the mid-cortex compared with db/m mice (p < 0.01 at layer 0.7 and p < 0.05 at layer 0.8, post hoc independent and unpaired t-test, Fig. 2m and Supplemental Tables 2b and 3).
3.4. Luseogliflozin ameliorated hyperglycemia, but not albuminuria
The diabetic db/db mice showed higher fasting blood glucose levels than the lean control db/m mice (db/m mice 103.0 ± 28.5 mg/dl; db/db mice 433.3 ± 131.3 mg/dl, p < 0.001, one-way repeated-measures ANOVA with Bonferroni's multiple comparison post hoc tests; Fig. 3a and Supplemental Table 1), as well as HbA1c levels (db/m mice 3.73 ± 0.2%; db/db mice 9.59 ± 1.2%, p < 0.001; Fig. 3b and Supplemental Table 1). Although luseogliflozin decreased the blood glucose levels in the db/db mice (Fig. 3a and b), it did not induce hypoglycemia in the db/m mice (Supplemental Figs. 2 and 3). As described in previous studies [12,13,29], diabetes and the SGLT2 inhibitor increased the body weight of the db/db mice (Fig. 3c and Supplemental Table 1). The db/db mice are normotensive [[30], [31], [32]], and luseogliflozin did not decrease the blood pressure in any mice (Fig. 3d, e and Supplemental Table 1). Food intake (Fig. 3f and Supplemental Table 1) and water intake (Fig. 3g and Supplemental Table 1) were not significantly different among the mice due to the wide variation. Diabetic db/db mice developed polyuria (Fig. 3h and Supplemental Table 1) and exhibited significantly increased albuminuria (p < 0.001) (Fig. 3i and Supplemental Table 1). Luseogliflozin failed to decrease urinary albumin excretion in db/db mice (Fig. 3i, Supplemental Table 1, and Supplemental Figs. 2 and 3), as described in a recent study [12]. In all db/db mice, plasma cystatin C levels were significantly reduced, which indicates glomerular hyperfiltration (Fig. 3j and Supplemental Table 1). Luseogliflozin did not affect plasma cystatin C levels in db/db mice (Fig. 3j and Supplemental Table 1).
3.5. Determinants of Nglom or Vglom
We identified the factors associated with Nglom and Vglom in all mice to identify the determinants of Nglom and Vglom (Table 2 and Supplemental Table 4). Nglom was significantly correlated with Vglom (r = 0.500, p = 0.003, two-tailed Spearman's correlation coefficient) or systolic blood pressure (SBP) (r = 0.342, p = 0.048). Vglom was correlated with fasting blood sugar (FBS) level (r = 0.494, p = 0.003), urinary albumin excretion (UAE) (r = 0.507, p = 0.002) and water intake (r = 0.554, p = 0.001). Vkidney was correlated with almost all of the measured laboratory parameters except SBP, UAE and plasma cystatin C level.
Table 2.
Spearman's correlation coefficients for the mean glomerular number (Nglom), volume (Vglom) and renal volume (Vkidney) with laboratory characteristics in mice.
| Nglom |
Vglom |
Vkidney |
||||
|---|---|---|---|---|---|---|
| r | p | r | p | r | p | |
| Measured parameters | ||||||
| Nglom | 1.000 | 0.500 | 0.003 | 0.252 | 0.150 | |
| Vglom (mm3) | 0.500 | 0.003 | 1.000 | 0.160 | 0.367 | |
| Vkidney (mm3) | 0.252 | 0.150 | 0.160 | 0.367 | 1.000 | |
| Laboratory variables | ||||||
| Body weight (g) | 0.046 | 0.795 | 0.182 | 0.302 | 0.479 | 0.004 |
| Fasting blood sugar (mg/dl) | 0.295 | 0.090 | 0.494 | 0.003 | 0.699 | <0.001 |
| HbA1c (%) | 0.111 | 0.531 | 0.315 | 0.070 | 0.642 | <0.001 |
| Systolic blood pressure (mmHg) | 0.342 | 0.048 | 0.321 | 0.064 | 0.314 | 0.071 |
| Mean blood pressure (mmHg) | 0.017 | 0.923 | −0.01 | 0.997 | 0.438 | 0.010 |
| Urinary albumin (μg/day) | 0.166 | 0.347 | 0.507 | 0.002 | 0.313 | 0.071 |
| Cystatin C (ng/ml) | 0.225 | 0.202 | −0.291 | 0.095 | −0.275 | 0.116 |
Nglom: the mean glomerular number in the kidney; Vglom: the mean glomerular volume (Vglom) in the kidney; Vkidney: the kidney volume. The Spearman correlation coefficient was calculated to analyze the correlation between two variables. Bold values indicate significant correlations between two parameters.
Interestingly, FBS level was strongly correlated with Vglom in normoglycemic db/m mice (r = 0.8717, p = 0.0001) and diabetic db/db mice (r = 0.8186, p = 0.0006) (Fig. 4a). However, no correlation between FBS level and Vglom was observed in luseogliflozin-treated db/db mice (r = −0.7171, p = 0.0667) (Fig. 4a). The lack of a correlation between HbA1c levels and Vglom may result from the narrow range of HbA1c levels measured in any of the groups of mice (Fig. 4b). Thus, blood glucose levels per se do not determine the glomerular hypertrophy. Vkidney was positively correlated with FBS levels (r = 0.7005, p < 0.0001) (Fig. 4c) and HbA1c level (r = 0.042, p < 0.001) (Fig. 4d) in all mice, indicating that renal tubular volume, which occupies >90% of the renal volume, might depend on blood glucose level. Vglom was significantly correlated with UAE (r = 0.5067, p < 0.001) (Fig. 4e), but Vkidney was not correlated with UAE (r = 0.3133, p = 0.0712) (Fig. 4f).
Fig. 4.

Determinants of Nglom or Vglom.
(a) The correlation between FBS level and Vglom in mice. (b) The correlation between Vglom and HbA1c levels in mice. (c) The correlation between Vkidney and FBS in mice. (d) The correlation between Vkidney and HbA1c in mice. (f) The correlation between Vkidney and UAE. Black circles: db/m mice (n = 14); red triangles: db/db mice (n = 14); blue triangles: luseogliflozin-treated db/db mice (n = 6).
According to the results from the multivariate regression analysis with the stepwise forward method, the values measured by synchrotron micro-CT, such as CV, Vkidney and Vglom, were the most relevant determinants of Nglom (Table 3). However, UAE, water intake, food intake and Vkidney and Nglom were the determinants of Vglom, suggesting that hemodynamic or metabolic factors might change the glomerular volume (Table 3). Interestingly, body weight and HbA1c levels were determinants of Vkidney, indicating that renal hypertrophy is a characteristic of obesity or hyperglycemia (Table 3).
Table 3.
Multivariate linear regression analysis of the determinants of log(e) transformed glomerular number or mean glomerular volume in the kidney using a stepwise forward method.
| Model | Nglom | B | SEM | Standardized β | p-value |
|---|---|---|---|---|---|
| r2 = 0.533 | (Constant) | 7.183 | 1.402 | <0.001 | |
| CV | −1.105 | 0.234 | −0.639 | <0.001 | |
| Vkidney | 0.641 | 0.139 | 0.614 | <0.001 | |
| Vglom | 0.312 | 0.126 | 0.300 | 0.019 | |
| Model | Vglom | B | SEM | Standardized β | p-value |
|---|---|---|---|---|---|
| r2 = 0.667 | (Constant) | −7.927 | 1.045 | <0.001 | |
| UAE | 0.046 | 0.013 | 0.418 | 0.002 | |
| Water Intake | 0.324 | 0.063 | 0.954 | <0.001 | |
| Food Intake | −0.204 | 0.048 | −0.678 | <0.001 | |
| Vkidney | −0.553 | 0.121 | −0.551 | <0.001 | |
| Nglom | 0.267 | 0.104 | 0.278 | 0.016 | |
| Model | Vkidney | B | SEM | Standardized β | p-value |
|---|---|---|---|---|---|
| r2 = 0.515 | (Constant) | 6.603 | 0.335 | <0.001 | |
| Body weight | −0.426 | 0.121 | −0.835 | 0.001 | |
| HbA1c | 0.478 | 0.086 | 1.317 | <0.001 |
A multivariate linear regression model with the stepwise forward method was applied to test the ability of the log (e) transformed glomerular number (Nglom) to predict the mean glomerular volume (Vglom) in the kidney and vice versa. The kidney volume (Vkidney), coefficient variation (CV) of glomerular volume, HbA1c levels, body weight (BW), urinary volume, urinary albumin excretion (UAE), plasma cystatin C levels, systolic blood pressure, mean blood pressure, food intake, and water intake (all log (e) transformed) were used as the dependent variables in the model. Only the models that were ultimately selected are shown. The analysis was performed with SPSS software (ver. 24; SPSS, Chicago, IL). P-values <.05 were considered significant.
3.6. Luseogliflozin-induced tubular hypoxia and renin expression in the kidneys of diabetic mice
Although luseogliflozin failed to attenuate glomerular hypertrophy (Fig. 2b) or albuminuria (Fig. 3i, Supplemental Figs. 2 and 3, and Supplemental Table 1), luseogliflozin significantly ameliorated mesangial expansion, tubular injury and glycogen accumulation in the distal tubules (Armanni-Ebstein lesions) compared to non-treated db/db mice (Fig. 5a, b, and c). The renal proximal tubules are susceptible to diabetes-induced hypoxia [25], and phlorizin induces hypoxia in the juxtamedullary regions [33]. Therefore, we examined the presence of hypoxia in the kidneys of luseogliflozin-treated mice by staining with pimonidazole to explore the effects of luseogliflozin on hypoxia (Fig. 6a). Luseogliflozin significantly increased pimonidazole staining of the S3 segment of the proximal tubular cells (Fig. 6a), which were immunostained with aquaporin-1 (Fig. 6b), in the outer stripe of the kidney of db/db mice. In addition, luseogliflozin also induced hypoxia in the juxtaglomerular apparatus (JGA) (Fig. 6a, inset). Electron microscopy images showed an attenuation of the thickening of the basement membrane in luseogliflozin-treated db/db mice (Fig. 6c). Intriguingly, luseogliflozin markedly increased the number of large and confluent vesicles with a low density in juxtaglomerular (JG) cells (Fig. 6d), suggesting that the renin-producing cells were strongly stimulated for a prolonged period of time, and that SGLT2 inhibition may be involved in the activation of the renin-angiotensin system (RAS). Accordingly, renin immunoreactivity was still observed in the JGA of the luseogliflozin-treated db/db mice (Fig. 6e, lower left panel). In addition, luseogliflozin did not decrease diabetes-increased plasma renin activity (Fig. 6e, lower middle panel). A significant difference in cortical renin activity was not observed among mice (Fig. 6e, lower right panel).
Fig. 5.

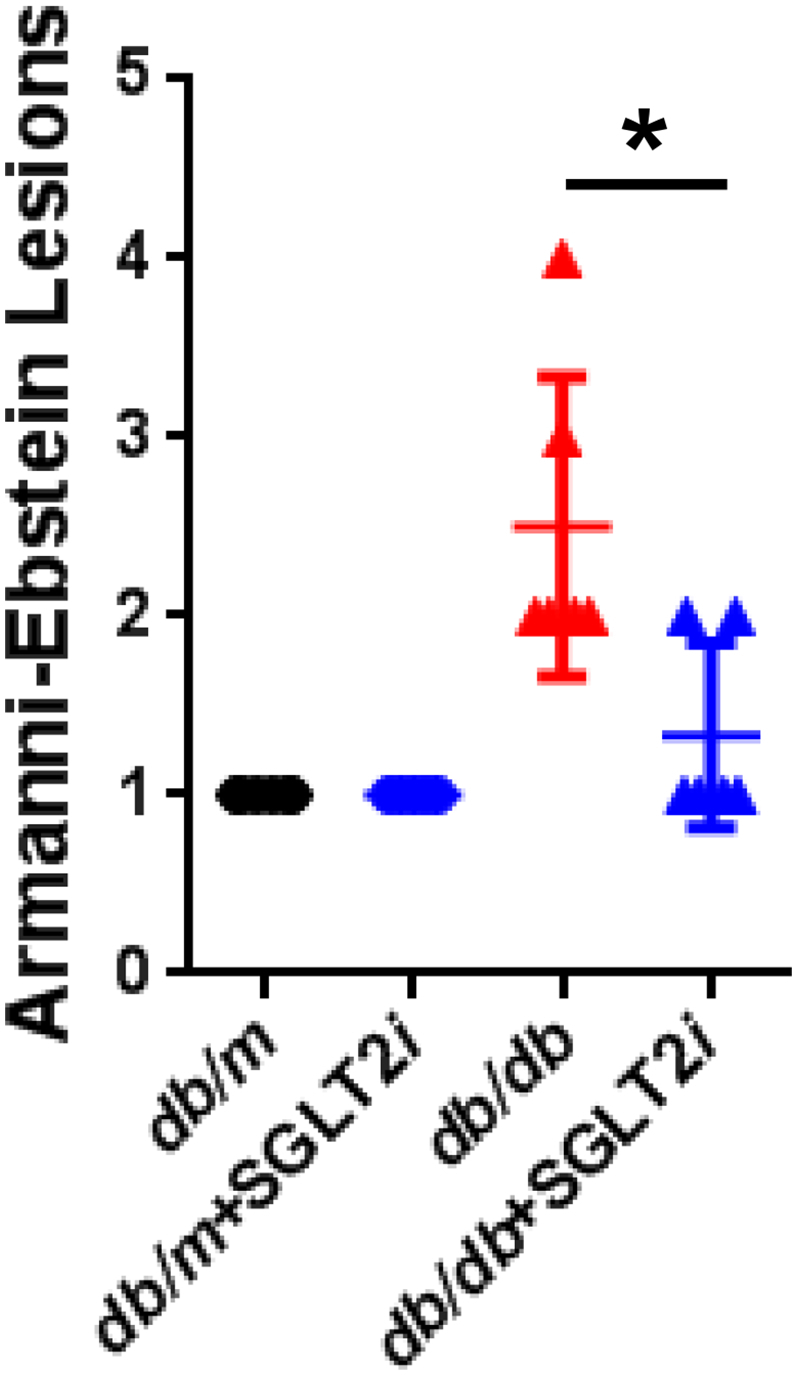
Representative images of PAS-stained kidney sections from each group of mice.
(a) Mesangial index. (b) Tubular damage score. Bar, 100 μm. (c) Armanni-Ebstein lesions. Arrows highlight glycogen accumulation in the distal tubules, such as the thick ascending limb of Henle's loop (TAL). Black circles: db/m mice (n = 6); blue circles: luseogliflozin-treated db/m mice (n = 5); red triangles: db/db mice (n = 6); blue triangles: luseogliflozin-treated db/db mice (n = 6). Bars, 300 μm in the upper panel and 30 μm in the middle and lower panels. Values are presented as means±standard deviation (SD). Kruskal-Wallis test with the unpaired, non-parametric Mann-Whitney U test as a post hoc analysis, *p < 0.05.
Fig. 6.


Luseogliflozin induced renal hypoxia and renin expression in db/db mice.
(a) Immunohistochemistry for the hypoxia marker pimonidazole. The inset shows positive pimonidazole staining in the macula densa and JG cells. Bars, 300 μm. Black circles: db/m mice (n = 6); blue circles: luseogliflozin-treated db/m mice (n = 5); red triangles: db/db mice (n = 6); blue triangles: luseogliflozin-treated db/db mice (n = 6). (b) Immunolocalization of aquaporin-1 and pimonidazole in the OSOM. Arrows show the colocalization of both proteins in the same tubular cells. Stars show the lack of staining of both proteins in the same tubular cells. Insets show higher magnification images of the selected areas. Bars, 300 μm in the upper panel and 30 μm in the middle and lower panels. OSOM: the outer stripe of the outer medulla; ISOM: the inner stripe of the outer medulla; IM: the inner medulla. (c) Representative electron microscopy images of the glomeruli of mice. Bars, 1 μm. (d) The vesicles of JG cells (arrow). Bars, 5 μm. (e) Immunohistochemistry for renin. Red arrows show the macula densa. Bars, 30 μm. Renin immunoreactivity (lower left panel). Plasma renin activity (lower middle panel). Cortical renin activity (lower right panel). Black circles: db/m mice (n = 5–6); blue circles: luseogliflozin-treated db/m mice (n = 3–5); red triangles: db/db mice (n = 6); blue triangles: luseogliflozin-treated db/db mice (n = 6). Values are presented as means±standard deviation (SD). Kruskal-Wallis test with the unpaired, non-parametric Mann-Whitney U test as a post hoc analysis, *p < 0.05 and **p < 0.01.
3.7. Luseogliflozin inhibited albumin uptake by decreasing megalin expression
Finally, we assessed the pathological mechanism underlying the sustained albuminuria in luseogliflozin-treated db/db mice. Intriguingly, luseogliflozin reduced the numbers of recycling vesicles and endosomes in db/db mice (Fig. 7a), as previously observed in megalin knock-out mice [34]. Megalin was expressed at higher levels in the cortex of db/m mice than in db/db mice (Fig. 7b, upper panel). We confirmed that db/db mice exhibited a significant decrease in the levels of the megalin protein in the kidneys using Western blotting, as shown in Fig. 7c (p < 0.05, one-way repeated-measures ANOVA with Bonferroni's multiple comparison post hoc tests). Luseogliflozin also decreased megalin expression in db/db mice (Fig. 7b, lower panel, and 7c), and decreased TR-albumin uptake (Fig. 7d), suggesting that luseogliflozin induced albuminuria in db/db mice by inhibiting megalin expression.
Fig. 7.


Luseogliflozin reduced the activity of the endocytic apparatus, megalin expression and albumin uptake in renal proximal tubules from db/db mice. (a) The numbers of recycling vesicles and endosomes (E) in the renal proximal tubules. Bars, 1 μm. (b) Images of megalin immunohistochemistry. Values are presented as means±standard deviation (SD). Kruskal-Wallis test with the unpaired, non-parametric Mann-Whitney U test as a post hoc analysis. (c) Western blot analysis of megalin expression in the mouse kidney. Values are presented as means±standard deviation (SD). One-way repeated-measures ANOVA with Bonferroni's multiple comparison post hoc tests, *p < 0.05. Black circles: db/m mice (n = 4); blue circles: luseogliflozin-treated db/m mice (n = 3); red triangles: db/db mice (n = 6); blue triangles: luseogliflozin-treated db/db mice (n = 6). (d) Representative confocal microscopy images of TR-conjugated albumin fluorescence in the proximal tubules of mice. These mice showed similar levels of albuminuria with different FBS levels, as shown in Supplemental Fig. 3. Lower panels show higher magnification images of the proximal cells presented in the upper panels. Bar, 20 μm in the upper panels. Red: TR-albumin.
4. Discussion
Our study is the first to reveal the impacts of diabetes and an SGLT2 inhibitor on Nglom and Vglom throughout the kidney, which was accomplished by developing an imaging and analysis system using synchrotron micro-CT. We observed glomerular enlargement in the mid-cortex of kidneys in diabetic db/db mice compared with control mice, but the difference in mean glomerular volume of total glomeruli was not significant because of the wide variation in a kidney and among mice (Fig. 2b and Table 1). In addition, luseogliflozin markedly ameliorated hyperglycemia (Fig. 3a, b, and Supplemental Table 1), but not glomerular hypertrophy (Fig. 2b and Table 1) in db/db mice. Based on these results, the glomerular volume might be determined by complicated mechanisms and not simply by the plasma glucose level.
A significant difference in the distribution of the glomerular number throughout the kidney was not observed between db/m and db/db mice, although db/db mice displayed diabetic renal injury with albuminuria. Traditionally, diabetic nephropathy has been classified as a glomerular disease. However, the histological predictor of the prognosis of patients with diabetic nephropathy is tubulointerstitial lesions, but not glomerular lesions [35,36]. Taken together, these findings indicate that glomerular loss is not involved in the pathological mechanism of diabetic nephropathy in db/db mice. Intriguingly, luseogliflozin redistributed and expanded the glomeruli, accompanied by the normalization of diabetes-induced renal hypertrophy, suggesting that the renal architecture was remodeled. Furthermore, the multivariate regression analysis with the stepwise forward method showed that HbA1c levels are the most relevant determinant of Vkidney, but not Nglom and Vglom, indicating that chronic hyperglycemia induces renal hypertrophy but does not affect the glomeruli.
The luseogliflozin treatment increased the number of vesicles with a low density (Fig. 6d), which have also been observed following strong, prolonged stimulation with isoproterenol [37]. The luseogliflozin treatment also induced renin protein accumulation in JG cells and plasma renin activity in db/db mice (Fig. 6e), consistent with previous reports [12,13]. During hypoxia, the β-adrenergic receptor signaling pathway increases renin release from JG cells [38]. In the present study, luseogliflozin induced hypoxia in the JGA of db/db mice (Fig. 6a, inset). Hypoxia stimulates renin secretion and renin gene expression in rats [39]. Therefore, in addition to volume depletion [40], SGLT2 inhibitor-induced hypoxia in the JGA might trigger the activation of the RAS. SGLT2 inhibition induces intrarenal RAS activity in diabetic mice [12,13], and increases circulating levels of RAS mediators in patients with type 1 diabetes [41,42]. The efferent arterioles (EA) are 10–100 times more sensitive to the vasoconstrictive properties of angiotensin (Ang) II than are the afferent arterioles (AA) [43,44]. Accordingly, the activation of the RAS by SGLT2 inhibitors might induce the vasocontraction of EA rather than AA. Indeed, in Dahl salt-sensitive diabetic rats, luseogliflozin alone fails to prevent diabetic renal injury, but exerts renoprotective effects in combination with ACE inhibitor [45]. Although further studies are required to verify these conclusions, luseogliflozin might fail to ameliorate glomerular enlargement due to the lack of favorable effects on EA (Fig. 2b). Intriguingly, the ACE inhibitor enalapril was shown to normalize glomerular pressure and glomerular sclerotic lesions, but not glomerular hypertrophy [46]. Thus, two renoprotective inhibitors targeting ACE and SGLT2 induced glomerular hypertrophy without glomerular injury. Collectively, the glomerular size does not correlate with the severity and the percentage of glomerulosclerosis or the severity of tubulointerstitial lesions.
SGTL2 is located in the S1 and S2 segments of proximal tubules, whereas SGLT1 is located in the S3 segment, which is susceptible to hypoxia [47]. SGLT2 inhibitors force SGLT1 to reabsorb glucose at its maximum capacity [48,49]. Thus, SGLT2 inhibitors enhanced hypoxia in the juxtamedullary region, which includes the S3 segment of proximal tubules (Fig. 6a and b). Although an SGLT2 inhibitor might protect the diabetic kidney by inducing hypoxia in the outer medulla, which may enhance erythropoiesis [50,51], SGLT2 inhibitors potentially lead to hypoxic renal injury. Therefore, we recommend the avoidance of the concomitant administration of non-steroidal anti-inflammatory drugs in radiocontrast studies [52,53]. Chronic hypoxia induces tubulotinterstitial fibrosis, which in turn could decrease the GFR [54]. In this regard, cortical hypoxia predicts a progressive decrease in renal function in patients with chronic kidney disease [55,56]. In contrast, SGLT2 inhibitors induced hypoxia in the outer stripe of the outer medulla (OSOM), but not in the cortex. These data, along with the amelioration of diabetic tubular injury by luseogliflozin, showed that SGLT2 inhibitor-induced hypoxia in the OSOM might exert less of an effect on the decrease in GFR.
Unexpectedly, we observed decreased activity of the endocytic apparatus and decreased cortical megalin expression in luseogliflozin-treated db/db mice (Fig. 7a, b, and c). In addition, we discovered that luseogliflozin reduced the uptake of TR-conjugated albumin in the proximal tubules of db/db mice (Fig. 7d). Based on these results, luseogliflozin decreased albumin uptake in the proximal tubules by reducing megalin expression and not by damaging the tubules, resulting in albuminuria. These effects are similar to the beneficial effects of a Nrf2 activator bardoxolone methyl [57]. Because megalin-mediated endocytic handling of substances filtered by the glomeruli is involved in tubular injury [58,59], luseogliflozin might exert its renoprotective effects by inhibiting the expression of the megalin protein.
Notably, increased mitochondrial oxygen consumption results in renal hypoxia and induces nephropathy without the complications of hyperglycemia or oxidative stress [60]. Based on the effects of luseogliflozin on the glomeruli and megalin, which are independent of its glucose-lowering effects, the renoprotective effects observed in the current study prompted the hypothesis that SGLT2 inhibitors ameliorate diabetic nephropathy by directly reducing oxygen consumption and avoiding decreased energy levels in renal proximal tubules by inhibiting the uptake of glucose, sodium and albumin and restoring intracellular hypoxia in cortical proximal tubular cells, which express SGLT2 and megalin. In an attempt to corroborate our hypothesis, an investigation of effects of luseogliflozin on mitochondrial oxygen consumption and hypoxia in the cortical proximal tubular cells is ongoing in our laboratories.
In conclusion, the current observations present the effects of SGLT2 inhibitors on the glomerular number, size and renal volume in diabetic mice. These effects of SGLT2 inhibitors are at least partially independent of their glucose-lowering actions, presumably by affecting oxygen metabolism and humoral factors, and these findings warrant further study.
Funding sources
This work was partially supported by a grant from the Japan Society for the Promotion of Science (JSPS KAKENHI grant no. JP15K09372 to Y.T.), and by a Research Grant from the Japan Diabetes Foundation and Asahikawa Medical University (Research Grant for Innovative Research in Life Science).
Conflicts of interests
Y.T. was also supported by several foundational grants, including grants from MSD, K.K., Eli Lilly and Company, Sanofi K.K., Takeda Pharmaceutical Co. and Taisho Pharmaceutical Co. No other potential conflicts of interest relevant to this article were reported.
Authors' contributions
Y.T., T.S. and M.N. conceived and designed the project and wrote the manuscript. Y.T., T.S., T.Y., M.K., R.B., T.T., H.K., H.S., and D.F. performed the experiments. M.H. and K.U. assisted with the synchrotron X-ray imaging experiments at SPring-8. Y.T., T.S., M.N., K.I., and Y.S. analyzed the data and interpreted the results with N.Y.. T.O. contributed to the discussion and reviewed the manuscript. M.H., Y.F., Y.M., and A.A, staffed proxy for outpatients during the experiments at SPring-8. All authors approved the final version of the manuscript. Y.T. is responsible for the integrity of the work as a whole.
Acknowledgments
We would like to thank Dr. A. Saito (Department of Applied Molecular Medicine, Niigata University Graduate School of Medical and Dental Sciences) for kindly providing the megalin antibody described in the Materials and Methods section and Dr. H. Funakoshi (Center for Advanced Research and Education, Asahikawa Medical University) for providing support for the animal experiments, and H. Hayakawa and Y. Watanabe (Animal Laboratory for Medical Research, Asahikawa Medical University) for their support in breeding and transporting mice. The authors also thank Taisho Pharmaceutical Co. for providing luseogliflozin through a material transfer agreement. These experiments were performed with the approval of the SPring-8 Proposal Review Committee (2012B1772, 2013A1655, 2013B1739, and 2015A1878). Some of the findings reported in the present study were presented in abstract form in November 2015 in conjunction with Renal Week 2015 in San Diego, CA.
Footnotes
Supplementary data to this article can be found online at https://doi.org/10.1016/j.ebiom.2018.09.048.
Appendix A. Supplementary data
Supplementary material
References
- 1.Hughson M.D., Johnson K., Young R.J., Hoy W.E., Bertram J.F. 2002. Glomerular size and glomerulosclerosis: relationships to disease categories, glomerular solidification, and ischemic obsolescence. Am J Kidney Dis. 2002;39(4):679–688. doi: 10.1053/ajkd.2002.31980. [DOI] [PubMed] [Google Scholar]
- 2.Nishimoto K., Shiiki H., Nishino T., Uyama H., Iwano M., Dohi K. Reversible glomerular hypertrophy in adult patients with primary focal segmental glomerulosclerosis. J Am Soc Nephrol. 1997;8(11):1668–1678. doi: 10.1681/ASN.V8111668. [DOI] [PubMed] [Google Scholar]
- 3.Young R.J., Hoy W.E., Kincaid-Smith P., Seymour A.E., Bertram J.F. Glomerular size and glomerulosclerosis in Australian aborigines. Am J Kidney Dis. 2000;36(3):481–489. doi: 10.1053/ajkd.2000.9788. [DOI] [PubMed] [Google Scholar]
- 4.Bilous R.W., Mauer S.M., Sutherland D.E., Steffes M.W. Mean glomerular volume and rate of development of diabetic nephropathy. Diabetes. 1989;38(9):1142–1147. doi: 10.2337/diab.38.9.1142. [DOI] [PubMed] [Google Scholar]
- 5.Hoy W.E., Hughson M.D., Bertram J.F., Douglas-Denton R., Amann K. Nephron number, hypertension, renal disease, and renal failure. J Am Soc Nephrol. 2005;16(9):2557–2564. doi: 10.1681/ASN.2005020172. [DOI] [PubMed] [Google Scholar]
- 6.Luyckx V.A., Brenner B.M. The clinical importance of nephron mass. J Am Soc Nephrol. 2010;21(6):898–910. doi: 10.1681/ASN.2009121248. [DOI] [PubMed] [Google Scholar]
- 7.Østerby R., Parving H.H., Hommel E., Jorgensen H.E., Lokkegaard H. Glomerular structure and function in diabetic nephropathy. Early to advanced stages. Diabetes. 1990;39(9):1057–1063. doi: 10.2337/diab.39.9.1057. [DOI] [PubMed] [Google Scholar]
- 8.Schmidt K., Pesce C., Liu Q., Nelson R.G., Bennett P.H., Karnitschnig H. Large glomerular size in Pima Indians: lack of change with diabetic nephropathy. J Am Soc Nephrol. 1992;3(2):229–235. doi: 10.1681/ASN.V32229. [DOI] [PubMed] [Google Scholar]
- 9.Wanner C., Inzucchi S.E., Lachin J.M., Fitchett D., von Eynatten M., Mattheus M. EMPA-REG OUTCOME Investigators. Empagliflozin and Progression of Kidney Disease in Type 2 Diabetes. N Engl J Med. 2016;375(4):323–334. doi: 10.1056/NEJMoa1515920. [DOI] [PubMed] [Google Scholar]
- 10.Neal B., Perkovic V., Mahaffey K.W., de Zeeuw D., Fulcher G., Erondu N. CANVAS Program Collaborative Group. Canagliflozin and Cardiovascular and Renal Events in Type 2 Diabetes. N Engl J Med. 2017;377(7):644–657. doi: 10.1056/NEJMoa1611925. [DOI] [PubMed] [Google Scholar]
- 11.Perkovic V., Zeeuw D., Mahaffey K.W., Fulcher G., Erondu N., Shaw W. Canagliflozin and renal outcomes in type 2 diabetes: results from the CANVAS Program randomized clinical trials. Lancet Diabetes Endocrinol. 2018;6(9):691–704. doi: 10.1016/S2213-8587(18)30141-4. [DOI] [PubMed] [Google Scholar]
- 12.Gallo L.A., Ward M.S., Fotheringham A.K., Zhuang A., Borg D.J., Flemming N.B. Once daily administration of the SGLT2 inhibitor, empagliflozin, attenuates markers of renal fibrosis without improving albuminuria in diabetic db/db mice. Sci Rep. 2016;6:26428. doi: 10.1038/srep26428. [DOI] [PMC free article] [PubMed] [Google Scholar]
- 13.Wang X.X., Levi J., Luo Y., Myakala K., Herman-Edelstein M., Qiu L. SGLT2 Protein Expression Is Increased in Human Diabetic Nephropathy: SGLT2 protein inhibition decreases renal lipid accumulation, inflammation, and the development of nephropathy in diabetic mice. J Biol Chem. 2017;292(13):5335–5348. doi: 10.1074/jbc.M117.779520. [DOI] [PMC free article] [PubMed] [Google Scholar]
- 14.Weibel E.R., Gomez D.M. A principle for counting tissue structures on random section. J Appl Physiol. 1962;17:343–348. doi: 10.1152/jappl.1962.17.2.343. [DOI] [PubMed] [Google Scholar]
- 15.Damadian R.V., Shwayri E., Bricker N.S. On the existence of non-urine forming nephrons in the diseased kidney if the dog. J Lab Clin Med. 1965;65:26–39. [PubMed] [Google Scholar]
- 16.Bertram J.F., Soosaipillai M.C., Ricardo S.D., Ryan G.B. Total numbers of glomeruli and individual glomerular cell types in the normal rat kidney. Cell Tissue Res. 1992;270(1):37–45. doi: 10.1007/BF00381877. [DOI] [PubMed] [Google Scholar]
- 17.Nyengaard J.R. Stereologic methods and their application in kidney research. J Am Soc Nephrol. 1999;10(5):1100–1123. doi: 10.1681/ASN.V1051100. [DOI] [PubMed] [Google Scholar]
- 18.Bertram J.F. Estimating glomerular number: why we do it and how. Clin Exp Pharmacol Physiol. 2013;40(11):785–788. doi: 10.1111/1440-1681.12133. [DOI] [PubMed] [Google Scholar]
- 19.Goto S., Takeshita K., Suzuki Y., Ohashi H., Asano Y., Kimura H. Construction and commissioning of a 215-m-long beamline at SPring-8. Nucl Instrum Methods Phys Res A. 2001;467-468:682–685. [Google Scholar]
- 20.Sharma K., McCue P., Dunn S.R. 2003. Diabetic kidney disease in the db/db mouse. Am J Physiol Renal Physiol. 2003;284(6):F1138–F1144. doi: 10.1152/ajprenal.00315.2002. [DOI] [PubMed] [Google Scholar]
- 21.Messaoudi S., He Y., Gutsol A., Wight A., Hebert R.L., Vilmundarson R.O. Endothelial Gata5 transcription factor regulates blood pressure. Nat Commun. 2015;6:8835. doi: 10.1038/ncomms9835. [DOI] [PMC free article] [PubMed] [Google Scholar]
- 22.Toyota E., Ogasawara Y., Fujimoto K., Kajita T., Shigeto F., Asano T. 2004. Global heterogeneity of glomerular volume distribution in early diabetic nephropathy. Kidney Int. 2004;66(2):855–861. doi: 10.1111/j.1523-1755.2004.00816.x. [DOI] [PubMed] [Google Scholar]
- 23.Uesugi K., Hoshino M., Yagi N. 2011. Comparison of lens- and fiber-coupled CCD detectors for X-ray computed tomography. J Synchrotron Radiat. 2011;18(Pt 2):217–223. doi: 10.1107/S0909049510044523. [DOI] [PMC free article] [PubMed] [Google Scholar]
- 24.Deji N., Kume S., Araki S., Soumura M., Sugimoto T., Isshiki K. Structural and functional changes in the kidneys of high-fat diet-induced obese mice. Am J Physiol Renal Physiol. 2009;296(1):F118–F126. doi: 10.1152/ajprenal.00110.2008. [DOI] [PubMed] [Google Scholar]
- 25.Takiyama Y., Harumi T., Watanabe J., Fujita Y., Honjo J., Shimizu N. Tubular injury in a rat model of type 2 diabetes is prevented by metformin: A possible role of HIF-1α expression and oxygen metabolism. Diabetes. 2011;60(3):981–992. doi: 10.2337/db10-0655. [DOI] [PMC free article] [PubMed] [Google Scholar]
- 26.De S., Kuwahara S., Hosojima M., Ishikawa T., Kaseda R., Sarkar P. Exocytosis-mediated urinary full-length megalin excretion is linked with the pathogenesis of diabetic nephropathy. Diabetes. 2017;66(5):1391–1404. doi: 10.2337/db16-1031. [DOI] [PubMed] [Google Scholar]
- 27.Rosenberger C., Rosen S., Paliege A., Heyman S.N. Pimonidazole adduct immunohistochemistry in the rat kidney: detection of tissue hypoxia. Methods Mol Biol. 2009;466:161–174. doi: 10.1007/978-1-59745-352-3_12. [DOI] [PubMed] [Google Scholar]
- 28.Yamahara K., Kume S., Koya D., Tanaka Y., Morita Y., Chin-Kanasaki M. Obesity-mediated autophagy insufficiency exacerbates proteinuria-induced tubulointerstitial lesions. J Am Soc Nephrol. 2013;24(11):1769–1781. doi: 10.1681/ASN.2012111080. [DOI] [PMC free article] [PubMed] [Google Scholar]
- 29.Jurczak M.J., Lee H.Y., Birkenfeld A.L., Jornayvaz F.R., Frederick D.W., Pongratz R.L. 2011. SGLT2 deletion improves glucose homeostasis and preserves pancreatic beta-cell function. Diabetes. 2011;60(3):890–898. doi: 10.2337/db10-1328. [DOI] [PMC free article] [PubMed] [Google Scholar]
- 30.Zhao H.J., Wang S., Cheng H., Zhang M.Z., Takahashi T., Fogo A.B. Endothelial nitric oxide synthase deficiency produces accelerated nephropathy in diabetic mice. J Am Soc Nephrol. 2006;17(10):2664–2669. doi: 10.1681/ASN.2006070798. [DOI] [PMC free article] [PubMed] [Google Scholar]
- 31.Belmadani S., Palen D.I., Gonzalez-Villalobos R.A., Boulares H.A., Matrougui K. 2008. Elevated epidermal growth factor receptor phosphorylation induces resistance artery dysfunction in diabetic db/db mice. Diabetes. 2008;57(6):1629–1637. doi: 10.2337/db07-0739. [DOI] [PMC free article] [PubMed] [Google Scholar]
- 32.Park C.W., Kim H.W., Lim J.H., Yoo K.D., Chung S., Shin S.J. Vascular endothelial growth factor inhibition by dRK6 causes endothelial apoptosis, fibrosis, and inflammation in the heart via the Akt/eNOS axis in db/db mice. Diabetes. 2009;58(11):2666–2676. doi: 10.2337/db09-0136. [DOI] [PMC free article] [PubMed] [Google Scholar]
- 33.O'Neill J., Fasching A., Pihl L., Patinha D., Franzen S., Palm F. Acute SGLT inhibition normalizes O2 tension in the renal cortex but causes hypoxia in the renal medulla in anaesthetized control and diabetic rats. Am J Physiol Renal Physiol. 2015;309(3):F227–F234. doi: 10.1152/ajprenal.00689.2014. [DOI] [PubMed] [Google Scholar]
- 34.Mori K.P., Yokoi H., Kasahara M., Imamaki H., Ishii A., Kuwabara T. Increase of total nephron albumin filtration and reabsorption in diabetic nephropathy. J Am Soc Nephrol. 2017;28(1):278–289. doi: 10.1681/ASN.2015101168. [DOI] [PMC free article] [PubMed] [Google Scholar]
- 35.Gilbert R.E., Cooper M.C. The tubulointerstitium in progressive diabetic kidney disease: more than an aftermath of glomerular injury? Kidney Int. 1999;56(5):1627–1637. doi: 10.1046/j.1523-1755.1999.00721.x. [DOI] [PubMed] [Google Scholar]
- 36.Mise K., Hoshino J., Ueno T., Hazue R., Hasegawa J., Sekine A. Prognostic Value of Tubulointerstitial Lesions, Urinary N-Acetyl-β-d-Glucosaminidase, and Urinary β2-Microglobulin in Patients with Type 2 Diabetes and Biopsy-Proven Diabetic Nephropathy. Clin J Am Soc Nephrol. 2016;11(4):593–601. doi: 10.2215/CJN.04980515. [DOI] [PMC free article] [PubMed] [Google Scholar]
- 37.Steppan D., Zugner A., Rachel R., Kurtz A. Structural analysis suggests that renin is released by compound exocytosis. Kidney Int. 2013;83(2):233–241. doi: 10.1038/ki.2012.392. [DOI] [PubMed] [Google Scholar]
- 38.Sequeira López M.L., Pentz E.S., Nomasa T., Smithies O., Gomez R.A. Renin cells are precursors for multiple cell types that switch to the renin phenotype when homeostasis is threatened. Dev Cell. 2004;6(5):719–728. doi: 10.1016/s1534-5807(04)00134-0. [DOI] [PubMed] [Google Scholar]
- 39.Kramer B.K., Ritthaler T., Schweda F., Kees F., Schricker K., Holmer S.R. Effects of hypoxia on renin secretion and renal renin gene expression. Kidney Int Suppl. 1998;67:S155–S158. doi: 10.1046/j.1523-1755.1998.06732.x. [DOI] [PubMed] [Google Scholar]
- 40.Škrtić M., Cherney D.Z. Sodium-glucose cotransporter-2 inhibition and the potential for renal protection in diabetic nephropathy. Curr Opin Nephrol Hypertens. 2015;24(1):96–103. doi: 10.1097/MNH.0000000000000084. [DOI] [PubMed] [Google Scholar]
- 41.Cherney D.Z., Perkins B.A., Soleymanlou N., Maione M., Lai V., Lee A. Renal hemodynamic effect of sodium-glucose cotransporter 2 inhibition in patients with type 1 diabetes mellitus. Circulation. 2014;29(5):587–597. doi: 10.1161/CIRCULATIONAHA.113.005081. [DOI] [PubMed] [Google Scholar]
- 42.Cherney D.Z., Perkins B.A., Soleymanlou N., Xiao F., Zimpelmann J., Woerle H.J. Sodium glucose cotransport-2 inhibition and intrarenal RAS activity in people with type 1 diabetes. Kidney Int. 2014;86(5):1057–1058. doi: 10.1038/ki.2014.246. [DOI] [PubMed] [Google Scholar]
- 43.Dávalos M., Frega N.S., Saker B., Leaf A. Effect of exogenous and endogenous angiotensin II in the isolated perfused rat kidney. Am J Physiol. 1978;235(6):F605–F610. doi: 10.1152/ajprenal.1978.235.6.F605. [DOI] [PubMed] [Google Scholar]
- 44.Arima S., Ito S. 2003. The mechanisms underlying altered vascular resistance of glomerular afferent and efferent arterioles in diabetic nephropathy. Nephrol Dial Transplant. 2003;18(10):1966–1969. doi: 10.1093/ndt/gfg263. [DOI] [PubMed] [Google Scholar]
- 45.Kojima N., Williams J.M., Slaughter T.N., Kato S., Takahashi T., Miyata N. Renoprotective effects of combined SGLT2 and ACE inhibitor therapy in diabetic Dahl S rats. Physiol Rep. 2015;3(7):e12436. doi: 10.14814/phy2.12436. [DOI] [PMC free article] [PubMed] [Google Scholar]
- 46.Fujihara C.K., Padilha R.M., Zatz R. Glomerular abnormalities in long-term experimental diabetes. Role of hemodynamic and nonhemodynamic factors and effects of antihypertensive therapy. Diabetes. 1992;41(3):286–293. doi: 10.2337/diab.41.3.286. [DOI] [PubMed] [Google Scholar]
- 47.Shanley P.F., Brezis M., Spokes K., Silva P., Epstein F.H., Rosen S. Transport-dependent cell injury in the S3 segment of the proximal tubule. Kidney Int. 1986;29(5):1033–1037. doi: 10.1038/ki.1986.103. [DOI] [PubMed] [Google Scholar]
- 48.Abdul-Ghani M.A., Defronzo R.A., Norton L. Novel hypothesis to explain why SGLT2 inhibitors inhibit only 30-50% of filtered glucose load in humans. Diabetes. 2013;62(10):3324–3328. doi: 10.2337/db13-0604. [DOI] [PMC free article] [PubMed] [Google Scholar]
- 49.Rieg T., Masuda T., Gerasimova M., Mayoux E., Platt K., Powell D.R. 2014. Increase in SGLT1-mediated transport explains renal glucose reabsorption during genetic and pharmacological SGLT2 inhibition in euglycemia. Am J Physiol Renal Physiol. 2014;306(2):F188–F193. doi: 10.1152/ajprenal.00518.2013. [DOI] [PMC free article] [PubMed] [Google Scholar]
- 50.Heyman S.N., Khamaisi M., Rosenberger C., Szalat A., Abassi Z. Increased hematocrit during sodium-glucose cotransporter-2 inhibitor therapy. J Clin Med Res. 2017;9(2):176–177. doi: 10.14740/jocmr2849w. [DOI] [PMC free article] [PubMed] [Google Scholar]
- 51.Layton A.T., Vallon V. SGLT2 inhibition in a kidney with reduced nephron number: modeling and analysis of solute transport and metabolism. Am J Physiol Renal Physiol. 2018;314(5):F969–F984. doi: 10.1152/ajprenal.00551.2017. [DOI] [PMC free article] [PubMed] [Google Scholar]
- 52.Heyman S.N., Khamaisi M., Rosen S., Rosenberger C., Abassi Z. Potential hypoxic renal injury in patients with diabetes on SGLT2 Inhibitors: caution regarding concomitant use of NSAIDs and iodinated contrast media. Diabetes Care. 2017;40(4):e40–e41. doi: 10.2337/dc16-2200. [DOI] [PubMed] [Google Scholar]
- 53.Tang H., Li D., Zhang J., Li Y., Wang T., Zhai S. Sodium-glucose cotransporter 2 inhibitors and risk of adverse renal outcomes among type 2 diabetes patients: a network and cumulative meta-analysis of randomized controlled trials. Diabetes Obes Metab. 2017;19(8):1106–1115. doi: 10.1111/dom.12917. [DOI] [PubMed] [Google Scholar]
- 54.Nangaku M. Chronic hypoxia and tubulointerstitial injury: a final common pathway to end-stage renal failure. J Am Soc Nephrol. 2006;17(1):17–25. doi: 10.1681/ASN.2005070757. [DOI] [PubMed] [Google Scholar]
- 55.Pruijim M., Milani B., Pivin E., Podhajska A., Vogt B., Stuber M. Reduced cortical oxygenation predicts a progressive decline of renal function in patients with chronic kidney disease. Kidney Int. 2018;93(4):932–940. doi: 10.1016/j.kint.2017.10.020. [DOI] [PubMed] [Google Scholar]
- 56.Zhou H., Yang M., Jiang Z., Ding J., Di J., Cui L. Renal hypoxia: An important prognostic marker in patients with chronic kidney disease. Am J Nephrol. 2018;48(1):46–55. doi: 10.1159/000491551. [DOI] [PubMed] [Google Scholar]
- 57.Reisman S.A., Chertow G.M., Hebbar S., Vaziri N.D., Ward K.W., Meyer C.J. Bardoxolone methyl decreases megalin and activates nrf2 in the kidney. J Am Soc Nephrol. 2012;23(10):1663–1673. doi: 10.1681/ASN.2012050457. [DOI] [PMC free article] [PubMed] [Google Scholar]
- 58.Liu D., Wen Y., Tang T.T., Lv L.L., Tang R.N., Liu H. Megalin/cubulin-lysosome-mediated albumin reabsorption is involved in the tubular cell activation of NLRP3 inflammasome and tubulointerstitial inflammation. J Biol Chem. 2015;290(29):18018–18028. doi: 10.1074/jbc.M115.662064. [DOI] [PMC free article] [PubMed] [Google Scholar]
- 59.Kuwahara S., Hosojima M., Kaneko R., Aoki H., Nakano D., Sasagawa T. Megalin-mediated tubuloglomerular alterations in high-fat diet-induced kidney disease. J Am Soc Nephrol. 2016;27(7):1996–2008. doi: 10.1681/ASN.2015020190. [DOI] [PMC free article] [PubMed] [Google Scholar]
- 60.Friederich-Persson M., Thörn E., Hansell P., Nangaku M., Levin M., Palm F. Kidney hypoxia, attributable to increased oxygen consumption, induces nephropathy independently of hyperglycemia and oxidative stress. Hypertension. 2013;62(5):914–919. doi: 10.1161/HYPERTENSIONAHA.113.01425. [DOI] [PMC free article] [PubMed] [Google Scholar]
Associated Data
This section collects any data citations, data availability statements, or supplementary materials included in this article.
Supplementary Materials
Supplementary material