Abstract.
Near-infrared diffuse optical tomography (DOT) has demonstrated a great potential as an adjunct modality for differentiation of malignant and benign breast lesions and for monitoring treatment response in patients with locally advanced breast cancers. The path toward commercialization of DOT techniques depends upon the improvement of robustness and user-friendliness of this technique in hardware and software. In this study, we introduce our recently developed ultrasound-guided DOT system, which has been improved in system compactness, robustness, and user-friendliness by custom-designed electronics, automated data preprocessing, and implementation of a new two-step reconstruction algorithm. The system performance has been tested with several sets of solid and blood phantoms and the results show accuracy in reconstructed absorption coefficients as well as blood oxygen saturation. A clinical example of a breast cancer patient, who was undergoing neoadjuvant chemotherapy, is given to demonstrate the system performance.
Keywords: diffuse optical tomography, ultrasound, near-infrared instrument, imaging reconstruction
1. Introduction
Breast cancer is the most common cancer among women and is expected to account for 29% of all new cancer diagnoses in women in 2018. Based on the statistics from American cancer society, there are around 2.8 million women with a history of breast cancer in the United States. In 2018, 266,120 new cases of invasive breast cancer along with 63,960 new cases of noninvasive breast cancer are expected to be detected in the United States.1 Despite the decrease in death rates for breast cancer since 1989, it is estimated that about 40,920 women in the United States will die in 2018 from breast cancer.1,2 Currently, many patients with invasive breast cancer undergo neoadjuvant treatment with chemotherapy or endocrine therapy. Locally advanced malignancy that substantially responds to neoadjuvant therapy may become amenable to breast conserving treatment.3 Neoadjuvant therapy affords the oncologist an opportunity to assess the in-vivo response to a specific treatment regimen and also provides important prognostic information. In particular, patients who achieved a pathological complete response (pCR) show improved survival rates as compared to those who did not respond completely.4
Different modalities have been used to assess patient response to neoadjuvant therapy. Ultrasound (US) and mammography show moderate sensitivity in the assessment of tumor response.5 Dynamic contrast-enhanced MRI and 18F-fluorodeoxyglucose positron emission tomography/computed tomography (PET/CT) have been utilized to predict breast cancer response to neoadjuvant therapy,6–8 and have shown their ability in early identification of response. However, MRI and PET/CT are expensive and require injection of contrast agents and their repeated use in monitoring patients during treatment is not feasible.
Near-infrared (NIR) diffuse optical tomography (DOT) is a noninvasive imaging technique that uses NIR light to estimate optical properties of tissue. Because of the minimal absorption of water in the NIR spectrum ( to 900 nm), light penetrates several centimeters in tissue. Within the NIR spectrum, oxygenated and deoxygenated hemoglobin ( and Hb) are the major chromophores to absorb light and can be used to characterize tumor vasculature, which is directly related to tumor angiogenesis.9–11 DOT systems are usually portable, require no contrast agents, and have relatively low cost. These excellent features make DOT systems an ideal modality for diagnosis of breast cancer and for assessment of neoadjuvant treatment response. However, the low spatial resolution and lesion location uncertainty caused by intense light scattering in tissue restrict its wide clinical use.
To overcome these limitations, conventional imaging-guided DOT was introduced, and several research groups have explored x-ray mammography-guided DOT,12,13 US-guided DOT,14–16 and MRI-guided DOT17–19 for breast cancer diagnosis and treatment assessment. Conventional imaging maps out lesion morphology and guides DOT reconstruction, which provides functional imaging to characterize the lesion vascularity and blood oxygenation saturation. Recent system advancements include MRI-guided wideband (660 to 948 nm), hybrid frequency-domain, and continuous-wave optical spectroscopy system.20 A digital x-ray tomosynthesis coupled NIR spectral tomography system for dual-modality breast imaging,21 and a three-dimensional coregistered dynamic DOT and digital breast tomosynthesis systems.22
We have reported initial results of using US-guided DOT for breast cancer diagnosis and for neoadjuvant chemotherapy assessment using our first and second generation DOT systems.14–16 The latest third generation prototype consisted of nine sources of four optical wavelengths in the range of 730 to 830 nm and 14 parallel photomultiplier tube (PMT) detectors.23 Initial results of monitoring and predicting patients’ neoadjuvant chemotherapy are reported in Ref. 24. In this paper, we present a fourth generation US-guided DOT system, which has the same number of sources and detectors as well as wavelengths as the third generation system, however, it is compact, has improved signal-to-noise ratio, and is user-friendly. The performance of the system was evaluated using solid and blood phantoms, and demonstrated by an example of breast cancer patient treated with neoadjuvant chemotherapy. The new system and the associated software bring our US-guided DOT technology one step closer to a wide clinical use.
2. Methods
2.1. System Structure
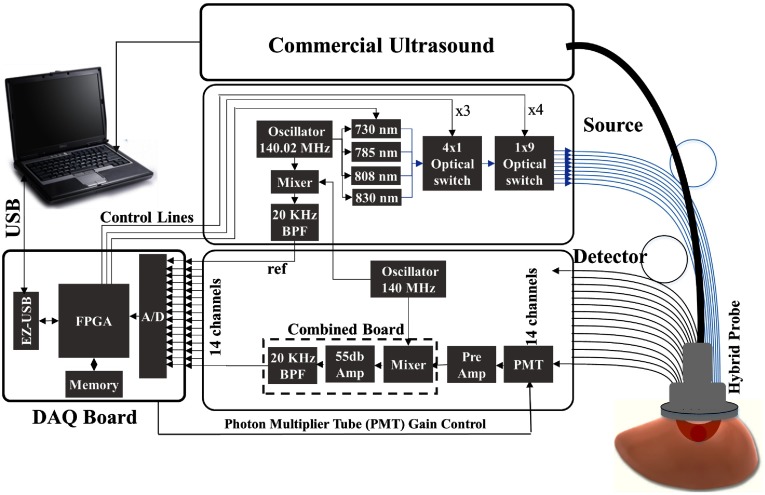
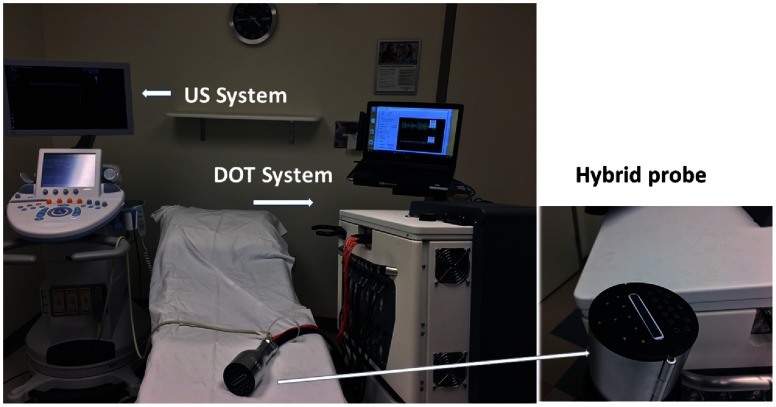
A compact frequency-domain DOT system was designed and constructed to improve the robustness of the earlier prototype DOT systems. Four laser diodes of wavelengths 730, 785, 808, and 830 nm were sequentially switched by and optical switches to nine source positions on a hand-held probe. The reflected light from each source location was received simultaneously by 14 PMT detectors. The entire data acquisition (DAQ) was about 3 to 4 s. The distance of sources and detectors is distributed between 3.2 and 8.5 cm. The system used heterodyne detection with the laser diodes modulated at 140.02 MHz and the detected signals were mixed with the 140 MHz reference signal. The output of the mixer at each channel was further amplified and filtered at 20 KHz before analog-to-digital converter (ADC). An instrument case meeting hospital safety standards was custom-designed and manufactured by Nexus LLC. Figure 1 shows the diagram of the system and Fig. 2 shows the clinical set-up at the Radiology Breast Imaging Clinics of Washington University School of Medicine in St. Louis.
Fig. 1.
Block diagram of the US-guided DOT system. The DOT system consists of source and detection subsystems controlled by a laptop through a FPGA.
Fig. 2.
Photograph of the US-guided DOT system used with a commercial US system. The system is used at the Radiology Department of Breast Imaging Clinics of Washington University School of Medicine in St. Louis.
2.2. Hardware Miniaturization
A miniaturized laser diode driver board, which could accommodate up to six laser diodes, was designed and constructed. A miniaturized detection circuit was designed and built to reduce the total number of unnecessary cables and cost.
2.2.1. Laser diode driver and cooling
The DOT system has two main blocks of source and detection subsystems. In our earlier prototypes, we used four units of Thorlab’s DC current driver and four units of temperature-controlled laser diode mounts with an AC modulation port (Thorlab LDM56/M) to drive four laser diodes. These units were bulky and costly. A custom-made laser diode driver board was designed to reduce the bulkiness and cost of these components. This board can accommodate up to six laser diodes of type A or C with a stable feedback control of DC current for each laser diode. Six built-in bias-tees each with a radio frequency (RF) input provide modulation to each laser diode. The outputs of the laser diodes were multiplexed via two optical switches (Piezosystem Jena) to nine different positions on the hand-held probe. Four miniature pigtailed laser diodes with a thermal block from OZ Optics (LDPC-T3) were used as sources and the temperature of the diodes were controlled using four units of control modules from Thorlabs (TCM1000T TEC). The total size of laser diodes, their driving circuits, and their associated cooling systems have reduced more than 60% as compared with our third generation prototype DOT system.
2.2.2. Miniaturized detection board and data acquisition board
A custom-made detection circuit has been designed and built in an effort to miniaturize the detection subsystem. As this system has two high frequency oscillators of 140 and 140.02 MHz, coherent interference at 20 kHz can be generated when these two frequencies beat. To minimize the interference, a three-layer printed circuit board (PCB) was designed with a ground layer between the top and bottom layer to reduce the interference. All traces of the top or bottom layer carried one high frequency signal. Grounded through holes were placed on both sides of the signal-carrying traces to provide improved signal shielding. This design practice results in a compact, low noise detection channel with three components of a frequency mixer, a second-stage amplifier, and a bandpass filter. A gain-adjustable second stage amplifier was designed to provide flexibility in controlling the dynamic range of the detection system. This new compact detection channel provided the same level of coherent noise when compared with each individual component separately shielded and connected. The overall recorded single channel coherent noise after 80 dB gain was to 10 mV peak-to-peak. The typical signal-to-noise ratio at source-detection distance of 8.5 cm for all four wavelengths was in the range of 10 to 20 dB measured in Intralipid solution. Some additional details about our newly developed system could be found in Ref. 25. This combined board replaced three separate components (mixer, amplifier, and filter) of the detection channel of the third generation DOT system. While the three components in the previous system occupied space of in total, this combined board occupies only , which has resulted in size reduction in the largest dimension.
Same as the third generation DOT system, we have used a custom-made field programmable gate array (FPGA) based DAQ board to reduce the DAQ size and improve its robustness. This miniaturized DAQ can accommodate up to 16 detection channels with two eight-channel ADC chips. In addition to DAQ, this board is used for controlling the optical switches and PMT gains. A laptop PC is used to communicate with the FPGA via a USB port.
2.3. Probe Design
The US transducer was located in the center of the probe to localize the lesion. In order to use PMT detectors in their maximum dynamic range and prevent the saturation when source and detection positions are closer, the source–detector distances have been optimized by locating 9 sources on one side of the probe and the 14 detectors on the opposite side of the probe. Figure 2 inset shows the close-up view of the hand-held probe. A US transducer can be easily inserted into the combined probe holder before coregistered imaging and then unplugged after imaging.
2.4. Software Improvement
Improvements in robustness and user-friendliness of the software for DOT are among the most important steps toward wide use in clinics. A new graphical user interface using C++ with three modules has been developed. The first module is DAQ as discussed above. The second module consists of automated system calibration. Since individual PMTs have different gains, individual detection electronic channels introduce different phase shifts, and two optical switches have different loses and phase shifts for individual source positions, we calibrate the gains and phase shifts for all detection channels and source positions.26 A set of measurements obtained from Intralipid solution of known background absorption and scattering properties was used to form a set of equations. Relative gains and phase delays associated with detector positions and source positions were calculated based on the least square method. These calibration parameters were applied to the amplitude and phase measurements of the contralateral normal breast before calculating bulk optical properties of the tissue. This calibration method was robust and has been used for automated system calibration. The third module is imaging reconstruction, which incorporates our recently developed outlier removal and data selection method before reconstruction to eliminate the need for time-consuming data preprocessing.27 It also includes a semiautomated method to select the region of interest (ROI) from coregistered US images and then uses the ROI for DOT image reconstruction.28 Briefly, the overall method performs outlier removal, data selection, and data-filtering processes automated for US-guided DOT. The preprocessing method consists of multiple steps to first combine multiple datasets collected from the contralateral normal breast of the study patient and forms a robust reference dataset. First, all datasets from the contralateral normal breast were stacked together and a statistical method was used to remove outliers from the measurements of each source–detector pair one by one for all pairs. Then, an iterative reweighted least square method was used to fit the remaining data and any data point with the residue more than the empirically selected threshold was eliminated from the dataset. Next, for each source and detector pair, the closest measurement to the center of the remaining data points was selected as the representative of that source–detector pair. By combining the selected measurement for each source–detector pair, a compound and robust reference dataset was formed. And finally, a filtering method was used to remove the outliers from the perturbation measurements using a model-based analysis.27
Imaging reconstruction was performed after data preprocessing and selection of ROI from coregistered US. The reconstruction used our recently developed two-step image reconstruction method, which have shown improved reconstruction accuracy and speed compared to the previously used conjugate gradient method in US-guided DOT reconstruction.29 Briefly, a truncated Moore–Penrose pseudoinverse solution is computed first to obtain the initial estimate of the optical properties of a lesion. Next, a penalized least-squares estimator is employed to compute the final estimate using the Newton optimization method. This two-step method showed improvement in accuracy of reconstructed phantom targets of different sizes and different optical properties located at different depths. These automated data preprocessing procedures and reconstruction will be fully tested with more patients in a prospective clinical study.
3. Phantom Results
Multiple phantom experiments have been designed to evaluate the performance of the system. Phantoms were placed in the Intralipid solution with absorption coefficient of 0.015 to and reduced scattering coefficient of 7 to . In the first sets of experiments, the sensitivity of the system to differentiating high contrast and low contrast phantoms has been tested. Two sets of solid phantoms with absorption coefficient of 0.11 and and reduced scattering coefficient the same as the Intralipid medium measured at 785 nm have been used. These phantoms of three different sizes (diameters of 1, 2, and 3 cm) located at different depths include two small 1 cm high and low contrast balls (SHC, SLC), two medium 2 cm high and low contrast balls (MHC, MLC), and two large 3-cm high and low contrast balls (LHC, LLC).
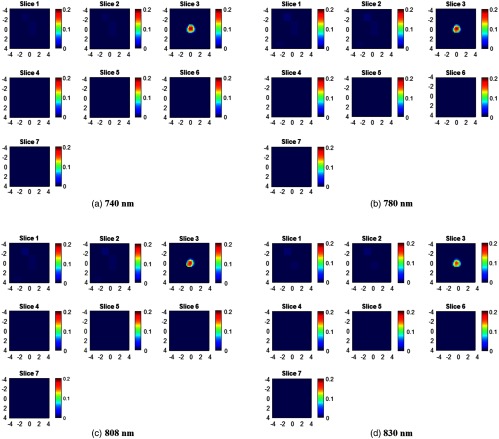
Figure 3 shows an example of reconstructed images of a SHC ball located at the 1.0 cm depth (top position) inside the Intralipid solution. The reconstruction was performed using the two-step Newton optimization for inversion.29 The reconstructed maximum absorption coefficients of four wavelengths (730, 785, 808, and 830 nm) are 0.233, 0.238, 0.216, and , respectively.
Fig. 3.
Target absorption maps (a) 730 nm, (b) 785 nm, (c) 808 nm, and (d) 830 nm of a SHC phantom located at 1.0 cm depth (target top position). For each absorption map, seven slices from 0.5 to 3.5 cm depth with 0.5-cm increment have reconstructed. The spatial dimensions of each slice are . Color bar is the absorption coefficient in the unit of .
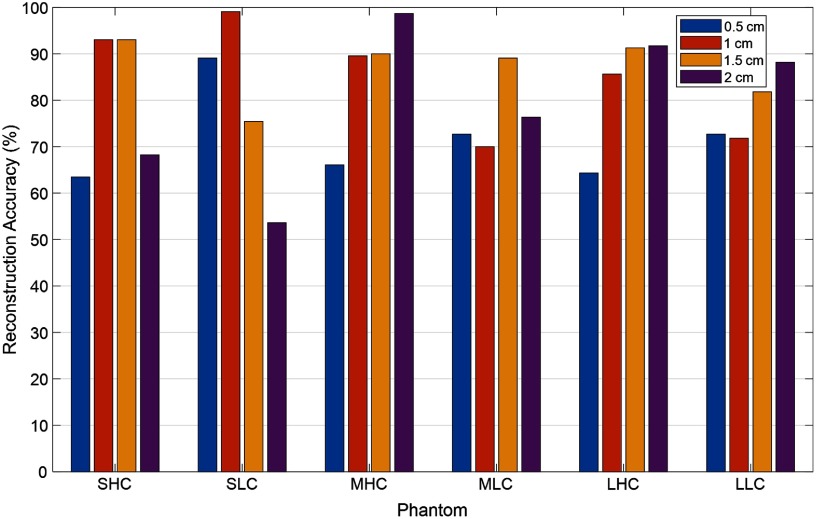
Figure 4 shows the reconstruction accuracy (%) of the maximum reconstructed absorption coefficient of six solid high-contrast and low-contrast phantoms located at different depths. The maximum was an average of all four wavelengths. The top depths of the phantoms are shown in the figure. For high-contrast phantoms, our DOT system is accurate (89.4%) in the depth range of 1 to 2 cm for 1-cm diameter phantom (89.4%, SHC), and 1 to 2.5 cm for 2 cm (97.2%) and 3-cm (87.6%) diameter phantoms (MHC, LHC). For low contrast phantoms, DOT system is accurate in the depth range of 0.5 to 2 cm for 1-cm diameter phantom (73%), (SLC), and 0.5 to 2.5 cm for 2 cm (69.5%) and 3 cm (72.1%) diameter phantoms (MLC, LLC). For high contrast phantoms located too close to the surface for less than 1 cm, the accuracy of reconstruction is lower (64.4%) due to lacking central sources in the combined probe. Because the US array occupies the center of the combined probe, there is no single center source to illuminate the lesion underneath. The source and detector pairs with their “banana” patterns probing the central region have minimum source–detector distance of 3 cm, which results in reduced sensitivity in shallower depth of less than 1 cm. Future research will be focused on methods of calibration of target depth and size effects on reconstructed target optical properties.
Fig. 4.
Reconstruction accuracy (%) for six different phantoms located at different depths (depth of the top phantom positions are marked in the figure).
To further evaluate the stability of the system over time, a series of experiments of multiple phantoms were measured at different days. One example of the stability result is presented in Fig. 5. It shows the maximum reconstructed absorption coefficients of the 1 cm diameter high-contrast target measured at four optical wavelengths over time. The target was located at 1.0 cm depth (target surface). The experiments have been repeated for 5 day and one measurement per day was performed. The average error for four wavelengths over 5 days was 5.4%, which is negligible considering the measurement errors of locating the targets precisely inside the Intralipid solution at the desired depths.
Fig. 5.
Maximum reconstructed absorption coefficient of the small high-contrast phantom located at 1.0 cm depth (phantom top position) and imaged on different dates. The reconstructed absorption coefficients at 730, 785, 808, and 830 nm are presented. The black dashed line represents the calibrated (true) absorption of the phantom.
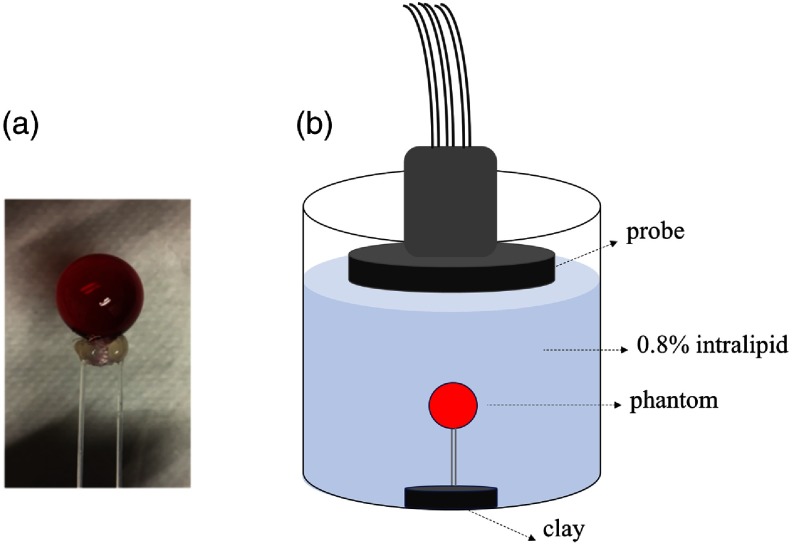
Next, to evaluate the sensitivity of the system to oxygenated and deoxygenated hemoglobin, a hollow glass bulb filled with oxygenated and deoxygenated hemoglobin was used as a blood phantom. Hemoglobin solution was purchased from Instrumentation Laboratory (multi-4, level 2, Instrumentation Laboratory, Massachusetts) as the oxy-Hb sample. The multi-4, level 2 product specification provided by Instrumentation Laboratory is total hemoglobin , with percentage of . The deoxygenated hemoglobin (Hb) solution is prepared by adding sodium dithionite () solution into the diluted oxygenated hemoglobin (). 0.05 g sodium dithionite is dissolved in 0.5 mL, phosphate-buffered saline solution (with mixed solution corresponding to 1 mg sodium dithionite) with pH of 7.4. We then add the sodium dithionite solution into 3.5 mL solution to prepare Hb solution. Solution preparation and mixing were carried out on top of dry ice to keep the temperature at around 0°C and slow down the speed of deoxygenated Hb reacting with . After sealing the glass ball, we incubated it at around 37°C for 6 min for the sodium dithionite to be effective. We calibrated the deoxygenating process with a standard UV-Vis spectrometer (Varian Cary®, Agilent). For each ball and Hb solution, we finished our DOT measurements in less than 10 min. Figure 6 presents the experimental setup for the hemoglobin phantom experiments.
Fig. 6.
(a) Glass ball (0.9 cm radius) filled with solution and connected to holding fibers. (b) Sketch of the experimental setup.
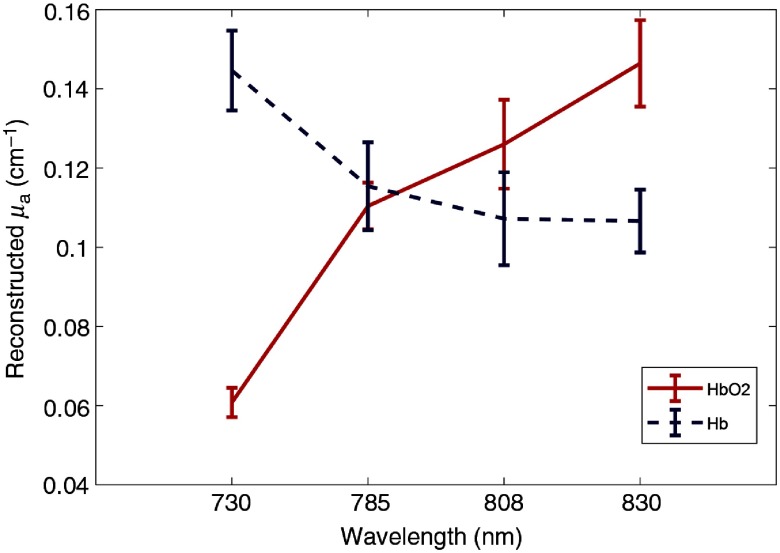
The images were reconstructed from measured data and the maximum reconstructed were compared with the calibrated values with the spectrometer. We used the maximum reconstructed to compute . We analyzed the DOT-measured of the hemoglobin target at different calibrated values ( to 10% and ) and Fig. 7 shows the calculated spectrum from our US-guided DOT system, which follows the literature data.30 The results of the DOT system with four wavelengths are comparable with the data obtained from the spectrometer.
Fig. 7.
Oxygenated and deoxygenated hemoglobin spectrum; reconstructed absorption coefficients using the DOT system, which follows the trend of the oxygenated and deoxygenated hemoglobin in Ref. 30.
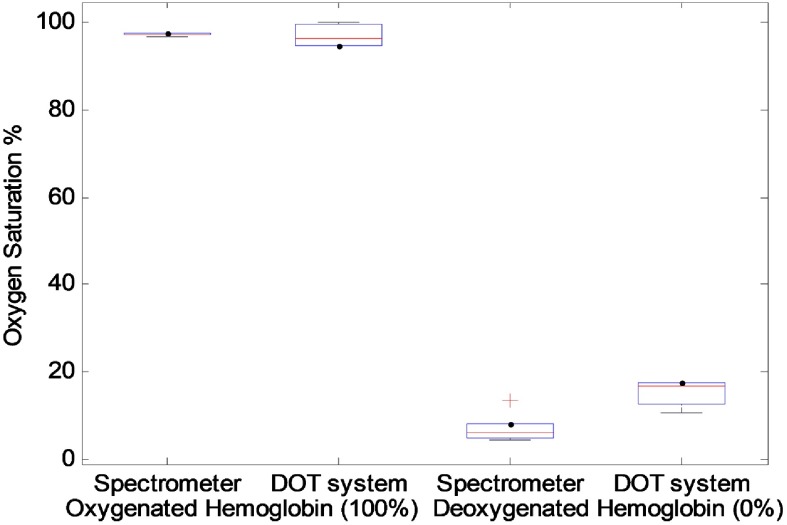
To evaluate the performance of the system sensitivity to oxygenated and deoxygenated hemoglobin over time, five samples of oxygenated hemoglobin and five samples of deoxygenated hemoglobin were prepared. Each day, one oxygenated sample and one deoxygenated sample was prepared and measured by both spectrometer and DOT system. Figure 8 shows the comparison of these five oxygenated and deoxygenated samples of calibrated value with the spectrometer and calculated value with the DOT system. It can be seen that the DOT measurements follow the spectrometer results closely.
Fig. 8.
Oxygenated and deoxygenated hemoglobin calibrated with the spectrometer and measured with the DOT system.
4. Clinical Results
The system is currently being used in patients undergoing neoadjuvant treatment at Washington University in St. Louis. The study protocol was approved by the institutional review board and was HIPPA compliant. Written informed consent was obtained from patients. The final pathologic response was evaluated by the Miller–Payne (MP) system.31 In the MP system, patient pathologic response is divided into five grades based on comparison of tumor cellularity between preneoadjuvant core biopsy and definitive surgical specimen. MP1 and 2 indicate no change or some minor loss of tumor cells (up to 30%) but with overall cellularity still high; this is a partial pathologic response (pPR). MP 3 indicates an estimated 30% to 90% reduction in tumor cells (pPR). MP 4 indicates a marked disappearance of tumor cells (), with only small clusters or widely dispersed individual cells remaining (almost pCR). MP 5 indicates no malignant cells are identifiable in sections from the tumor bed (pCR). Grade 5 may show necrosis, granulation tissue, histiocytes, and vascular fibroelastotic stroma remains, often containing macrophages. Residual ductal carcinoma in situ (DCIS) is considered as MP grade 5.
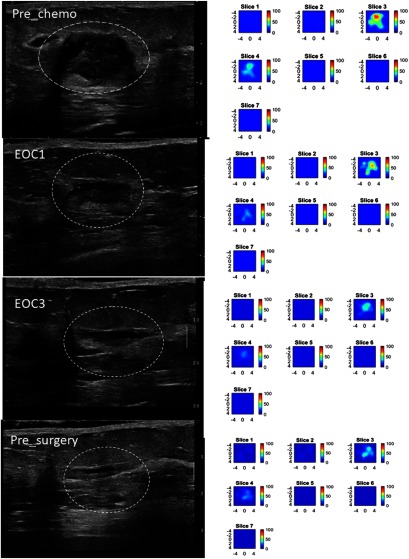
An example of conventional US and US-guided DOT generated total hemoglobin maps acquired throughout neoadjuvant treatment in a 51-year-old woman with a pCR is shown in Fig. 9. For each time point, coregistered US images and DOT data were acquired at the tumor site and the mirror position of the contralateral breast. The contralateral data were used as the reference to compute the normalized perturbation caused by tumor. The weight matrix computed from Born approximation was used to link the unknown tumor and background absorption distribution to the measured perturbation. A two-step image reconstruction using truncated Moore–Penrose pseudoinverse solution as the initial estimate of the optical properties of the tumor and Newton optimization for inversion was used for imaging reconstruction. Since DOT has much lower spatial resolution than that of US, we typically use two to three times larger size in spatial dimension than that identified by coregistered US for DOT reconstruction. Since DOT depth resolution is very poor, we typically use the lesion depth range identified by coregistered US to define DOT reconstruction depth. When US-guided DOT was used for assessing treatment response, the same region of interest was used for DOT reconstruction for all time points, therefore, DOT reconstruction was not affected by changes of tumor US sizes.16,24 Total hemoglobin concentration map (tHb) was computed from optical absorption distributions obtained from four wavelengths using extinction coefficients reported in the literature30 and the maximum tHb was used to quantitatively characterize the tumor at each time point.
Fig. 9.
pCR of a triple receptor negative breast cancer of a 51-year-old woman with a high-grade invasive ductal carcinoma treated with carboplatin and docetaxel every 3 weeks for six cycles. Left panel: US images obtained at pretreatment, at the end of cycle 1 (EOC1), 2(EOC2, not shown), 3 (EOC3), and before surgery. On US, the tumor manifest as an oval mass with well-defined margins, measuring 2.02 cm maximally before treatment, decreased mildly to 1.49 cm at the completion of cycle 1, but was unchanged in size from the end of cycle 2 to before surgery. Right panel: tHb maps obtained at the corresponding time points. Each map shows seven subimages marked as slices 1 to 7 and each subimage shows spatial and distribution () of tHb concentration reconstructed from 0.5 to 3.0 cm depth range from the skin surface. The spacing between the subimages in depth is 0.5 cm. The color bar is tHb in micromoles per liter. The tHb reduced from measured before treatment to 69.0, 55.3, and measured before completion of cycle 1, cycle 2, and cycle 3. A reduction of 17.2%, 33.6%, and 54.5% occurred at the end of cycle 1, 2, and 3, respectively. The hemoglobin level remains unchanged to the end of the treatment before surgery. This patient had a complete pathologic response with no residual tumor, MP grade 5.
The patient presented with a high grade (Nottingham histologic score 9/9) triple-receptor-negative (TN), (i.e., ER-, PR-, Her2Neu-) invasive ductal carcinoma and was treated with carboplatin and docetaxel every three weeks for six cycles. US and US-guided DOT was obtained prior to treatment, at the completion of cycles 1, 2 (not shown), 3, and before surgery. US showed a substantial decrease from baseline to the end of cycle 1, with more subtle size reduction during the remainder of neoadjuvant treatment. US-guided NIR DOT shows a progressive decline in tHb concentration during the first three cycles, which correlated with a complete pathologic response of MP grade of 5. Note that the tumor tHb content was not completely disappeared before surgery and this was often caused by treatment induced inflammatory changes, microphages, etc.
5. Summary and Discussion
A new compact US-guided DOT system for breast imaging has been reported in this paper. Several major improvements in hardware and software enable robust and user-friendly operations in clinics and near-real-time imaging reconstruction. The new user interface software incorporates our recently developed data selection and outlier removal preprocessing method and image reconstruction technique. To evaluate the performance of the system, multiple sets of solid and blood phantoms were tested. An example of a patient, who was treated by neoadjuvant chemotherapy, is given to demonstrate the performance of the system.
Same as DOT using reflection geometry, the reconstruction accuracy of US-guided DOT is depth-dependent as seen from Fig. 4, especially for high-contrast targets. For a smaller high contrast target of 1 cm in size, the target cannot be accurately quantified beyond 2 cm depth. Additionally, because of its lack of a center source, the high contrast targets shallower than 1 cm cannot be accurately quantified. Fortunately, most of the breast lesions can be imaged deeper than 1 cm by positioning the patient and the probe. In the past, we have developed depth compensated reconstruction algorithms,32,33 however, these algorithms are very sensitive to data signal-to-noise ratio, especially when lesions are deep. Currently, we are exploring depth regularized approaches to compensate target depth-dependent reconstruction.
In recent years, the conventional imaging guided DOT has been advanced in optical systems, image-guided reconstruction, and co-registered display. Regarding optical systems, the wavelengths have been dramatically increased from 2-3 wavelengths to 8-9 wavelengths.20,21 Additionally, the systems implemented more than 50 detectors by integrating hybrid lower cost CW and higher cost frequency domain detection channels.22 These technical advances will provide more spectroscopic information for breast lesion characterization and improve overall data volume; however, the system complexity will go up. Our efforts have been focused on compact system size and robust operation for clinical use. Our results reported here on laser source system integration and coherent noise reduction are generalizable to other hybrid imaging systems. We have also devoted significant efforts on fast and robust data preprocessing and imaging reconstruction. This is a bottleneck for a wide clinical use of the US-guided DOT system because US provides real-time imaging for detection and diagnosis by physicians. Any adjunct systems should provide additional diagnostic information immediately. Although we have not achieved real-time image reconstruction yet, we expect that with the advances of machine leaning and reconstruction methods, we will overcome this challenge in the near future. Our reported approach on a compact system, robust data preprocessing, and imaging reconstruction is the first significant step toward achieving this goal.
In conclusion, the presented US-guided DOT system has great potential for clinical application by providing quantitative lesion optical properties in near real-time imaging. Although the system is developed for US-guided DOT, similar data preprocessing and image reconstruction are applicable to other modality-guided DOT imaging.
Acknowledgments
The authors thank the funding support of this work from the National Institutes of Health (Grant No. R01EB002136), and Connecticut Bioscience Innovation Fund (CBIF) Award #513.
Biographies
Hamed Vavadi received his PhD in biomedical engineering from the University of Connecticut in 2017. He also earned his BS degree in electrical engineering and MSc degree in biomedical engineering. He has extensive experience in near-infrared spectroscopy and tomography for blood oxygen saturation monitoring and cancer diagnosis. He was awarded a Third Bridge Grant from the Connecticut Innovation. His research interests include optical imaging, NIR spectroscopy, cancer detection, wearable devices, and vital signal processing
Atahar Mostafa is a PhD candidate in the Biomedical Engineering Department at the Washington University in St. Louis. He received his BS degree in electrical and electronics engineering from the Bangladesh University of Engineering and Technology in Bangladesh and his MS degree in electrical engineering from the University of Saskatchewan in Canada. His research is focused on ultrasound-guided optical imaging techniques and applications
Feifei Zhou received her BS degree in biomedical engineering from Huazhong University of Science and Technology in China and her PhD in biomedical engineering of the University of Connecticut. She is currently working as a postdoc scholar in molecular biology and Microbiology Department of Case Western Reserve University. Her research is focused on using molecular probe and optical techniques to detect tumor cells.
K. M. Shihab Uddin is a PhD candidate in the Biomedical Engineering Department at Washington University in St. Louis. He received his bachelor’s degree in electrical and electronics engineering from the Bangladesh University of Engineering and Technology in Bangladesh. His research is focused on data preprocessing and nonlinear optimization based reconstruction for ultrasound-guided diffuse optical tomography.
Murad Althobaiti holds a PhD in biomedical engineering from the University of Connecticut. He received his BS and MS degrees in biomedical engineering from Wright State University in Dayton, Ohio, in 2011 and 2013, respectively. Currently, he is an assistant professor of the Biomedical Engineering Department at Imam Abdulrahman Bin Faisal University, Saudi Arabia. He is a member of SPIE.
Chen Xu received his PhD degree in biomedical engineering from the University of Connecticut. She received her MSc degree in biomedical engineering and applied physics from the University of Connecticut and Northwestern Polytechnic University of China. She is an assistant professor with the Department of Computer Engineering Technology at New York City College of Technology. Her research interests include biomedical sensors and instrumentations, image processing, signal processing, and noninvasive medical test.
Rajeev Bansal received his PhD in applied physics from Harvard University in 1981. Since then he has taught and conducted research in the area of applied electromagnetics at the University of Connecticut, where he is currently a professor in the Department of Electrical & Computer Engineering. He is a fellow of the Electromagnetics Academy and an elected member of the Connecticut Academy of Science and Engineering (CASE).
Foluso Ademuyiwa is an associate professor at Washington University. She earned a medical degree from the University of Ibadan, completed residency in internal medicine/pediatrics at Bridgeport Hospital–Yale New Haven Health, and fellowship in hematology/oncology at Indiana University. She is board-certified in internal medicine, pediatrics, and medical oncology. She provides patient-centered care as part of a multidisciplinary breast cancer team, is actively involved in clinical research, and serves as a principal investigator on multiple trials.
Steven Poplack is recognized internationally for his scientific contributions in the field of breast imaging technology development. He has acted as the clinical principal investigator in the creation of breast imaging applications of near infrared, microwave and electrical impedance spectroscopy. In 2007, he published the first clinical experience with Digital Breast Tomosynthesis. He is a fellow of the American College of Radiology and the Society of Breast Imaging.
Quing Zhu is a professor of the Department of Biomedical Engineering and Radiology at Washington University in St Louis. He is a pioneer of combining ultrasound and near infrared imaging modalities for diagnosis and treatment assessment of breast cancers. He has been named fellow of Optical Society of American and fellow of SPIE. Her research interests are cancer detection, diagnosis and treatment assessment using ultrasound-guided diffuse optical tomography, photoacoustic imaging, and optical coherent tomography.
Disclosures
The authors declare that there are no conflicts of interests related to this article. Q.Z. is the inventor of US-guided diffuse optical tomography and the University of Connecticut owns the patents.
References
- 1.American Cancer Society, “Cancer facts & figures 2018,” 2018, http://www. Cancer.org.
- 2.Breast Cancer Organization, “U. S. breast cancer statistics 2018,” 2017, http://www.breastcancer.org.
- 3.Wang M., et al. , “Neoadjuvant chemotherapy creates surgery opportunities for inoperable locally advanced breast cancer,” Sci. Rep. 7, 44673 (2017). 10.1038/srep44673 [DOI] [PMC free article] [PubMed] [Google Scholar]
- 4.Cortazar P., et al. , “Pathological complete response and long-term clinical benefit in breast cancer: the CTNeoBC pooled analysis,” Lancet 384(9938), 164–172 (2014). 10.1016/S0140-6736(13)62422-8 [DOI] [PubMed] [Google Scholar]
- 5.Yeh E., et al. , “Prospective comparison of mammography, sonography, and MRI in patients undergoing neoadjuvant chemotherapy for palpable breast cancer,” Am. J. Roentgenol. 184(3), 868–877 (2005). 10.2214/ajr.184.3.01840868 [DOI] [PubMed] [Google Scholar]
- 6.Warren R. M. L., et al. , “Can breast MRI help in the management of women with breast cancer treated by neoadjuvant chemotherapy?” Br. J. Cancer 90(7), 1349–1360 (2004). 10.1038/sj.bjc.6601710 [DOI] [PMC free article] [PubMed] [Google Scholar]
- 7.Humbert O., et al. , “18F-FDG PET-derived tumor blood flow changes after 1 cycle of neoadjuvant chemotherapy predicts outcome in triple-negative breast cancer,” J. Nucl. Med. 57(11), 1707–1712 (2016). 10.2967/jnumed.116.172759 [DOI] [PubMed] [Google Scholar]
- 8.Avril S., et al. , “18F-FDG PET/CT for monitoring of treatment response in breast cancer,” J. Nucl. Med. 57(Suppl. 1), 34S–39S (2016). 10.2967/jnumed.115.157875 [DOI] [PMC free article] [PubMed] [Google Scholar]
- 9.Choe R., et al. , “Optically measured microvascular blood flow contrast of malignant breast tumors,” PLoS One 9(6), e99683 (2014). 10.1371/journal.pone.0099683 [DOI] [PMC free article] [PubMed] [Google Scholar]
- 10.Larusson F., et al. , “Parametric estimation of 3D tubular structures for diffuse optical tomography,” Biomed. Opt. Express 4(2), 271–286 (2013). 10.1364/BOE.4.000271 [DOI] [PMC free article] [PubMed] [Google Scholar]
- 11.Pakalniskis M. P., et al. , “Tumor angiogenesis change estimated by diffuse optical spectroscopic tomography; demonstrated correlation in women undergoing neo-adjuvant chemotherapy for invasive breast cancer?” Radiology 259(2), 365–374 (2011). 10.1148/radiol.11100699 [DOI] [PMC free article] [PubMed] [Google Scholar]
- 12.Fang Q., et al. , “Combined optical and X-ray tomosynthesis breast imaging,” Radiology 258(1), 89–97 (2011). 10.1148/radiol.10082176 [DOI] [PMC free article] [PubMed] [Google Scholar]
- 13.Li A., et al. , “Tomographic optical breast imaging guided by three-dimensional mammography,” Appl. Opt. 42(25), 5181–5190 (2003). 10.1364/AO.42.005181 [DOI] [PubMed] [Google Scholar]
- 14.Zhu Q., et al. , “Assessment of functional differences in malignant and benign breast lesions and improvement of diagnostic accuracy by using US-guided diffuse optical tomography in conjunction with conventional US,” Radiology 280(2), 387–397 (2016). 10.1148/radiol.2016151097 [DOI] [PMC free article] [PubMed] [Google Scholar]
- 15.Zhu Q., et al. , “Early-stage invasive breast cancers: potential role of optical tomography with US localization in assisting diagnosis,” Radiology 256(2), 367–378 (2010). 10.1148/radiol.10091237 [DOI] [PMC free article] [PubMed] [Google Scholar]
- 16.Zhu Q., “Breast cancer: assessing response to neoadjuvant chemotherapy by using US-guided near-infrared tomography,” Radiology 266(2), 433–442 (2013). 10.1148/radiol.12112415 [DOI] [PMC free article] [PubMed] [Google Scholar]
- 17.Carpenter C. M., et al. , “Image-guided optical spectroscopy provides molecular-specific information in vivo: MRI-guided spectroscopy of breast cancer hemoglobin, water, and scatterer size,” Opt. Lett. 32(8), 933–935 (2007). 10.1364/OL.32.000933 [DOI] [PubMed] [Google Scholar]
- 18.Ntziachristos V., et al. , “MRI-guided diffuse optical spectroscopy of malignant and benign breast lesions,” Neoplasia 4(4), 347–354 (2002). 10.1038/sj.neo.7900244 [DOI] [PMC free article] [PubMed] [Google Scholar]
- 19.Choe R., et al. , “Diffuse optical tomography of breast cancer during neoadjuvant chemotherapy: a case study with comparison to MRI,” Med. Phys. 32(4), 1128–1139 (2005). 10.1118/1.1869612 [DOI] [PubMed] [Google Scholar]
- 20.El-Ghussein F., et al. , “Hybrid photomultiplier tube and photodiode parallel detection array for wideband optical spectroscopy of the breast guided by magnetic resonance imaging,” J. Biomed. Opt. 19(1), 011010 (2014). 10.1117/1.JBO.19.1.011010 [DOI] [PMC free article] [PubMed] [Google Scholar]
- 21.Krishnaswamy V., et al. , “A digital x-ray tomosynthesis coupled near infrared spectral tomography system for dual-modality breast imaging,” Opt. Express 20(17), 19125–19136 (2012). 10.1364/OE.20.019125 [DOI] [PMC free article] [PubMed] [Google Scholar]
- 22.Zimmermann B. B., et al. , “Multimodal breast cancer imaging using coregistered dynamic diffuse optical tomography and digital breast tomosynthesis,” J. Biomed. Opt. 22(4), 046008 (2017). 10.1117/1.JBO.22.4.046008 [DOI] [PMC free article] [PubMed] [Google Scholar]
- 23.Xu C., et al. , “Ultrasound-guided diffuse optical tomography for predicting and monitoring neoadjuvant chemotherapy of breast cancers: recent progress,” Ultrason. Imaging 38(1), 5–18 (2016). 10.1177/0161734615580280 [DOI] [PMC free article] [PubMed] [Google Scholar]
- 24.Zhu Q., et al. , “Identifying an early treatment window for predicting breast cancer response to neoadjuvant chemotherapy using immunohistopathology and hemoglobin parameters,” Breast Cancer Res. 20(1), 56 (2018). 10.1186/s13058-018-0975-1 [DOI] [PMC free article] [PubMed] [Google Scholar]
- 25.Vavadi H., et al. , “Preliminary results of miniaturized and robust ultrasound guided diffuse optical tomography system for breast cancer detection,” Proc. SPIE 10059, 100590F (2017). 10.1117/12.2250034 [DOI] [Google Scholar]
- 26.Chen N. G., et al. , “Simultaneous near-infrared diffuse light and ultrasound imaging,” Appl. Opt. 40(34), 6367–6380 (2001). 10.1364/AO.40.006367 [DOI] [PMC free article] [PubMed] [Google Scholar]
- 27.Vavadi H., et al. , “Automated data selection method to improve robustness of diffuse optical tomography for breast cancer imaging,” Biomed. Opt. Express 7(10), 4007–4020 (2016). 10.1364/BOE.7.004007 [DOI] [PMC free article] [PubMed] [Google Scholar]
- 28.Mostafa A., et al. , “Diffuse optical tomography using semiautomated co-registered ultrasound measurements,” J. Biomed. Opt. 22(12), 121610 (2017). 10.1117/1.JBO.22.12.121610 [DOI] [PMC free article] [PubMed] [Google Scholar]
- 29.Uddin K. M., et al. , “Two step imaging reconstruction using truncated pseudoinverse as a preliminary estimate in ultrasound guided diffuse optical tomography,” Biomed. Opt. Express 8(12), 5437–5449 (2017). 10.1364/BOE.8.005437 [DOI] [PMC free article] [PubMed] [Google Scholar]
- 30.Prahl S., “Optical absorption of hemoglobin,” 1999, http://omlc.ogi.edu/spectra/hemoglobin.
- 31.Ogston K. N., et al. , “A new histologic grading system to assess response of breast cancers to primary chemotherapy; prognostic significance and survival,” Breast 12(5), 320–327 (2003). 10.1016/S0960-9776(03)00106-1 [DOI] [PubMed] [Google Scholar]
- 32.Tavakoli B., Zhu Q., “Depth-correction algorithm that improves optical quantification of large breast lesions imaged by diffuse optical tomography,” J. Biomed. Opt. 16(5), 056002 (2011). 10.1117/1.3573814 [DOI] [PMC free article] [PubMed] [Google Scholar]
- 33.Huang M., Zhu Q., “Dual-mesh optical tomography reconstruction method with a depth correction that uses a priori ultrasound information,” Appl. Opt. 43(8), 1654–1662 (2004). 10.1364/AO.43.001654 [DOI] [PMC free article] [PubMed] [Google Scholar]


