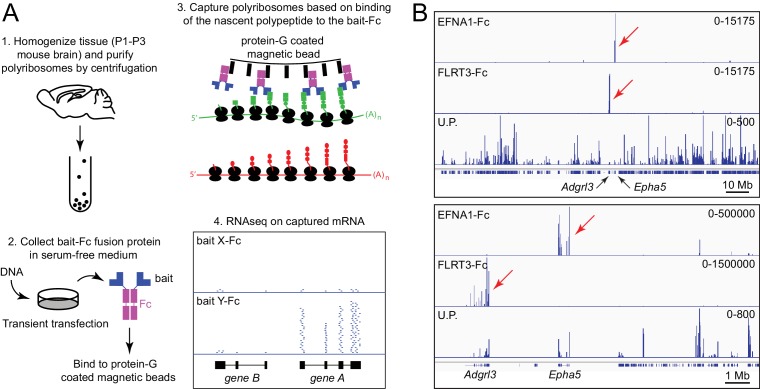
Figure 1. Principle of ACAPseq.
(A) Workflow for the ACAPseq protocol. In step 3, the polyribosome synthesizing the green polypeptide is captured by magnetic beads displaying the bait-Fc fusion protein, and the polyribosome synthesizing the red polypeptide is not captured. In step 4, the genome browser image shows, at the bottom, introns (thin back lines) and exons (filled black rectangles) for genes A and B. The Y-Fc bait has captured polyribosomes synthesizing protein A, resulting in a large number of RNAseq reads (short horizontal blue lines) that align to the exons of gene A. (B) Histogram of mapped ACAPseq reads using EFNA1-Fc and FLRT3-Fc baits to capture neonatal mouse brain polyribosomes. The bottom track shows the unselected polyribosome sample. The upper panel spans the entirety of mouse chromosome 5 (151 Mb), and the lower panel spans a 10 Mb region encompassing the Adgrl3 and Epha5 genes. Red arrows highlight reads mapping to Adgrl3 and Epha5. In this and all other genome browser images, the number range at the right side of each panel indicates the number of reads corresponding to the vertical height of the panel. U.P., unselected polyribosomes.

