. 2018 Oct 22;7:e40982. doi: 10.7554/eLife.40982

Figure 3. ACAPseq with LPHN1-Fc, LPHN3-Fc, and LRTM2-Fc baits.

(A–D) Flrt1, Flrt2, and Flrt3 mRNAs captured with LPHN1 and LPHN3 baits (red arrows). (B) and (C) are centered on the Flrt2 gene but have different horizontal and vertical scales. (E–H) Tnr, Tnn, and Tnc mRNAs captured with the LRTM2 bait (red arrows). (F) and (G) show the Tnn gene with different horizontal and vertical scales. In (H), the pile up of many reads at a single location in the LRTM2, EFNA1, and total polyribosome tracks is presumed to be a sequencing and/or alignment artifact. Genome browser images from ACAPseq of neonatal mouse brain polyribosomes, as shown in Figure 1B.

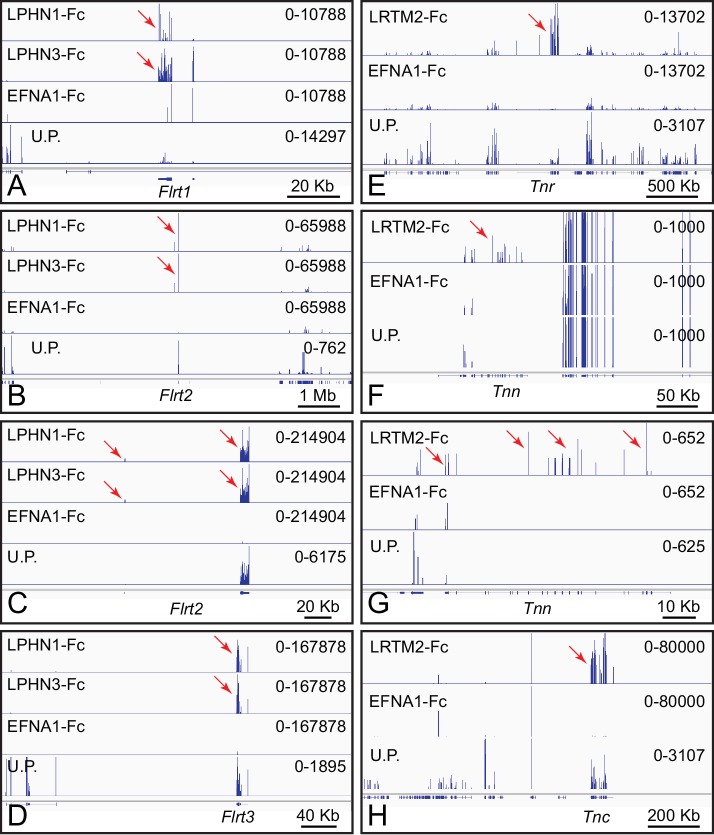
Figure 3.

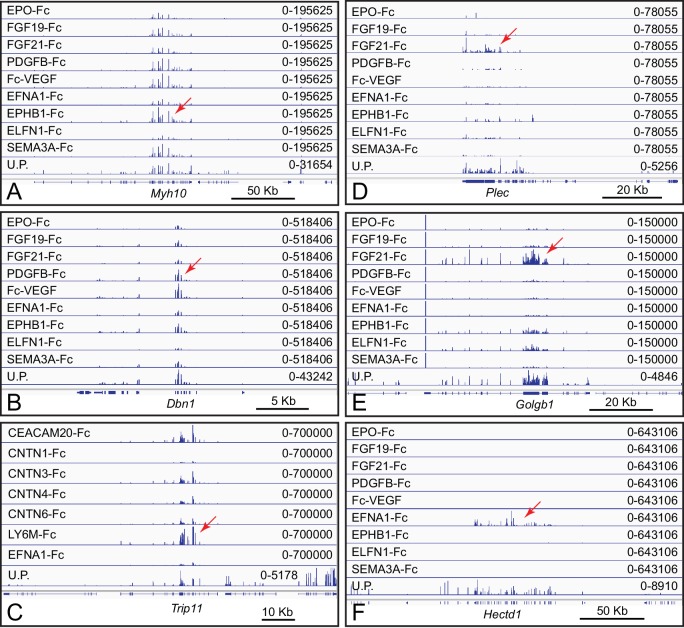
Figure 3—figure supplement 1. Presumptive artifactual and non-specific bait-target interactions in ACAPseq.

Figure 3—figure supplement 1.

(A–E) Multiple and diverse baits capture Plec, Golgb1, Myh10, Dbn1, and Trip11 mRNAs, suggesting non-specific interactions. For this set of baits, FGF21-Fc gave the highest capture efficiencies for Plec and Golgb1 mRNAs. (F) Relatively selective capture of Hectd1 polyribosomes by EFNA1-Fc. HECTD1 is a cytoplasmic E3 ubiquitin ligase, and, therefore, this interaction is unlikely to be of biological significance. Genome browser images from ACAPseq of neonatal mouse brain polyribosomes are displayed as in Figure 1B. Red arrows indicate the reads from captured polyribosomes.