

Abstract
Lung cancer (LC) is a leading cause of cancer‐related death in the Western world. Patients with LC usually have poor prognosis due to the difficulties in detecting tumors at early stages. Multiple studies have shown that circulating miRNAs might be promising biomarkers for early detection of LC. We aimed to provide an overview of published studies on circulating miRNA markers for early detection of LC and to summarize their diagnostic performance in Western populations. A systematic literature search was performed in PubMed and ISI Web of Knowledge to find relevant studies published up to 11 August 2017. Information on study design, population characteristics, miRNA markers, and diagnostic accuracy (including sensitivity, specificity, and AUC) were independently extracted by two reviewers. Overall, 17 studies evaluating 35 circulating miRNA markers and 19 miRNA panels in serum or plasma were included. The median sensitivity (range) and specificity (range) were, respectively, 78.4% (51.7%‐100%) and 78.7% (42.9%‐93.5%) for individual miRNAs, and 83.0% (64.0%‐100%) and 84.9% (71.0%‐100%) for miRNA panels. Most studies incorporated individual miRNA markers as panels (with 2‐34 markers), with multiple miRNA‐based panels generally outperforming individual markers. Two promising miRNA panels were discovered and verified in prospective cohorts. Of note, both studies exclusively applied miRNA ratios when building up panels. In conclusion, circulating miRNAs may bear potential for noninvasive LC screening, but large studies conducted in screening or longitudinal settings are needed to validate the promising results and optimize the marker panels.
Keywords: early detection, lung cancer, miRNA, Western populations
1. INTRODUCTION
Lung cancer (LC) is one of the most common forms of cancer and causes of cancer‐related death worldwide. LC was estimated to account for 449 000 cases and 388 000 deaths in Europe, and 214 000 cases and 168 000 deaths in the US in 2012.1 The overall 5‐year survival rate of LC is less than 20% as the majority of tumors are diagnosed at late stages, whereas patients with tumors diagnosed at Stage IA have 5‐year survival rates of approximately 70%.2 Early detection of malignant tumors could therefore significantly reduce LC mortality. Of the potential screening methods, it has been shown that sputum examinations and chest X‐rays are ineffective in reducing LC mortality.3 Low‐dose computed tomography (CT) screening appears to be promising for high‐risk smokers,4 but high false‐positive rates, and cost‐effectiveness are still major problems.3, 5
The possibility of effective noninvasive cancer screening based on molecular markers detected in body fluids, such as microRNAs (miRNAs) in blood, has recently become a major research area.6 miRNAs are short (approximately 22 nucleotides in length) non‐coding RNAs that regulate gene expression by affecting the stability and translational rate of their target messenger RNA (mRNA).7 Studies showed that circulating miRNAs become dysregulated during tumor development and therefore result in abnormal miRNA profiles in cancer patients.7, 8 Clinical studies evaluating the diagnostic efficacy of miRNAs in serum/plasma have shed light on the potential of miRNA biomarkers for noninvasive cancer screening, and a number of LC‐related miRNA candidates/panels have already been identified.9, 10, 11
In this review, we provide a systematic and comprehensive summary of the published articles which investigated circulating miRNA candidates for LC detection. We report study characteristics as well as indicators of diagnostic performance of the miRNAs and miRNA panels to provide an overview of where the field stands right now and bring up research questions for future studies. Given the heterogeneity in reported miRNA profiles between ethnicities,12 this review focused on studies from Western populations.
2. METHODS
The systematic review was conducted according to a predefined protocol. Reporting follows the PRISMA statement.13
2.1. Literature search
A systematic literature search was performed to identify studies that assessed circulating miRNAs in relation to LC. The PubMed and ISI Web of Science databases were searched for relevant articles that conformed to our inclusion and exclusion criteria and were published up to 11 August 2017. The search was done using the following keyword combinations: ([lung OR pulmonary] AND [cancer OR carcinoma OR neoplasm OR tumor OR adenocarcinoma OR squamous carcinoma OR malignancy] AND [microRNA* OR miRNA* OR miR* OR let‐7*] AND [detection OR diagnosis OR biomarker OR marker] AND [blood OR serum OR plasma]). Duplicate publications were removed.
2.2. Eligibility criteria
The initial screening for potential eligible studies was done based upon reading of the title and abstract, and the following exclusion criteria were used (Figure 1): (a) non‐English articles, (b) non‐original articles, (c) not lung cancer studies, (d) non‐human studies, (e) not based on serum or plasma samples, (f) not relevant to the topic, and (g) no full‐text articles. The second round of screening involved reading full‐text articles. At this point, the following studies were excluded: (a) studies using disease controls, (b) studies not reporting critical data regarding diagnostic performance (such as number of cases and controls, sensitivity, specificity, or area under the curve (AUC)), and (c) non‐Western population studies.
Figure 1.
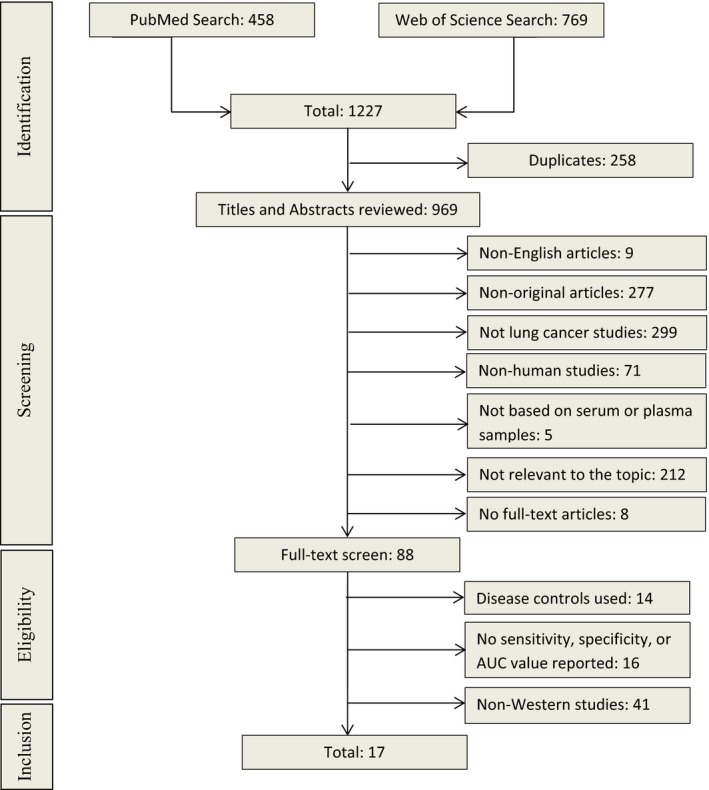
Overview of the literature search process (up to 11th of August 2017)
2.3. Data extraction and statistical analysis
Two reviewers (HY and ZG) independently read and extracted data from the studies that met the inclusion and exclusion criteria described above. Any disagreements were discussed and resolved among the authors. From each study, we extracted available data on first author, publication year, country, study design, basic population characteristics (including size, age, male proportion, histological subtype, and tumor stage for cases), type of bio‐specimen (serum or plasma), miRNA measurement method, targeted miRNA markers, and diagnostic performance indicators (including sensitivity, specificity, AUC, P‐value). Individual miRNAs with P‐value >0.05 were dropped. Mean or median age and male proportion of included studies were calculated by statistical software R (version 3.3.3) if statistics were not reported but raw data were available. Different miRNA names were incorporated through miRBase database (http://www.mirbase.org/).
2.4. Quality assessment
The quality of each included article was assessed according to quality assessment of diagnostic accuracy studies (QUADAS‐2), the most recommended tool for diagnostic accuracy evaluation, and was completed using software Review Manager (version 5.3). Four domains are evaluated for risk of bias in QUADAS‐2: (a) patient selection, (b) index test, (c) reference standard, and (d) flow and timing. The first three domains are also evaluated for applicability concerns.
3. RESULTS
3.1. Literature search result
A flowchart of the literature search process is given in Figure 1. The initial search yielded 1227 articles using the search terms described above, 458 from PubMed and 769 from Web of Science (Figure 1). Among these, 258 duplicates were removed first. Then, 969 articles went through title and abstract review and a total of 881 articles were excluded according to the above‐mentioned exclusion criteria. The remaining 88 articles were selected for full‐text reading, of which 71 articles were removed: 14 using disease controls, 16 without reporting sensitivity, specificity or AUC values, and 41 reporting in non‐Western countries. In the end, 17 studies evaluating the diagnostic performance of circulating miRNAs in serum or plasma for LC detection published between 2011 and 2017 (Tables 1 and 2) were eligible for this systematic review.9, 10, 11, 14, 15, 16, 17, 18, 19, 20, 21, 22, 23, 24, 25, 26, 27
Table 1.
Diagnostic performance of individual miRNA markers in lung cancer in Western populations
| Study | Country | Cases vs controls | Specimen | Histology | Stage | miRNA | SEN | SPE | AUC | P‐value | ||
|---|---|---|---|---|---|---|---|---|---|---|---|---|
| Number | Age (y) | Male (%) | ||||||||||
| Zaporozhchenko, 201627 | Russia | 75/50 | 65/51 | 89/84 | Plasma | Any LC | IIA‐IV | miR‐19b | 69 | 93 | 0.81 | <0.001 |
| miR‐21 | 90 | 45 | 0.63 | 0.022 | ||||||||
| miR‐25 | 56 | 84 | 0.66 | 0.010 | ||||||||
| miR‐183 | 79 | 71 | 0.82 | <0.001 | ||||||||
| 53/50 | NA/51 | NA/84 | SCC | IIA‐IV | miR‐19b | 75 | 91 | 0.83 | <0.001 | |||
| miR‐25 | 68 | 84 | 0.81 | <0.001 | ||||||||
| miR‐183 | 100 | 43 | 0.76 | 0.004 | ||||||||
| miR‐205 | 78 | 72 | 0.68 | 0.048 | ||||||||
| 18/50 | NA/51 | NA/84 | ADC | IIA‐IV | miR‐19b | 58 | 93 | 0.77 | <0.001 | |||
| miR‐21 | 88 | 45 | 0.65 | 0.041 | ||||||||
| miR‐183 | 100 | 81 | 0.92 | <0.001 | ||||||||
| Powrozek, 201618 | Poland | 90/85 | 64/57 | 69/60 | Plasma | Any LC | I‐IV | miR‐448 | 91 | 75 | 0.89 | <0.0001 |
| miR‐4478 | 71 | 74 | 0.80 | <0.0001 | ||||||||
| 40/85 | NA/57 | NA/60 | NSCLC | IA‐IIB | miR‐448 | 85 | 77 | 0.89 | <0.0001 | |||
| miR‐4478 | 75 | 68 | 0.82 | <0.0001 | ||||||||
| Halvorsen, 201615 | Norway | 100/58 | 63/58 | 72/59 | Serum | NSCLC | I‐IV | miR‐34b | / | / | 0.62 | 0.002a |
| miR‐125b | / | / | 0.77 | <0.001a | ||||||||
| miR‐200b | / | / | 0.83 | <0.001a | ||||||||
| miR‐203 | / | / | 0.66 | <0.001a | ||||||||
| miR‐205 | / | / | 0.80 | <0.001a | ||||||||
| miR‐429 | / | / | 0.79 | <0.001a | ||||||||
| Chen, 201614 | USA | 55/53 | 67/60 | 56/45 | Plasma | NSCLC | I‐II | miR‐21 | / | / | 0.70 | <0.001a |
| miR‐152 | / | / | 0.70 | <0.001a | ||||||||
| Wang, 201525 , a | USA | 108/48 | 67/59 | 48/42 | Serum | NSCLC | I‐IV | miR‐7 | / | / | 0.96 | <0.0001 |
| miR‐25 | / | / | 0.70 | <0.0001 | ||||||||
| miR‐193a‐3p | / | / | 0.86 | <0.0001 | ||||||||
| miR‐214 | / | / | 0.87 | <0.0001 | ||||||||
| miR‐483‐5p | / | / | 0.93 | <0.0001 | ||||||||
| Powrozek, 201519 | Poland | 90/85 | 65/57 | 62/60 | Plasma | Any LC | I‐IV | miR‐944 | 82 | 91 | 0.91 | <0.0001 |
| miR‐3662 | 72 | 94 | 0.90 | <0.0001 | ||||||||
| Powrozek, 201519 | Poland | NA/85 | NA/57 | NA/60 | SCC | I‐IIIA | miR‐944 | 86 | 90 | 0.93 | <0.0001 | |
| miR‐3662 | 100 | 56 | / | / | ||||||||
| NA/85 | NA/57 | NA/60 | ADC | I‐IIIA | miR‐944 | 70 | 80 | / | / | |||
| miR‐3662 | 82 | 94 | 0.93 | <0.0001 | ||||||||
| Rani, 201320 | Ireland | 40/40 | 66/64 | 55/55 | Serum | ADC | I‐IV | miR‐30c‐1* | / | / | 0.74 | 0.0002 |
| miR‐146b‐3p | / | / | 0.71 | 0.001 | ||||||||
| miR‐550 | / | / | 0.72 | 0.0006 | ||||||||
| miR‐566 | / | / | 0.79 | 0.0001 | ||||||||
| miR‐616* | / | / | 0.81 | 0.0001 | ||||||||
| miR‐939 | / | / | 0.82 | 0.0001 | ||||||||
| Ma, 201317 , c | USA | 36/38 | 67/65 | 61/66 | Plasma | NSCLC | I | miR‐21‐5p | / | / | 0.79 | 0.0013a |
| miR‐335‐3p | / | / | 0.71 | 0.009a | ||||||||
| Heegaard, 201216 | USA | 99/220 | NA/68 | NA/49 | Serum | ADC | IA‐IIB | miR‐146b | / | / | 0.55 | 0.04a |
| Shen, 201123 | USA | 58/29 | 68/66 | 66/66 | Plasma | NSCLC | I‐IV | miR‐21 | 79 | 66 | 0.82 | 0.0002a |
| miR‐126 | 69 | 83 | 0.76 | 0.0005a | ||||||||
| miR‐182 | 52 | 76 | 0.66 | 0.0001a | ||||||||
| miR‐210 | 74 | 69 | 0.75 | 0.0003a | ||||||||
| miR‐486‐5p | 84 | 69 | 0.88 | 0.0006a | ||||||||
| Roth, 201121 | Germany | 35/28 | 55/42 | 66/NA | Serum | Any LC | I‐IV | miR‐10b | / | / | 0.90 | 0.0001a |
| miR‐34a | / | / | 0.80 | 0.0001a | ||||||||
| miR‐141 | / | / | 0.88 | 0.0001a | ||||||||
| miR‐155 | / | / | 0.86 | 0.0001a | ||||||||
ADC, adenocarcinoma; AUC, area under the curve; LC, lung cancer; NA, not available; NSCLC, non‐small‐cell lung cancer; SEN, sensitivity; SPE, specificity; SCC, squamous cell carcinoma.
AUCs in bold fonts represent results from validation set (non‐bold fonts represent results without validation).
P‐value represents the difference of miRNA levels between cases and controls (all other P‐values represent the statistical significance of AUC values).
Chinese validation set not included.
miRNAs detected with digital PCR (all other studies detected with qRT‐PCR).
Table 2.
Diagnostic performance of miRNA panels in lung cancer in Western populations
| Study | Country | Cases vs controls | Specimen | Histology | Stage | miRNA | SEN | SPE | AUC | ||
|---|---|---|---|---|---|---|---|---|---|---|---|
| Number | Age (y) | Male (%) | |||||||||
| Zaporozhchenko, 201627 | Russia | 75/50 | 65/51 | 89/84 | Plasma | Any LC | IIA‐IV | ‐19b, ‐183 | 95 | 95 | 0.99 |
| Powrozek, 201618 | Poland | 90/85 | 64/57 | 69/60 | Plasma | Any LC | I‐IV | ‐448, ‐4478 | 89 | 79 | 0.90 |
| 40/85 | NA/57 | NA/60 | NSCLC | IA‐IIB | ‐448, ‐4478 | 90 | 76 | 0.90 | |||
| Halvorsen, 201615 | Norway | 100/58 | 63/58 | 72/59 | Serum | NSCLC | I‐IV | Panel A | 88 | 71 | 0.89 |
| Wozniak, 201526 | Russia | 100/100 | 63/60 | 86/71 | Plasma | NSCLC | IA‐IIIA | Panel B | 83 | 80 | 0.92 |
| 35/100 | NA/60 | NA/71 | ADC | IA‐IIIA | / | / | 0.94 | ||||
| 65/100 | NA/60 | NA/71 | SCC | IA‐IIIA | / | / | 0.96 | ||||
| Wang, 201525 , a | USA | 108/48 | 67/59 | 48/42 | Serum | NSCLC | I‐IV | Panel C | 95 | 84 | 0.95 |
| Powrozek, 201519 | Poland | 90/85 | 65/57 | 62/60 | Plasma | Any LC | I‐IV | ‐944, ‐3662 | 82 | 92 | 0.91 |
| 40/85 | NA/57 | NA/60 | NSCLC | I‐IIIA | ‐944, ‐3662 | 92 | 86 | 0.88 | |||
| Sozzi, 201425 , b | Italy | 69/870 | 61/56 | 81/63 | Plasma | Any LC | I‐IV | Panel D | 87 | 81 | / |
| Sanfiorenzo, 201322 | France | 52/20 | 65/68 | 75/70 | Plasma | NSCLC | IA‐IIIA | Panel E | 81 | 83 | 0.88 |
| 27/20 | NA/68 | NA/70 | ADC | IA‐IIIA | 78 | 82 | 0.86 | ||||
| 25/20 | NA/68 | NA/70 | SCC | IA‐IIIA | 78 | 90 | 0.91 | ||||
| Ma, 201317 , c | USA | 36/38 | 67/65 | 61/66 | Plasma | NSCLC | I | ‐21‐5p, ‐335‐3p | 72 | 81 | 0.86 |
| Hennessey, 201211 | USA | 55/75 | 68/66 | 56/67 | Serum | NSCLC | I‐IV | ‐15b, ‐27b | 100 | 84 | 0.98 |
| ‐15a, ‐27b | 94 | 75 | / | ||||||||
| ‐142‐3p, ‐27b | 87 | 76 | / | ||||||||
| ‐15b, ‐301 | 75 | 93 | / | ||||||||
| ‐27b, ‐301 | 75 | 76 | / | ||||||||
| Heegaard, 201216 | USA | 220/220 | 68/68 | 48/49 | Serum | NSCLC | IA‐IIB | Panel F | / | / | 0.60 |
| 58/220 | NA/68 | NA/49 | SCC | IA‐IIB | ‐221, let‐7a | / | / | 0.57 | |||
| Shen, 2011 23 | USA | 58/29 | 69/66 | 66/66 | Plasma | NSCLC | I‐IV | Panel G | 86 | 97 | 0.93 |
| 24/29 | 67/66 | 63/66 | SCC | I‐IV | 82 | 97 | / | ||||
| 34/29 | 68/66 | 68/66 | ADC | I‐IV | 92 | 97 | / | ||||
| Boeri, 2011 10 , a | Italy | 15/54 | / | / | Plasma | Any LC | IA‐IV | Panel H | 80 | 90 | 0.85 |
| 16/54 | / | / | Panel I | 75 | 100 | 0.88 | |||||
| Bianchi, 2011 9 | Italy | 34/30 | 62/59 | 68/67 | Serum | NSCLC | I‐IV | Panel J | 71 | 90 | 0.89 |
| 12/30 | 64/59 | 67/67 | SCC | I‐IV | 83 | 90 | 0.94 | ||||
| 22/30 | 60/59 | 68/67 | ADC | I‐IV | 64 | 90 | 0.85 | ||||
ADC, adenocarcinoma; AUC, area under the curve; LC, lung cancer; NA, not available; NSCLC, non‐small‐cell lung cancer; SEN, sensitivity; SCC, squamous cell carcinoma; SPE, specificity.
SENs, SPEs, and AUCs in bold fonts represent results from validation set (non‐bold fonts represent results without validation).
Panel A: ‐429, ‐205, ‐200b, ‐203, ‐125b, ‐34b; Panel B (24 miRs): let‐7c, ‐122, ‐182, ‐193a‐5p, ‐200c, ‐203, ‐218, ‐155, let‐7b, ‐411, ‐450b‐5p, ‐485‐3p, ‐519a, ‐642, ‐517b, ‐520f, ‐206, ‐566, ‐661, ‐340*, ‐1243, ‐720. ‐543, ‐1267; Panel C: ‐214, ‐483‐5p, ‐193a‐3p, ‐25, ‐7; Panel D (24 miRs): ‐101, ‐106a, ‐126, ‐133a, ‐140‐3p, ‐140‐5p, ‐142‐3p, ‐145, ‐148a, ‐15b, ‐16, ‐17, ‐197, ‐19b, ‐21, ‐221, ‐28‐3p, ‐30b, ‐30c, ‐320. ‐451, ‐486‐5p, ‐660. ‐92a; Panel E (11 miRs): ‐155‐5p, ‐20a‐5p, ‐25‐3p, ‐296‐5p, ‐126‐3p, ‐223‐3p, ‐199a‐5p, ‐24‐3p, ‐152‐3p, ‐145‐5p, let‐7f‐5p; Panel F: ‐146b, ‐221, let‐7a, ‐155, ‐17‐5p, ‐29c, ‐27a, ‐106a; Panel G: ‐21, ‐486‐5p, ‐126, ‐210; Panel H (15miRs): ‐92a, ‐30c, ‐30b, ‐28‐3p, ‐19b, ‐15b, ‐142‐3p, ‐140‐5p, ‐106a, ‐660. ‐451, ‐320. ‐221, ‐197, ‐17; Panel I (13 miRs): ‐17, ‐21, ‐451, ‐660. ‐106a, ‐140‐3p, ‐140‐5p, ‐15b, ‐19b, ‐28‐3p, ‐30c, ‐486‐5p, ‐92a; Panel J (34 miRs): ‐92a, ‐486‐5p, ‐484, ‐191, ‐26a, let‐7b, ‐328, ‐30c, ‐342‐3p, ‐30b, ‐26b, ‐142‐3p, ‐331‐3p, ‐103, ‐17, ‐let‐7a, ‐126, ‐22, ‐374a, ‐148b, let‐7d, ‐28‐5p, ‐139‐5p, ‐376a, ‐98, ‐223, ‐142‐5p, ‐140‐5p, ‐29a, ‐148a, ‐133b, ‐32, ‐566, ‐432* (34 miRs).
Chinese validation set not included.
Prospective case‐control study (all others are cross‐sectional case‐control study).
miRNAs detected with digital PCR (all other studies detected with qRT‐PCR).
3.2. Study quality and characteristics
Study quality assessment was completed by two reviewers (HY and ZG) independently. Any initial inconsistencies were resolved by further discussion between the investigators. The vast majority of included studies were of good quality and no high risk of bias or high applicability concerns were found, but there were unclear risk of bias and unclear applicability concerns in patient selection and index test in some studies. The QUADAS‐2 results of the 17 studies are shown in Figures S1 and S2.
Two of the 17 studies are nested case‐control studies,10, 24 in which incident cases were identified during following up of a prospective cohort, controls were matched disease‐free individuals from the same cohort and blood samples collected at baseline (ie, prior to incidence and diagnosis) were analyzed. The other 15 studies are case‐control studies in which blood samples were taken after cancer diagnosis.9, 11, 14, 15, 16, 17, 18, 19, 20, 21, 22, 23, 25, 26, 27 Of the 17 studies, 11 evaluated individual miRNAs (Table 1), two of which conducted independent validation.15, 25 Fourteen studies assessed diagnostic performance of miRNA panels (Table 2), six of which carried out independent validation.9, 10, 11, 15, 24, 25 Detailed information on each study, including the number of cases and controls, mean or median age, proportion of males, specimen type, histological subtype, tumor stage, and diagnostic indicators, is summarized in Tables 1 and 2. In addition, Table 1 also shows the P‐value for testing the difference of each individual miRNA between cases and controls or the statistical significance of AUC values (indicated in the footnotes of Table 1).
The median (range) of the numbers of cancer cases and controls was 58 (31‐220) and 53 (20‐870), respectively. Seven studies examined miRNAs in serum 9, 11, 15, 16, 20, 21, 25 and 10 in plasma.10, 14, 17, 18, 19, 22, 23, 24, 26, 27 Overall, 17 studies evaluating 35 circulating miRNA markers and 19 miRNA panels in serum or plasma were included (total 109 miRNAs). All 17 studies quantified miRNA levels using qRT‐PCR, the most commonly used method for miRNA detection and quantification over the past 5 years. Only one study conducted by Ma et al17 additionally used digital PCR to quantify miRNA level. Most of the included studies used individual miRNAs to build up panels, while two studies applied ratios between the expression values of all miRNAs10, 24 and one study applied differentially expressed miRNA pairs11 to build up panels.
3.3. Diagnostic performance of miRNA markers
In total, 109 circulating miRNAs were reported to be statistically significant for LC diagnosis, among which 30 miRNAs were reported in at least two studies (Table 3). Most identified miRNAs were also included in panels, and only nine miRNAs were not part of any panel (Table S1). The smallest panel included only two miRNAs,11, 16, 17, 18, 19, 27 and the largest panel included 34 miRNAs.9 An overview of the diagnostic performance of all reported miRNAs and miRNA panels is shown in Figure 2A. For individual miRNAs, the median (range) reported sensitivity and specificity were 78.4% (51.7%‐100%) and 78.7% (42.9‐93.5%), respectively. The median (range) reported sensitivity and specificity of miRNA panels were 83% (64%‐100%) and 84.9% (71%‐100%), respectively. More detailed representation of miRNAs and miRNA panels with ≥80% sensitivity and ≥80% specificity is shown in Figure 2B (three individual miRNAs and 11 miRNA panels). Overall, the diagnostic performance of miRNA panels appears better than that of individual miRNAs.
Table 3.
Summary of studies reporting significant associations of miRNAs with lung cancer in Western populations (only miRNAs that have been reported in ≥2 studies)
| miRNA | Zaporozhchenko, 2016 27 | Halvorsen, 2016 15 | Chen, 2016 14 | Wozniak, 2015 26 | Wang, 2015 25 | Sozzi, 2014 24 | Sanfiorenzo, 2013 22 | Rani, 2013 20 | Ma, 2013 17 | Hennessey, 2012 11 | Heegaard, 2012 16 | Shen, 2011 23 | Roth, 2011 21 | Boeri, 2011 10 | Bianchi, 2011 9 | Number of studies |
|---|---|---|---|---|---|---|---|---|---|---|---|---|---|---|---|---|
| miR‐21 | △↑ | △↑ | ○ | △↑ | ○↑ | ○ | 6 | |||||||||
| miR‐155 | ○↑ | ○↑ | ○↓ | △↑ | 4 | |||||||||||
| miR‐126 | ○ | ○↓ | ○↓ | ○ | 4 | |||||||||||
| miR‐486 | ○ | ○↓ | ○ | ○ | 4 | |||||||||||
| miR‐17 | ○ | ○↓ | ○ | ○ | 4 | |||||||||||
| miR‐142‐3p | ○ | ○ | ○ | ○ | 4 | |||||||||||
| miR‐25 | △↓ | ○↑ | ○↑ | 3 | ||||||||||||
| miR‐15b | ○ | ○ | ○ | 3 | ||||||||||||
| miR‐19b | ○ | ○ | ○ | 3 | ||||||||||||
| miR‐221 | ○ | ○↓ | ○ | 3 | ||||||||||||
| miR‐30c | ○ | ○ | ○ | 3 | ||||||||||||
| miR‐92a | ○ | ○ | ○ | 3 | ||||||||||||
| miR‐106a | ○ | ○↓ | ○ | 3 | ||||||||||||
| miR‐140‐5p | ○ | ○ | ○ | 3 | ||||||||||||
| miR‐30b | ○ | ○ | ○ | 3 | ||||||||||||
| miR‐566 | ○↓ | △↑ | ○ | 3 | ||||||||||||
| miR‐145 | ○ | ○↓ | 2 | |||||||||||||
| miR‐182 | ○↓ | △↑ | 2 | |||||||||||||
| miR‐223 | ○↑ | ○ | 2 | |||||||||||||
| miR‐148a | ○ | ○ | 2 | |||||||||||||
| miR‐197 | ○ | ○ | 2 | |||||||||||||
| miR‐205 | △‐ | ○↑ | 2 | |||||||||||||
| miR‐28‐3p | ○ | ○ | 2 | |||||||||||||
| miR‐320 | ○ | ○ | 2 | |||||||||||||
| miR‐451 | ○ | ○ | 2 | |||||||||||||
| let‐7a | ○↓ | ○ | 2 | |||||||||||||
| let‐7b | ○↑ | ○ | 2 | |||||||||||||
| miR‐140‐3p | ○ | ○ | 2 | |||||||||||||
| miR‐203 | ○↑ | ○↓ | 2 | |||||||||||||
| miR‐660 | ○ | ○ | 2 |
○ represents miRNAs which are part of a panel; △ represents miRNAs which have only been analyzed individually and not as a part of a miRNA panel; ↑ represents upregulation; ↓ represents downregulation; and ‐ represents no difference in overall study population.
Figure 2.
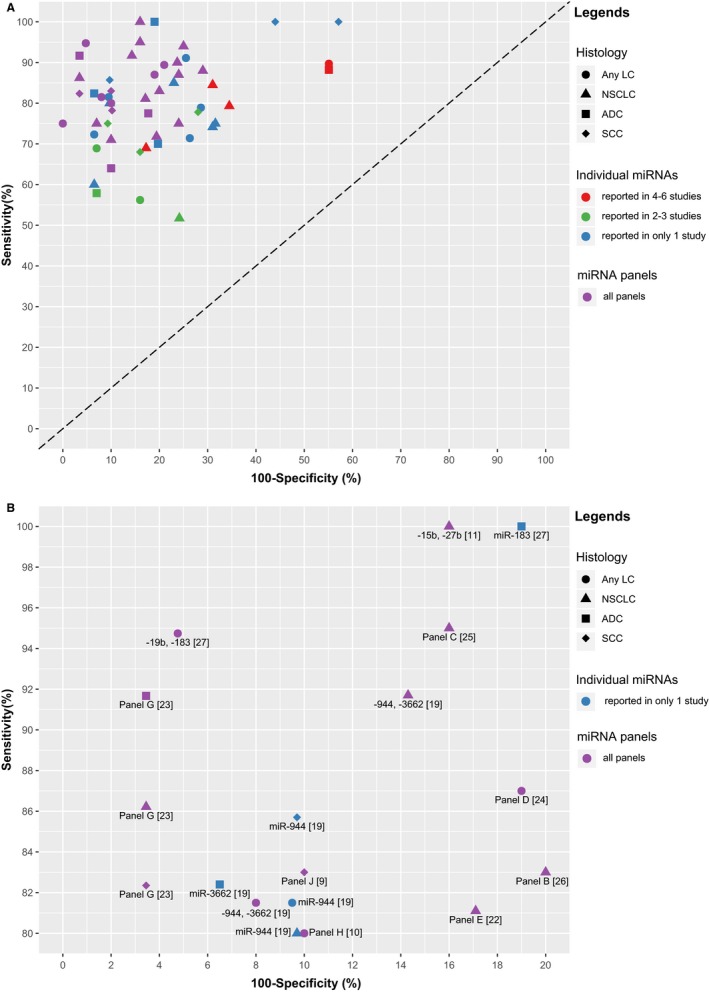
Graphical representation of sensitivity vs specificity of analyzed miRNAs. Sensitivity is plotted on the y‐axis while on the x‐axis the false‐positive rate is presented (100‐Specificity). A, Overview of all analyzed miRNAs and miRNA panels; B, more detailed representation of miRNAs and miRNA panels with ≥80% sensitivity and ≥80% specificity. The numbers displayed in the brackets represent the corresponding reference numbers. Panel B (24 miRs): let‐7c, ‐122, ‐182, ‐193a‐5p, ‐200c, ‐203, ‐218, ‐155, let‐7b, ‐411, ‐450b‐5p, ‐485‐3p, ‐519a, ‐642, ‐517b, ‐520f, ‐206, ‐566, ‐661, ‐340*, ‐1243, ‐720, ‐543, ‐1267; Panel C: ‐214, ‐483‐5p, ‐193a‐3p, ‐25, ‐7; Panel D (24 miRs): ‐101, ‐106a, ‐126, ‐133a, ‐140‐3p, ‐140‐5p, ‐142‐3p, ‐145, ‐148a, ‐15b, ‐16, ‐17, ‐197, ‐19b, ‐21, ‐221, ‐28‐3p, ‐30b, ‐30c, ‐320, ‐451, ‐486‐5p, ‐660, ‐92a; Panel E (11 miRs): ‐155‐5p, ‐20a‐5p, ‐25‐3p, ‐296‐5p, ‐126‐3p, ‐223‐3p, ‐199a‐5p, ‐24‐3p, ‐152‐3p, ‐145‐5p, let‐7f‐5p; Panel G: ‐21, ‐486‐5p, ‐126, ‐210; Panel H (15 miRs): ‐92a, ‐30c, ‐30b, ‐28‐3p, ‐19b, ‐15b, ‐142‐3p, ‐140‐5p, ‐106a, ‐660, ‐451, ‐320, ‐221, ‐197, ‐17; Panel J (34 miRs): ‐92a, ‐486‐5p, ‐484, ‐191, ‐26a, let‐7b, ‐328, ‐30c, ‐342‐3p, ‐30b, ‐26b, ‐142‐3p, ‐331‐3p, ‐103, ‐17, ‐let‐7a, ‐126, ‐22, ‐374a, ‐148b, let‐7d, ‐28‐5p, ‐139‐5p, ‐376a, ‐98, ‐223, ‐142‐5p, ‐140‐5p, ‐29a, ‐148a, ‐133b, ‐32, ‐566, ‐432*. ADC, adenocarcinoma; LC, lung cancer; NSCLC, non‐small‐cell lung cancer; SCC, squamous cell carcinoma
Six of 17 studies recruited LC cases of any histological subtypes,10, 18, 19, 21, 24, 27 10 studies recruited only non‐small‐cell lung cancer (NSCLC) patients,9, 11, 14, 15, 16, 17, 22, 23, 25, 26 and only one study specifically assessed adenocarcinoma LC cases (ADC).20 For subgroup analysis, seven studies performed histology‐specific analysis (Tables 1 and 2),9, 16, 19, 22, 23, 26, 27 and five studies performed stage‐specific analysis (Table S2).9, 15, 18, 23, 26 In histology‐specific analyses, several studies observed differential sensitivity, specificity, or AUC values in different histological subtypes, ADC and squamous cell carcinoma (SCC), for the same miRNA or miRNA panel.9, 19, 22, 23, 26, 27 This indicates that miRNAs might play different roles in different histological subtypes of LC, but no histology‐specific miRNA could be identified as the diagnostic performance of miRNAs showed limited differences between different histological subtypes (Table 1). In stage‐specific analyses, several studies showed that diagnostic efficacy of either miRNAs or miRNA panels in advanced stage of LC seems to be better than in early stage of LC; however, the differences with respect to AUC were rather small (Table S2).
Among the 17 studies, two studies evaluated miRNA panels in a prospective setting. Boeri et al10 derived and verified a panel of 15 miRNAs for predicting LC incidence in 2 years in a computed tomography (CT) screening trial and yielded sensitivity and specificity of 80% and 90%, respectively. In independent samples of the same trial, Sozzi et al24 validated a panel of 24 miRNAs that consisted of the 15 miRNAs in Boeri's study's panel 10 and extra nine miRNAs also identified by Boeri's study,10 which showed sensitivity and specificity of 87% and 81%, respectively. In both studies, the algorithm for building up panels was based on miRNA ratios, which were computed between all investigated miRNAs that were consistently expressed in plasma. Boeri et al10 suggested that the “ratio method” has equal robustness as the common miRNA normalization but can reduce potential bias introduced by common normalization methods.
There were 30 miRNAs reported at least twice, among which miRNA‐21 was the most frequently reported (six studies), followed by miR‐155, miRNA‐126, miRNA‐486, miRNA‐17, and miRNA‐142‐3p (all four studies) (Table 3). However, higher frequency of reports did not automatically entail the best diagnostic efficacy. For example, the median sensitivity of miRNA‐21 was 88.2% (79.3%‐89.7%), but its median specificity was relatively low, only 44.9% (44.9%‐65.5%).
3.4. Direction of dysregulation of circulating miRNAs
Of the 17 studies, 13 studies described the direction of dysregulation of miRNAs in blood, and four studies had no information about miRNA dysregulation (Table S1). Among the 30 miRNAs reported in at least two studies, the overall dysregulation direction of different miRNAs was not always consistent, that is, for six miRNAs, contradictory results were described (Table 3). However, several miRNAs, such as miR‐21 and miR‐126, were consistently reported to have the same dysregulation direction in every corresponding study regardless of histological subtype, stage, or sample type.14, 17, 22, 23, 27
Some miRNAs displayed no significant differences between overall LC cases of any histological subtype and controls in several studies, but they showed differential expression between LC cases of specific histological subtype and controls, and a few of them were even included in miRNA panels (Table S1). For example, in Zaporozhchenko's study,27 miR‐205 levels showed no significant difference between any LC cases and controls, but it was significantly lower in SCC cases compared with controls. Furthermore, in Wozniak's study,26 let‐7c, miR‐1267, miR‐206, miR‐519a, miR‐520f, miR‐543, and miR‐720 alone showed no significant difference between NSCLC cases and controls; nonetheless, these miRNAs were incorporated into a 24‐miRNA panel and contributed to generate an AUC value of 0.92.
4. DISCUSSION
In this systematic literature review, we identified 17 studies evaluating the diagnostic performance of serum and plasma miRNA markers for LC detection in Western populations. A total number of 109 circulating miRNAs were suggested to hold potential for detection of LC. Most studies incorporated individual miRNA markers as panels (with 2‐34 markers), and multiple miRNA‐based panels generally outperformed individual markers. Two promising miRNA panels were discovered and verified in prospective cohorts.10, 24 Of note, both of these studies exclusively applied miRNA ratios when building up panels. Histology‐ and stage‐specific diagnostic performances were also explored by small number of studies; however, differences with respect to AUCs were very limited.
Overall, the diagnostic performance of the investigated circulating miRNAs and miRNA panels for LC detection appears to be rather promising, with the sum of sensitivity and specificity by far exceeding 100% in most cases (Figure 2A). There were even three individual miRNAs and 11 miRNA panels with both sensitivity and specificity above 80% (Figure 2B). Some miRNA panels even showed very good diagnostic performance. For example, Zaporozhchenko et al27 used a panel composed of miR‐19b and miR‐183 in plasma to detect any histological subtype of LC, and the reported sensitivity and specificity reached 95% and 95%, respectively. Also, Shen et al23 used plasma miR‐21, miR‐486‐5p, miR‐126, and miR‐210 to form a panel for the detection of lung adenocarcinoma which yielded 92% sensitivity and 97% specificity. Some miRNA panels even seemed to be useful for prediction of LC incidence 1‐2 years prior to diagnosis in high‐risk populations, with sensitivity and specificity both over 80%.10, 24 However, most of the included studies were case‐control studies with blood sampling after diagnosis of cases and the sample sizes were relatively small. Most importantly, however, many of the seemingly most promising markers and panels were not independently validated, and reported indicators of diagnostic performance may be overoptimistic. Future validation is therefore indispensable. Such validation should preferably be done within the context of prospective cohort studies.
Although the origin of miRNAs in blood and other body fluids is not fully elucidated yet, miRNAs have specific profiles in different diseases and pathological processes and have shown great potential in the diagnosis and prognosis of various diseases in addition to LC, such as other common cancers, inflammation, and autoimmune diseases.28, 29, 30, 31, 32, 33 With the increasing number of miRNAs with reported association with LC, the low degree of overlap of lung cancer‐specific miRNAs among different studies has become a major concern in applying miRNA for LC detection.6 Among the 109 miRNAs included in this review, only 30 miRNA were reported in at least two studies and unlike miR‐21 which consistently demonstrated increased levels in cancer patients, there were miRNAs with reported opposite expression patterns, such as miR‐155, miR‐182, miR‐203, miR‐205, miR‐25, and miR‐566 (Table S3), despite some of them showing good diagnostic performance for LC detection.
One of the causes for the heterogeneity of reported miRNA biomarkers is the differences in study populations. Different tumor histological subtypes or stages of LC cases seem to display at least partially varying miRNA profiles in blood,9, 15, 18, 19, 22, 23, 26, 27 which is possibly due to different roles some miRNAs can play in tumor initiation and progression in histologically distinct tumor microenvironments. For example, at defined levels of specificity, sensitivities tentatively increasing with progression of cancer stages were observed for a 34‐miRNA panel in Bianchi et al's study9 (sensitivities of 59% and 92%, respectively, for Stages I and II‐IV, at specificity of 90%), and for a 4‐miRNA panel in Shen et al's study23 (sensitivities of 73%, 87%, 92%, and 94%, respectively, for Stages I, II, III, and IV, at specificity of 97%,). However, stage‐specific analyses of included studies were based on very limited number of cases. In addition, studies showed that also other population characteristics such as age, weight, smoking status, and ethnicity can affect the identification of miRNA markers.12, 34, 35, 36 Even other benign diseases such as chronic obstructive pulmonary disease (COPD), asthma, and tuberculosis can alter blood miRNA profiles and make some study participants unsuitable controls.37, 38, 39 Therefore, in this systematic review, we selected Western populations and excluded studies with disease controls to reduce the heterogeneity of included miRNAs caused by above‐mentioned factors.
Sample preparation is an essential pre‐analytical factor affecting the identification of potential marker candidates. Since the concentrations of cellular miRNAs are relatively high compared to those in plasma and serum, a second high‐speed centrifugation or filtration step during blood processing is recommended.40, 41, 42, 43 This would serve to remove the potentially retained cells and cell debris from the plasma or serum fraction to minimize the possibility of blood cell contamination of the samples which could lead to an erroneous interpretation of the results. However, only few of the included studies applied such a high‐speed centrifugation step (Table S4). Hemolysis of samples is another factor that can cause variability in miRNA findings.44 Erythroid‐specific miRNAs, such as miR‐15b, miR‐16, miR‐141, miR‐451, and miR‐486, are proposed indicators of hemolysis, and their levels can increase up to 50‐fold in hemolyzed samples.41, 42, 45, 46 Of the included 17 studies, only three studies22, 24, 25 reported having taken sample hemolysis into account during data processing.
Although both plasma and serum are acceptable sample types for the analysis of circulating miRNAs and high correlation of miRNA concentrations between plasma and serum has been observed,47 there are differences between the miRNA profiles obtained from different sample types, which may account for the heterogeneity of reported miRNA biomarkers between studies using plasma samples and those using serum samples. Compared to plasma samples, miRNAs in serum samples have been reported to be higher in concentration but smaller in diversity, suggesting that the coagulation process may affect the amount and species of circulating miRNA.47, 48 In addition, hemolysis is more likely to affect plasma miRNA profiles during sample preparation,41, 46 and certain types of anticoagulants used in plasma, such as heparin and EDTA, could also influence the abundance of miRNAs quantified by qPCR.49, 50
Differences in miRNA extraction and quantification methods as analytical factor could also affect the identification of cancer‐specific miRNAs. Studies indicated that the miRNeasy kit had better miRNA extraction efficiency compared with other miRNA extraction kits.51, 52 Still, the extraction methods in the included studies were diverse and only few studies used the miRNeasy kit (Table S4). Over the past years, quantitative real‐time polymerase chain reaction (qRT‐PCR) has become the most commonly used method for miRNA detection and all the included studies applied it. Notably, Ma et al17 additionally used digital PCR and found that it had a higher sensitivity to detect miRNA copy numbers compared to qRT‐PCR. New and constantly improving technologies, such as next‐generation sequencing (NGS), might also offer a feasible alternative to real‐time PCR‐based methods and enable the detection of novel miRNAs as well as a larger number of miRNA targets per sample in the future.53
Another important yet unresolved issue present in circulating miRNA investigation is normalization. At present, no circulating miRNAs have been established as suitable endogenous controls for normalization in plasma or serum. Some researchers even use circulating miR‐16 for this purpose (Table S4), despite its high variability or altered expression in the circulation of cancer patients as well as in hemolyzed samples.8, 41, 54 However, there are some approaches which can be used to minimize experimental variation, such as spiking‐in synthetic miRNAs from another species (C. elegans or A. thaliana) to check for technical variability during miRNA extraction and processing the same or using constant volumes of samples at each step of the experimental process to somewhat standardize the RNA input.55, 56
Considering the limitations mentioned above, several studies tried to develop new bioinformatics tools to reduce the analysis bias.10, 11, 24 For example, Hennessey et al11 introduced differentially expressed miRNA pairs in serum for NSCLC diagnosis. The differentially expressed miRNA pair of miR‐15b and miR‐27b yielded 100% sensitivity and 84% specificity for distinguishing NSCLC cases and healthy subjects. In another example, Boeri et al10 used miRNA ratios instead of just quantities of individual miRNAs in plasma as markers in their nested case‐control study. These miRNA ratios showed a good predictive value for LC development in the next 1‐2 years in a high‐risk smoking population with sensitivity and specificity of 87% and 81%, respectively.
Diagnostic or predictive accuracy of miRNAs is usually enhanced by combination of multiple individual miRNAs as a panel. Currently most studies build up panels based on miRNAs that showed statistically significant associations with LC. This may only capture the main effects of the included miRNA markers. However, it is known that miRNAs can interact with one another,57 which may also contribute to the diagnosis or prediction of the disease, as exemplified by some studies26, 27 in which miRNAs that were not differentially expressed in individual analysis made up components of miRNA panels. Future studies should thus optimize the marker selection procedure by modeling both the main and the interacting effects of the miRNA markers.
5. CONCLUSION
Our review suggests that circulating miRNAs have great potential to be used as markers for LC detection and may be promising candidates for general cancer screening. Compared to previous reviews,39, 58, 59, 60, 61, 62, 63, 64, 65 we employed a broader inclusion criterion by including all histological types of LC cases, and we focused on studies conducted in Western populations in order to reduce a primary source of heterogeneity in miRNAs profiles. Although previous reviews have reported tremendous heterogeneity in included studies and inconsistency in LC‐related miRNA markers, very few reviews explored the sources of the heterogeneity.62, 65 We comprehensively addressed heterogeneity from multiple perspectives, including study populations, biological sample types and processing, methodology in miRNA detection, and data normalization and analysis. Thorough attention to those factors may help to standardize miRNA analytical procedures in the future. In particular, the following implementations may help to reduce measurement and analytical bias and to improve diagnostic performance: minimization of pre‐analytical or analytical variability, utilization of larger prospective studies, improvement of miRNA detection technologies, and development of new analysis methods. Another important step toward the translation of these findings into clinical practice and routine is the selection and validation of truly relevant circulating miRNAs for the formation of diagnostically superior miRNA panels or even multi‐marker combinations with other types of biomarkers. It should be noted, however, that the reported miRNA markers in this review were all derived from the Western populations to take into account heterogeneity of miRNA profiles between ethnicities. Generalization of these miRNA markers thus should be carried out with caution, as the findings summarized in this systematic review may not apply to non‐Western populations.
CONFLICT OF INTERESTS
The authors declare that they have no competing interests.
AVAILABILITY OF DATA AND MATERIAL
All data generated or analyzed during this study are included in this published article and its supplementary information files.
Supporting information
Yu H, Guan Z, Cuk K, Brenner H, Zhang Y. Circulating microRNA biomarkers for lung cancer detection in Western populations. Cancer Med. 2018;7:4849–4862. 10.1002/cam4.1782
Funding information
This study was supported in part by the China Scholarship Council (CSC). The sponsor had no role in the study design and in the collection, analysis, and interpretation of data.
References
- 1. Torre LA, Bray F, Siegel RL, Ferlay J, Lortet‐Tieulent J, Jemal A. Global cancer statistics, 2012. CA Cancer J Clin. 2015;65:87‐108. [DOI] [PubMed] [Google Scholar]
- 2. Field JK, Raji OY. The potential for using risk models in future lung cancer screening trials. F1000 Med Rep. 2010;2:38. [DOI] [PMC free article] [PubMed] [Google Scholar]
- 3. Manser R, Lethaby A, Irving LB, et al. Screening for lung cancer. Cochrane Database Syst Rev. 2013;(6):CD001991. [DOI] [PMC free article] [PubMed] [Google Scholar]
- 4. Aberle DR, Adams AM, Berg CD, et al. Team NLSTR: reduced lung‐cancer mortality with low‐dose computed tomographic screening. N Engl J Med. 2011;365:395‐409. [DOI] [PMC free article] [PubMed] [Google Scholar]
- 5. Croswell JM, Baker SG, Marcus PM, Clapp JD, Kramer BS. Cumulative incidence of false‐positive test results in lung cancer screening a randomized trial. Ann Intern Med. 2010;152:505‐553. [DOI] [PubMed] [Google Scholar]
- 6. He YQ, Lin JJ, Kong DL, et al. Current state of circulating MicroRNAs as cancer biomarkers. Clin Chem. 2015;61:1138‐1155. [DOI] [PubMed] [Google Scholar]
- 7. Garzon R, Calin GA, Croce CM. MicroRNAs in cancer. Annu Rev Med. 2009;60:167‐179. [DOI] [PubMed] [Google Scholar]
- 8. Chen X, Ba Y, Ma LJ, et al. Characterization of microRNAs in serum: a novel class of biomarkers for diagnosis of cancer and other diseases. Cell Res. 2008;18:997‐1006. [DOI] [PubMed] [Google Scholar]
- 9. Bianchi F, Nicassio F, Marzi M, , et al. A serum circulating miRNA diagnostic test to identify asymptomatic high‐risk individuals with early stage lung cancer. EMBO Mol Med. 2011;3:495‐503. [DOI] [PMC free article] [PubMed] [Google Scholar]
- 10. Boeri M, Verri C, Conte D, et al. MicroRNA signatures in tissues and plasma predict development and prognosis of computed tomography detected lung cancer. Proc Natl Acad Sci USA. 2011;108:3713‐3718. [DOI] [PMC free article] [PubMed] [Google Scholar]
- 11. Hennessey PT, Sanford T, Choudhary A, et al. Serum microRNA biomarkers for detection of non‐small cell lung cancer. PLoS ONE. 2012;7:e32307. [DOI] [PMC free article] [PubMed] [Google Scholar]
- 12. Huang RS, Gamazon ER, Ziliak D, et al. Population differences in microRNA expression and biological implications. RNA Biol. 2011;8:692‐701. [DOI] [PMC free article] [PubMed] [Google Scholar]
- 13. Moher D, Liberati A, Tetzlaff J, Altman DG, Grp P. Preferred reporting items for systematic reviews and meta‐analyses: the PRISMA statement. PLoS Med. 2009;6:e1000097. [DOI] [PMC free article] [PubMed] [Google Scholar]
- 14. Chen H, Liu H, Zou H, et al. Evaluation of Plasma miR‐21 and miR‐152 as diagnostic biomarkers for common types of human cancers. J Cancer. 2016;7:490‐499. [DOI] [PMC free article] [PubMed] [Google Scholar]
- 15. Halvorsen AR, Bjaanaes M, LeBlanc M, et al. A unique set of 6 circulating microRNAs for early detection of non‐small cell lung cancer. Oncotarget. 2016;7:37250‐37259. [DOI] [PMC free article] [PubMed] [Google Scholar]
- 16. Heegaard NH, Schetter AJ, Welsh JA, Yoneda M, Bowman ED, Harris CC. Circulating micro‐RNA expression profiles in early stage nonsmall cell lung cancer. Int J Cancer. 2012;130:1378‐1386. [DOI] [PMC free article] [PubMed] [Google Scholar]
- 17. Ma J, Li N, Guarnera M, Jiang F. Quantification of plasma miRNAs by digital PCR for cancer diagnosis. Biomark Insights. 2013;8:127‐136. [DOI] [PMC free article] [PubMed] [Google Scholar]
- 18. Powrozek T, Krawczyk P, Kowalski DM, et al. Application of plasma circulating microRNA‐448, 506, 4316, and 4478 analysis for non‐invasive diagnosis of lung cancer. Tumour Biol. 2016;37:2049‐2055. [DOI] [PubMed] [Google Scholar]
- 19. Powrozek T, Krawczyk P, Kowalski DM, Winiarczyk K, Olszyna‐Serementa M, Milanowski J. Plasma circulating microRNA‐944 and microRNA‐3662 as potential histologic type‐specific early lung cancer biomarkers. Transl Res. 2015;166:315‐323. [DOI] [PubMed] [Google Scholar]
- 20. Rani S, Gately K, Crown J, O'Byrne K, O'Driscoll L. Global analysis of serum microRNAs as potential biomarkers for lung adenocarcinoma. Cancer Biol Ther. 2013;14:1104‐1112. [DOI] [PMC free article] [PubMed] [Google Scholar]
- 21. Roth C, Kasimir‐Bauer S, Pantel K, Schwarzenbach H. Screening for circulating nucleic acids and caspase activity in the peripheral blood as potential diagnostic tools in lung cancer. Mol Oncol. 2011;5:281‐291. [DOI] [PMC free article] [PubMed] [Google Scholar]
- 22. Sanfiorenzo C, Ilie MI, Belaid A, et al. Two panels of plasma microRNAs as non‐invasive biomarkers for prediction of recurrence in resectable NSCLC. PLoS ONE. 2013;8:e54596. [DOI] [PMC free article] [PubMed] [Google Scholar]
- 23. Shen J, Todd NW, Zhang H, et al. Plasma microRNAs as potential biomarkers for non‐small‐cell lung cancer. Lab Invest. 2011;91:579‐587. [DOI] [PMC free article] [PubMed] [Google Scholar]
- 24. Sozzi G, Boeri M, Rossi M, et al. Clinical utility of a plasma‐based miRNA signature classifier within computed tomography lung cancer screening: a correlative MILD trial study. J Clin Oncol. 2014;32:768‐773. [DOI] [PMC free article] [PubMed] [Google Scholar]
- 25. Wang C, Ding M, Xia M, et al. A five‐miRNA panel identified from a multicentric case‐control study serves as a novel diagnostic tool for ethnically diverse non‐small‐cell lung cancer patients. EBioMedicine. 2015;2:1377‐1385. [DOI] [PMC free article] [PubMed] [Google Scholar]
- 26. Wozniak MB, Scelo G, Muller DC, Mukeria A, Zaridze D, Brennan P. Circulating MicroRNAs as non‐invasive biomarkers for early detection of non‐small‐cell lung cancer. PLoS ONE. 2015;10:e0125026. [DOI] [PMC free article] [PubMed] [Google Scholar]
- 27. Zaporozhchenko IA, Morozkin ES, Skvortsova TE, et al. Plasma miR‐19b and miR‐183 as potential biomarkers of lung cancer. PLoS ONE. 2016;11:e0165261. [DOI] [PMC free article] [PubMed] [Google Scholar]
- 28. Zhang YC, Xu Z, Zhang TF, Wang YL. Circulating microRNAs as diagnostic and prognostic tools for hepatocellular carcinoma. World J Gastroenterol. 2015;21:9853‐9862. [DOI] [PMC free article] [PubMed] [Google Scholar]
- 29. Huang ZH, Huang D, Ni SJA, Peng ZL, Sheng WQ, Du X. Plasma microRNAs are promising novel biomarkers for early detection of colorectal cancer. Int J Cancer. 2010;127:118‐126. [DOI] [PubMed] [Google Scholar]
- 30. Huang YK, Yu JC. Circulating microRNAs and long non‐coding RNAs in gastric cancer diagnosis: an update and review. World J Gastroenterol. 2015;21:9863‐9886. [DOI] [PMC free article] [PubMed] [Google Scholar]
- 31. Bertoli G, Cava C, Castiglioni I. MicroRNAs as Biomarkers for diagnosis, prognosis and theranostics in prostate cancer. Int J Mol Sci. 2016;17:421. [DOI] [PMC free article] [PubMed] [Google Scholar]
- 32. Bertoli G, Cava C, Castiglioni I. MicroRNAs: new biomarkers for diagnosis, prognosis, therapy prediction and therapeutic tools for breast cancer. Theranostics. 2015;5:1122‐1143. [DOI] [PMC free article] [PubMed] [Google Scholar]
- 33. Ardekani AM, Naeini MM. The role of MicroRNAs in human diseases. Avicenna J Med Biotechnol. 2010;2:161‐179. [PMC free article] [PubMed] [Google Scholar]
- 34. Ortega FJ, Mercader JM, Catalan V, et al. Targeting the circulating microRNA signature of obesity. Clin Chem. 2013;59:781‐792. [DOI] [PubMed] [Google Scholar]
- 35. Hooten NN, Fitzpatrick M, Wood WH, et al. Age‐related changes in microRNA levels in serum. Aging‐Us. 2013;5:725‐740. [DOI] [PMC free article] [PubMed] [Google Scholar]
- 36. Badrnya S, Baumgartner R, Assinger A. Smoking alters circulating plasma microvesicle pattern and microRNA signatures. Thromb Haemost. 2014;112:128‐136. [DOI] [PubMed] [Google Scholar]
- 37. Pattarayan D, Thimmulappa RK, Ravikumar V, Rajasekaran S. Diagnostic potential of extracellular MicroRNA in respiratory diseases. Clin Rev Allergy Immunol. 2016;54:480‐492. [DOI] [PubMed] [Google Scholar]
- 38. Mestdagh P, Vandesompele J, Brusselle G, Vermaelen K. Non‐coding RNAs and respiratory disease. Thorax. 2015;70:388‐390. [DOI] [PubMed] [Google Scholar]
- 39. Alipoor SD, Adcock IM, Garssen J, et al. The roles of miRNAs as potential biomarkers in lung diseases. Eur J Pharmacol. 2016;791:395‐404. [DOI] [PMC free article] [PubMed] [Google Scholar]
- 40. Zheng XH, Cui C, Zhou XX, Zeng YX, Jia WH. Centrifugation: an important pre‐analytic procedure that influences plasma microRNA quantification during blood processing. Chin J Cancer. 2013;32:667‐672. [DOI] [PMC free article] [PubMed] [Google Scholar]
- 41. Pritchard CC, Kroh E, Wood B, et al. Blood cell origin of circulating microRNAs: a cautionary note for cancer biomarker studies. Cancer Prev Res. 2012;5:492‐497. [DOI] [PMC free article] [PubMed] [Google Scholar]
- 42. McDonald JS, Milosevic D, Reddi HV, Grebe SK, Algeciras‐Schimnich A. Analysis of circulating microRNA: preanalytical and analytical challenges. Clin Chem. 2011;57:833‐840. [DOI] [PubMed] [Google Scholar]
- 43. Duttagupta R, Jiang R, Gollub J, Getts RC, Jones KW. Impact of cellular miRNAs on circulating miRNA biomarker signatures. PLoS ONE. 2011;6:e20769. [DOI] [PMC free article] [PubMed] [Google Scholar]
- 44. Becker N, Lockwood CM. Pre‐analytical variables in miRNA analysis. Clin Biochem. 2013;46:861‐868. [DOI] [PubMed] [Google Scholar]
- 45. Kirschner MB, Kao SC, Edelman JJ, et al. Haemolysis during sample preparation alters microRNA content of plasma. PLoS ONE. 2011;6:e24145. [DOI] [PMC free article] [PubMed] [Google Scholar]
- 46. Kirschner MB, Edelman JJ, Kao SC, Vallely MP, van Zandwijk N, Reid G. The impact of hemolysis on cell‐free microRNA biomarkers. Front Genet. 2013;4:94. [DOI] [PMC free article] [PubMed] [Google Scholar]
- 47. Foye C, Yan IK, David W, et al. Comparison of miRNA quantitation by Nanostring in serum and plasma samples. PLoS ONE. 2017;12:e0189165. [DOI] [PMC free article] [PubMed] [Google Scholar]
- 48. Wang K, Yuan Y, Cho JH, McClarty S, Baxter D, Galas DJ. Comparing the MicroRNA spectrum between serum and plasma. PLoS ONE. 2012;7:e41561. [DOI] [PMC free article] [PubMed] [Google Scholar]
- 49. Leidinger P, Backes C, Rheinheimer S, Keller A, Meese E. Towards clinical applications of blood‐borne miRNA signatures: the influence of the anticoagulant EDTA on miRNA abundance. PLoS ONE. 2015;10:e0143321. [DOI] [PMC free article] [PubMed] [Google Scholar]
- 50. Kim DJ, Linnstaedt S, Palma J, et al. Plasma components affect accuracy of circulating cancer‐related MicroRNA quantitation. J Mol Diagnost. 2012;14:71‐80. [DOI] [PMC free article] [PubMed] [Google Scholar]
- 51. Rice J, Roberts H, Burton J, et al. Assay reproducibility in clinical studies of plasma miRNA. PLoS ONE. 2015;10:e0121948. [DOI] [PMC free article] [PubMed] [Google Scholar]
- 52. El‐Khoury V, Pierson S, Kaoma T, Bernardin F, Berchem G. Assessing cellular and circulating miRNA recovery: the impact of the RNA isolation method and the quantity of input material. Sci Rep. 2016;6:19529. [DOI] [PMC free article] [PubMed] [Google Scholar]
- 53. Hunt EA, Broyles D, Head T, Deo SK. MicroRNA detection: current technology and research strategies. Annu Rev Anal Chem. 2015;8:217‐237. [DOI] [PubMed] [Google Scholar]
- 54. Appaiah HN, Goswami CP, Mina LA, et al. Persistent upregulation of U6:SNORD44 small RNA ratio in the serum of breast cancer patients. Breast Cancer Res. 2011;13:R86. [DOI] [PMC free article] [PubMed] [Google Scholar]
- 55. Kroh EM, Parkin RK, Mitchell PS, Tewari M. Analysis of circulating microRNA biomarkers in plasma and serum using quantitative reverse transcription‐PCR (qRT‐PCR). Methods. 2010;50:298‐301. [DOI] [PMC free article] [PubMed] [Google Scholar]
- 56. Zhang C, Wang C, Chen X, et al. Expression profile of microRNAs in serum: a fingerprint for esophageal squamous cell carcinoma. Clin Chem. 2010;56:1871‐1879. [DOI] [PubMed] [Google Scholar]
- 57. Qiu SW, Lin S, Hu D, Feng YM, Tan Y, Peng Y. Interactions of miR‐323/miR‐326/miR‐329 and miR‐130a/miR‐155/miR‐210 as prognostic indicators for clinical outcome of glioblastoma patients. J Transl Med. 2013;11:10. [DOI] [PMC free article] [PubMed] [Google Scholar]
- 58. Zhao C, Lu FN, Chen HX, et al. Clinical significance of circulating miRNA detection in lung cancer. Med Oncol. 2016;33:41. [DOI] [PubMed] [Google Scholar]
- 59. Wang HQ, Wu SN, Zhao L, Zhao J, Liu JJ, Wang ZH. Clinical use of microRNAs as potential non‐invasive biomarkers for detecting non‐small cell lung cancer: a meta‐analysis. Respirology. 2015;20:56‐65. [DOI] [PubMed] [Google Scholar]
- 60. Ulivi P, Zoli W. miRNAs as non‐invasive biomarkers for lung cancer diagnosis. Molecules. 2014;19:8220‐8237. [DOI] [PMC free article] [PubMed] [Google Scholar]
- 61. Nitu R, Rogobete AF, Gundogdu F, et al. microRNAs expression as novel genetic biomarker for early prediction and continuous monitoring in pulmonary cancer. Biochem Genet. 2017;55:281‐290. [DOI] [PubMed] [Google Scholar]
- 62. Moretti F, D'Antona P, Finardi E, et al. Systematic review and critique of circulating miRNAs as biomarkers of stage I‐II non‐small cell lung cancer. Oncotarget. 2017;8:94980‐94996. [DOI] [PMC free article] [PubMed] [Google Scholar]
- 63. Huang YS, Hu QY, Deng ZH, Hang YL, Wang J, Wang KZ. MicroRNAs in body fluids as biomarkers for non‐small cell lung cancer: a systematic review. Technol Cancer Res Treat. 2014;13:277‐287. [DOI] [PubMed] [Google Scholar]
- 64. He WJ, Li WH, Jiang B, Wang YF, Xia YX, Wang L. MicroRNAs level as an initial screening method for early‐stage lung cancer: a bivariate diagnostic random‐effects meta‐analysis. Int J Clin Exp Med. 2015;8:12317‐12326. [PMC free article] [PubMed] [Google Scholar]
- 65. Chen L, Jin H. MicroRNAs as novel biomarkers in the diagnosis of non‐small cell lung cancer: a meta‐analysis based on 20 studies. Tumor Biol. 2014;35:9119‐9129. [DOI] [PubMed] [Google Scholar]
Associated Data
This section collects any data citations, data availability statements, or supplementary materials included in this article.
Supplementary Materials