

Abstract
Multidimensional interactions of multiple factors are more important in promoting cancer initiation. Gene‐gene interactions between protein‐coding genes have been paid great attention, while rare studies refer to the interactions between encoding and noncoding genes. Our research group previously found encoding gene PGC polymorphisms could affect the susceptibility to atrophic gastritis (AG) and gastric cancer (GC). Interestingly, several SNPs in long noncoding RNA (lncRNA) genes, just adjacent to PGC, were found to be associated with AG risk and GC prognosis afterward. This study aims to explore the SNP interactions between PGC and its neighbor lncRNAs on the risk of AG and GC. Genotyping for seven PGC SNPs and seven lncRNA SNPs was conducted using Sequenom MassARRAY platform in a total of 2228 northern Chinese subjects, including 536 GC cases, 810 AG cases, and 882 controls. We found 15 pairwise PGC‐lncRNAs SNPs had interactions: Five pairs were associated with AG risk, and ten pairs were associated with GC risk. Moreover, two GC‐related interactions PGC rs6939861 with lnc‐C6orf‐132‐1 rs7749023 and rs7747696 survived the Bonferroni correction (P correction = 0.049 and 0.007, respectively). Several combinations showed obvious epistasis and cumulative effects on disease risk. Some three‐way interactions of SNPs with smoking and drinking could also be observed. Besides, a few interacting SNPs showed correlations with the expression levels of PGC protein and related lncRNAs in serum. Our study would provide research clues for further screening combination biomarkers uniting both protein‐coding and noncoding genes with the potential in prediction of the susceptibility to GC and its precursor.
Keywords: atrophic gastritis, gastric cancer, LncRNA, PGC, polymorphism, susceptibility
1. INTRODUCTION
It has been extensively investigated that the most common form of genetic variation, single nucleotide polymorphisms (SNPs), can be potential biomarkers for risk prediction of cancer.1, 2, 3 However, the diagnostic efficacy for single SNP is limited, resulting from the multiple factors involved in carcinogenesis.4 A consensus has been reached that multidimensional interactions of various factors such as gene‐gene and gene‐environment are more important in promoting cancer initiation. Knowledge of gene‐gene and gene‐environment interactions could help to reveal substantial hidden heritability within the architecture of cancer susceptibility.5
In recent years, most investigations on gene‐gene interactions are mainly focused on encoding genes, while rare studies refer to the interactions between encoding and noncoding genes. As we know, among the sequences transcribed constantly in human genomes, only 1% are protein‐coding sequences and the vast majority is noncoding RNA (ncRNA).6 Currently, the number and types of known functional ncRNAs have increased considerably. A subset of both short‐ and long‐sized species are known to be involved in the regulation of target genes located at or near the same genomic locus. Their expression is often coordinated with that of nearby protein‐coding genes, and in many cases, related transcripts can influence each other at one step or another during their biogenesis.7 Therefore, exploration of interactions between encoding and their neighbor noncoding genes would be greatly beneficial for all round elucidation of gene impacts on physiological and disease states.
PGC protein, encoded by the pepsinogen C (PGC) gene, is a specific marker in the terminal differentiation of gastric mucosa, of which the aberrant expression occurs in many gastric diseases.8, 9, 10 Our research group previously found PGC polymorphisms could affect the susceptibility to atrophic gastritis (AG) and gastric cancer (GC).11, 12 Interestingly, several SNPs in long noncoding RNA (lncRNA) genes, just adjacent to PGC, were found to be associated with AG risk and GC prognosis afterward.13 However, it remains unclear whether PGC and its neighbor lncRNAs have SNP interactions with each other on the susceptibility to GC/AG.
In this study, we explored the SNP interactions between PGC and its neighbor lncRNAs on the risk of AG and GC, the modifying effects of environmental factors such as smoking, drinking, and Helicobacter pylori (H. pylori) infection, and the influence of SNP interactions on the expression of PGC protein and related lncRNAs. Our study aims to provide research clues for the identification of combination biomarkers uniting both protein‐coding and noncoding genes with the potential in risk prediction of GC and its precursor.
2. MATERIALS AND METHODS
2.1. Study subjects and epidemic‐clinical information collection
The study was approved by the Ethics Committee of China Medical University First Hospital. Written informed consent was obtained from all participants. A total of 2228 subjects were involved in our study, including 536 GC cases, 810 AG cases, and 882 controls. All enrolled individuals were recruited from the Zhuanghe Gastric Diseases Screening Program or hospitals in Zhuanghe and Shenyang of Liaoning Province, China between 2002 and 2013, which had been previously reported.14 The controls were frequency‐matched to the GC and AG cases, respectively, on the basis of gender and age (±5 years). That means an individual in the control group can be matched to an AG and a GC case simultaneously so long as it has the same sex both with them, and neither the age differences between the control and the AG nor the GC case are more than 5 years. Epidemiological data for each subject were obtained from face‐to‐face inquiry or the medical records of inpatients. After admission, gastroscopy examination was performed by experienced endoscopists. According to the updated Sydney system and the seventh edition of TNM staging,15, 16, 17 histopathological diagnoses were carried out independently by two gastrointestinal pathologists. Patients in the AG group were confirmed to have moderate to severe AG with or without intestinal metaplasia, and individuals confirmed to be with normal stomach or to have mild superficial gastritis were selected for the control group. Fasting venous blood samples (5 mL) were collected from each participant.
2.2. SNP selection
First, a two‐step approach was employed to select tagSNPs for PGC, which was described in our previous studies.11, 12 Then, we focused on the lncRNA genes nearby PGC using Ensembl genome browser,13 approximately encompassing 3 Mb of upstream and downstream flanking sequences of PGC. The selection of SNPs met the following criteria: (1) minor allele frequency (MAF) > 0.05 in CHB and JPT population, (2) pairwise linkage disequilibrium (r 2 < 0.8), and (3) according to Hardy‐Weinberg equilibrium (HWE, P > 0.05). Consequently, seven PGC SNPs (rs6941539, rs9471643, rs6912200, rs6458238, rs3789210, rs4711690, and rs6939861) and seven lncRNA SNPs (rs7749023, rs7748341, rs7747696, rs72855279, and rs80112640 in lnc‐C6orf132‐1; rs1886753 in lnc‐LRFN2‐1; and rs61516247 in lnc‐LRFN2‐2) were selected as research targets.
2.3. Genotyping
Genomic DNA was extracted from each blood sample using phenol‐chloroform method. SNP genotyping was performed by Bio Miao Biological Technology (Beijing, China) applying Sequenom MassARRAY platform (Sequenom, San Diego, CA, USA). Additionally, we randomly selected 10% of the samples for repeated assays, and the results of all duplicated samples were 100% consistent.
2.4. Detection of H. pylori‐IgG titer, PGC protein, and lncRNAs in serum
The serum H. pylori‐IgG titer and PGC protein concentration were detected using an enzyme‐linked immunosorbent assay (ELISA kit, Biohit, Helsinki, Finland). Individuals with the titer > 34 IU were diagnosed as H. pylori‐positive. Total RNA was isolated from 400 μL of serum using a Blood Total RNA Isolation Kit (Bioteke, Beijing, China). Total RNA was converted into complementary DNA using a prime script RT master MIX (TaKaRa Biotech, Dalian, China). The lncRNA levels and an internal control gene, glyceraldehyde 3‐phosphate dehydrogenase (GAPDH), were examined using SYBR Premix Ex TaqII (TaKaRa Biotech, Dalian, China). Quantitative real‐time polymerase chain reaction (qRT‐PCR) was performed in an Eppendorf Mastercycler Gradient System (Eppendorf AG, Hamburg, Germany) according to the manufacturer's protocol. The sequences of primers used in qRT‐PCR were presented in Table S1. All the primers were synthesized by The Beijing Genomics Institute (Beijing, China). Melting curve analysis was performed to exclude the presence of nonspecific products and primer dimers. No template controls were included in each experiment. The relative quantification of lncRNA levels was calculated using the 2−ΔCt method.
2.5. Statistical analysis
The differences in epidemiological characteristics between case and control groups were evaluated using the chi‐squared test. The multinomial logistic regression was applied to estimate the risk of gastric diseases by calculating odds ratios (ORs) with 95% confidence intervals (CIs). The log‐likelihood ratio test was employed to assess the interactions among PGC SNPs, lncRNA SNPs, and environmental factors by comparing the model that only contained the main effects of each factor with the full model that also contained interaction items. The ORs with 95% CIs were adjusted by gender, age, and H. pylori infection status unless H. pylori was regarded as an interaction item. The Cochran‐Armitage test for linear trend was used to judge the dosage effect on diseases risk with an increasing number of interacting factors. The difference in PGC protein and lncRNA levels in serum between two groups was compared using the Student's t test. The statistical analyses mentioned above were conducted using SPSS 22.0 software (SPSS, Chicago, IL, USA). All the tests were two‐sided, and P < 0.05 was considered to be statistically significant. The Bonferroni correction was used to adjust P values for multiple tests as needed. Additionally, the dominant, recessive, and overdominant models were defined as heterozygote+homozygote variant vs. homozygote wild, homozygote variant vs heterozygote+homozygote wild, and heterozygote vs. homozygote wild+homozygote variant, respectively.18
3. RESULTS
3.1. Baseline characteristics of the subjects
The study subjects consisted of 810 AG cases matched with 880 controls and 536 GC cases matched with 748 controls. No significant difference was found in the distribution of gender and age between the two pairwise groups of cases and controls (Table S2).
3.2. Association of single SNPs with AG and GC risk
A total of 14 SNPs were involved in the study, of which the relationship with the susceptibility to GC/AG had been previously investigated by our research group. Among the seven PGC polymorphisms, rs6458328 GA+AA genotype, rs3789210 CG+GG genotype, and rs4711690 CG+GG genotype were associated with a decreased AG risk (P = 0.015, OR = 0.73; P = 0.048, OR = 0.78; P = 0.008, OR = 0.78, respectively). The GC genotype of rs9471643 could reduce GC risk when compared with CC+GG genotype (P = 0.025, OR = 0.79). Furthermore, rs6939861 GA+AA genotype was linked to an increased risk of both AG and GC (AG: P = 0.014, OR = 1.30; GC: P = 0.015, OR = 1.32). However, no association with any disease risk was found in rs6941539 and rs6912200.11, 12 As for the seven lncRNA polymorphisms, rs61516247 was suggested to be associated with AG risk in overall population; while none was observed to have relationship with GC risk.13
3.3. Interactions between PGC and lncRNA SNPs on AG and GC risk
The SNP interactions of PGC with its neighbor lncRNAs were analyzed at first. Based on our previously published data, best genetic models with significant ORs in the main effect analysis were selected for each SNP. The results suggested five pairwise PGC‐lncRNA SNPs had negative interaction effects on AG risk, including rs9471643‐rs7749023 (P interaction = 0.015, interaction index = 0.59), rs9471643‐rs7747696 (P interaction = 0.018, interaction index = 0.60), rs6912200‐rs7749023 (P interaction = 0.017, interaction index = 0.56), rs6912200‐rs7747696 (P interaction = 0.031, interaction index = 0.60), and rs6912200‐rs1886753 (P interaction = 0.023, interaction index = 0.54). For GC risk, ten pairwise PGC‐lncRNA SNPs showed interaction effects. Among them, eight combinations were positively interacted, which were rs6941539‐rs72855279 (P interaction = 0.037, interaction index = 4.65), rs6941539‐rs80112640 (P interaction = 0.038, interaction index = 4.60), rs6912200‐rs72855279 (P interaction = 0.016, interaction index = 6.34), rs6912200‐rs80112640 (P interaction = 0.017, interaction index = 6.27), rs6939861‐rs7749023 (P interaction = 0.007, interaction index = 3.87), rs6939861‐rs7747696 (P interaction = 0.001, interaction index = 4.88), rs6939861‐rs72855279 (P interaction = 0.016, interaction index = 5.70), and rs6939861‐rs80112640 (P interaction = 0.015, interaction index = 5.76), while the other two combinations, rs6941539‐rs7748341 (P interaction = 0.007, interaction index = 0.48) and rs6939861‐rs61516247 (P interaction = 0.041, interaction index = 0.40), were negatively interacted. Moreover, due to the large number of pairs tested, we used the Bonferroni correction to adjust P values for multiple comparison. And two GC‐related interactions rs6939861‐rs7749023 and rs6939861‐rs7747696 survived the correction (P correction = 0.049 and 0.007, respectively), suggesting that they were strongly associated with GC risk (Table 1).
Table 1.
The interaction effects between the SNPs in PGC and its neighbor lncRNAs on the risk of gastric diseasesa
| LncRNA SNP genotypes | PGC rs6941539 | PGC rs9471643 | PGC rs6912200 | PGC rs6458238 | PGC rs3789210 | PGC rs4711690 | PGC rs6939861 | ||||||||
|---|---|---|---|---|---|---|---|---|---|---|---|---|---|---|---|
| CC | CT+TT | GC | GG+CC | CC | CT+TT | GA+AA | GG | CG+GG | CC | CG+GG | CC | GG | GA+AA | ||
| AG vs. CON | |||||||||||||||
| rs7749023 | |||||||||||||||
| AA | Case/control | 330/403 | 131/118 | 159/217 | 304/304 | 101/131 | 362/393 | 64/97 | 401/426 | 109/141 | 357/384 | 178/232 | 287/292 | 176/234 | 274/265 |
| OR (95% CI) | 1 (Ref) | 1.35 (1.01‐1.80) | 1 (Ref) | 1.37 (1.06‐1.77) | 1 (Ref) | 1.20 (0.89‐1.62) | 1 (Ref) | 1.42 (1.01‐2.00) | 1 (Ref) | 1.20 (0.90‐1.60) | 1 (Ref) | 1.28 (1.00‐1.66) | 1 (Ref) | 1.39 (1.07‐1.80) | |
| AC+CC | Case/control | 221/228 | 115/120 | 135/124 | 203/224 | 99/85 | 239/261 | 46/55 | 294/294 | 65/72 | 275/277 | 145/162 | 195/186 | 135/143 | 193/189 |
| OR (95% CI) | 1.17 (0.93‐1.48) | 1.17 (0.88‐1.58) | 1.48 (1.08‐2.04) | 1.23 (0.93‐1.63) | 1.51 (1.02‐2.23) | 1.19 (0.87‐1.63) | 1.21 (0.73‐2.01) | 1.51 (1.06‐2.15) | 1.15 (0.76‐1.75) | 1.28 (0.94‐1.72) | 1.16 (0.86‐1.56) | 1.37 (1.03‐1.81) | 1.25 (0.92‐1.70) | 1.37 (1.03‐1.81) | |
| P interaction = 0.367 | P interaction = 0.015 (0.105 b ) | P interaction = 0.017 (0.119 b ) | P interaction = 0.896 | P interaction = 0.642 | P interaction = 0.290 | P interaction = 0.181 | |||||||||
| Interaction index = 0.81 | Interaction index = 0.59 | Interaction index = 0.56 | Interaction index = 0.96 | Interaction index = 0.89 | Interaction index = 0.80 | Interaction index = 0.75 | |||||||||
| rs7748341 | |||||||||||||||
| AA | Case/control | 390/465 | 150/135 | 189/243 | 356/358 | 121/142 | 421/462 | 70/107 | 476/497 | 124/158 | 423/448 | 208/274 | 338/330 | 210/269 | 317/304 |
| OR (95% CI) | 1 (Ref) | 1.32 (1.01‐1.73) | 1 (Ref) | 1.28 (1.01‐1.63) | 1 (Ref) | 1.07 (0.81‐1.42) | 1 (Ref) | 1.46 (1.05‐2.02) | 1 (Ref) | 1.21 (0.92‐1.58) | 1 (Ref) | 1.36 (1.07‐1.72) | 1 (Ref) | 1.34 (1.06‐1.71) | |
| AG+GG | Case/control | 162/167 | 96/102 | 105/99 | 153/171 | 80/74 | 181/194 | 42/46 | 219/224 | 50/56 | 211/214 | 115/120 | 146/150 | 101/110 | 152/150 |
| OR (95% CI) | 1.15 (0.89‐1.48) | 1.13 (0.83‐1.54) | 1.36 (0.97‐1.90) | 1.15 (0.86‐1.54) | 1.26 (0.85‐1.88) | 1.10 (0.80‐1.51) | 1.33 (0.79‐2.24) | 1.49 (1.05‐2.13) | 1.15 (0.73‐1.80) | 1.26 (0.93‐1.70) | 1.26 (0.92‐1.73) | 1.29 (0.96‐1.72) | 1.16 (0.84‐1.61) | 1.31 (0.98‐1.75) | |
| P interaction = 0.245 | P interaction = 0.067 | P interaction = 0.245 | P interaction = 0.544 | P interaction = 0.462 | P interaction = 0.127 | P interaction = 0.317 | |||||||||
| Interaction index = 0.76 | Interaction index = 0.66 | Interaction index = 0.75 | Interaction index = 0.83 | Interaction index = 0.82 | Interaction index = 0.71 | Interaction index = 0.79 | |||||||||
| rs7747696 | |||||||||||||||
| AA | Case/control | 303/382 | 119/113 | 145/206 | 281/290 | 95/127 | 329/372 | 59/91 | 368/408 | 106/132 | 322/368 | 165/225 | 262/275 | 156/221 | 256/254 |
| OR (95% CI) | 1 (Ref) | 1.32 (0.98‐1.78) | 1 (Ref) | 1.39 (1.06‐1.81) | 1 (Ref) | 1.20 (0.88‐1.62) | 1 (Ref) | 1.39 (0.97‐1.98) | 1 (Ref) | 1.09 (0.81‐1.46) | 1 (Ref) | 1.31 (1.01‐1.70) | 1 (Ref) | 1.44 (1.10‐1.88) | |
| AG+GG | Case/control | 249/250 | 127/128 | 148/136 | 229/243 | 105/92 | 274/285 | 52/62 | 328/317 | 68/84 | 312/296 | 159/173 | 221/205 | 155/158 | 214/204 |
| OR (95% CI) | 1.24 (0.98‐1.56) | 1.25 (0.94‐1.67) | 1.55 (1.13‐2.12) | 1.33 (1.01‐1.76) | 1.53 (1.04‐2.25) | 1.29 (0.94‐1.76) | 1.24 (0.76‐2.04) | 1.59 (1.10‐2.28) | 0.99 (0.66‐1.50) | 1.30 (0.96‐1.76) | 1.25 (0.93‐1.67) | 1.47 (1.11‐1.93) | 1.37 (1.01‐1.86) | 1.49 (1.12‐1.97) | |
| P interaction = 0.482 | P interaction = 0.018(0.126 b ) | P interaction = 0.031 (0.217 b ) | P interaction = 0.858 | P interaction = 0.538 | P interaction = 0.239 | P interaction = 0.121 | |||||||||
| Interaction index = 0.85 | Interaction index = 0.60 | Interaction index = 0.60 | Interaction index = 1.05 | Interaction index = 1.17 | Interaction index = 0.78 | Interaction index = 0.72 | |||||||||
| rs72855279 | |||||||||||||||
| AA | Case/control | 403/475 | 155/146 | 200/253 | 363/369 | 129/151 | 431/474 | 75/108 | 489/517 | 129/163 | 436/464 | 216/287 | 348/338 | 212/275 | 334/319 |
| OR (95% CI) | 1 (Ref) | 1.25 (0.96‐1.63) | 1 (Ref) | 1.24 (0.98‐1.57) | 1 (Ref) | 1.07 (0.81‐1.39) | 1 (Ref) | 1.37 (1.00‐1.89) | 1 (Ref) | 1.19 (0.91‐1.55) | 1 (Ref) | 1.37 (1.09‐1.73) | 1 (Ref) | 1.37 (1.08‐1.74) | |
| AG+GG | Case/control | 146/156 | 92/93 | 92/89 | 147/161 | 71/68 | 170/180 | 37/43 | 205/207 | 43/52 | 199/198 | 105/110 | 137/140 | 98/102 | 135/139 |
| OR (95% CI) | 1.10 (0.85‐1.44) | 1.18 (0.86‐1.61) | 1.30 (0.92‐1.84) | 1.16 (0.87‐1.55) | 1.21 (0.81‐1.83) | 1.11 (0.81‐1.53) | 1.22 (0.72‐2.08) | 1.45 (1.02‐2.06) | 1.05 (0.66‐1.68) | 1.27 (0.94‐1.73) | 1.27 (0.92‐1.75) | 1.31 (0.98‐1.76) | 1.25 (0.90‐1.74) | 1.28 (0.95‐1.72) | |
| P interaction = 0.557 | P interaction = 0.167 | P interaction = 0.404 | P interaction = 0.954 | P interaction = 0.674 | P interaction = 0.105 | P interaction = 0.115 | |||||||||
| Interaction index = 0.87 | Interaction index = 0.72 | Interaction index = 0.81 | Interaction index = 1.02 | Interaction index = 0.89 | Interaction index = 0.69 | Interaction index = 0.69 | |||||||||
| rs80112640 | |||||||||||||||
| AA | Case/control | 403/474 | 155/146 | 201/253 | 360/369 | 129/151 | 431/474 | 73/108 | 489/516 | 129/163 | 434/363 | 216/287 | 346/338 | 214/275 | 330/318 |
| OR (95% CI) | 1 (Ref) | 1.25 (0.96‐1.63) | 1 (Ref) | 1.22 (0.97‐1.55) | 1 (Ref) | 1.07 (0.81‐1.39) | 1 (Ref) | 1.41 (1.02‐1.95) | 1 (Ref) | 1.19 (0.91‐1.55) | 1 (Ref) | 1.37 (1.08‐1.72) | 1 (Ref) | 1.35 (1.06‐1.71) | |
| AG+GG | Case/control | 149/157 | 92/95 | 93/89 | 148/164 | 72/68 | 172/183 | 38/45 | 206/208 | 44/53 | 200/200 | 108/111 | 136/142 | 97/104 | 139/139 |
| OR (95% CI) | 1.12 (0.86‐1.45) | 1.15 (0.84‐1.57) | 1.31 (0.93‐1.85) | 1.14 (0.86‐1.53) | 1.23 (0.82‐1.85) | 1.11 (0.81‐1.52) | 1.23 (0.73‐2.09) | 1.49 (1.04‐2.12) | 1.06 (0.67‐1.68) | 1.27 (0.94‐1.72) | 1.29 (0.94‐1.78) | 1.28 (0.96‐1.72) | 1.20 (0.87‐1.67) | 1.30 (0.97‐1.75) | |
| P interaction = 0.514 | P interaction = 0.161 | P interaction = 0.346 | P interaction = 0.936 | P interaction = 0.686 | P interaction = 0.089 | P interaction = 0.221 | |||||||||
| Interaction index = 0.85 | Interaction index = 0.72 | Interaction index = 0.79 | Interaction index = 0.98 | Interaction index = 0.89 | Interaction index = 0.68 | Interaction index = 0.75 | |||||||||
| rs1886753 | |||||||||||||||
| AG+GG | Case/control | 386/470 | 177/177 | 213/255 | 353/391 | 134/170 | 433/476 | 78/122 | 491/526 | 112/157 | 458/493 | 236/290 | 334/358 | 221/283 | 332/340 |
| OR (95% CI) | 1 (Ref) | 1.22 (0.95‐1.56) | 1 (Ref) | 1.09 (0.86‐1.37) | 1 (Ref) | 1.17 (0.90‐1.52) | 1 (Ref) | 1.47 (1.08‐2.01) | 1 (Ref) | 1.31 (0.99‐1.72) | 1 (Ref) | 1.16 (0.92‐1.46) | 1 (Ref) | 1.26 (1.00‐1.59) | |
| AA | Case/control | 162/162 | 69/61 | 79/87 | 155/140 | 67/48 | 166/179 | 34/31 | 201/196 | 60/59 | 175/168 | 86/106 | 149/121 | 90/95 | 134/117 |
| OR (95% CI) | 1.21 (0.94‐1.56) | 1.38 (0.96‐2.00) | 1.10 (0.77‐1.57) | 1.32 (0.99‐1.77) | 1.80 (1.16‐2.78) | 1.18 (0.87‐1.61) | 1.69 (0.96‐2.97) | 1.62 (1.14‐2.29) | 1.44 (0.93‐2.22) | 1.46 (1.06‐2.01) | 1.01 (0.72‐1.41) | 1.51 (1.13‐2.03) | 1.20 (0.85‐1.68) | 1.48 (1.09‐2.01) | |
| P interaction = 0.941 | P interaction = 0.448 | P interaction = 0.023 (0.161 b ) | P interaction = 0.243 | P interaction = 0.525 | P interaction = 0.406 | P interaction = 0.886 | |||||||||
| Interaction index = 1.02 | Interaction index = 0.83 | Interaction index = 0.54 | Interaction index = 0.68 | Interaction index = 0.84 | Interaction index = 1.22 | Interaction index = 1.04 | |||||||||
| rs61516247 | |||||||||||||||
| GG | Case/control | 258/325 | 110/111 | 140/181 | 234/255 | 88/102 | 286/335 | 50/77 | 327/363 | 73/106 | 304/334 | 154/197 | 223/243 | 148/196 | 212/220 |
| OR (95% CI) | 1 (Ref) | 1.25 (0.91‐1.70) | 1 (Ref) | 1.20 (0.90‐1.59) | 1 (Ref) | 1.01 (0.73‐1.40) | 1 (Ref) | 1.41 (0.95‐2.07) | 1 (Ref) | 1.33 (0.95‐1.87) | 1 (Ref) | 1.20 (0.91‐1.58) | 1 (Ref) | 1.29 (0.97‐1.71) | |
| GA+AA | Case/control | 294/307 | 137/130 | 154/161 | 277/278 | 113/117 | 317/322 | 62/76 | 370/362 | 101/110 | 332/330 | 170/201 | 262/237 | 163/183 | 258/238 |
| OR (95% CI) | 1.21 (0.96‐1.52) | 1.34 (1.00‐1.79) | 1.26 (0.92‐1.72) | 1.30 (0.98‐1.71) | 1.15 (0.78‐1.69) | 1.16 (0.84‐1.61) | 1.26 (0.77‐2.06) | 1.60 (1.09‐2.36) | 1.35 (0.90‐2.02) | 1.47 (1.05‐2.06) | 1.10 (0.82‐1.48) | 1.43 (1.09‐1.89) | 1.18 (0.87‐1.60) | 1.46 (1.10‐1.92) | |
| P interaction = 0.591 | P interaction = 0.382 | P interaction = 0.839 | P interaction = 0.858 | P interaction = 0.846 | P interaction = 0.428 | P interaction = 0.927 | |||||||||
| Interaction index = 0.88 | Interaction index = 0.83 | Interaction index = 0.95 | Interaction index = 0.95 | Interaction index = 1.05 | Interaction index = 1.18 | Interaction index = 0.98 | |||||||||
| GC vs. CON | |||||||||||||||
| rs7749023 | |||||||||||||||
| CC | Case/control | 25/27 | 9/19 | 9/12 | 25/34 | 12/13 | 22/33 | 13/11 | 21/35 | 5/9 | 29/37 | 13/16 | 21/30 | 19/17 | 14/28 |
| OR (95% CI) | 1 (Ref) | 0.51 (0.20‐1.34) | 1 (Ref) | 0.98 (0.36‐2.68) | 1 (Ref) | 0.72 (0.28‐1.87) | 1 (Ref) | 0.51 (0.19‐1.34) | 1 (Ref) | 1.41 (0.43‐4.67) | 1 (Ref) | 0.86 (0.34‐2.16) | 1 (Ref) | 0.45 (0.18‐1.12) | |
| AC+AA | Case/control | 360/512 | 137/181 | 173/272 | 326/422 | 128/166 | 367/528 | 79/122 | 421/575 | 128/169 | 372/529 | 201/313 | 299/384 | 181/303 | 299/363 |
| OR (95% CI) | 0.76 (0.43‐1.33) | 0.82 (0.45‐1.47) | 0.85 (0.35‐2.06) | 1.03 (0.43‐2.47) | 0.84 (0.37‐1.89) | 0.75 (0.34‐1.67) | 0.55 (0.23‐1.28) | 0.62 (0.28‐1.40) | 1.36 (0.45‐4.17) | 1.27 (0.42‐3.81) | 0.79 (0.37‐1.68) | 0.96 (0.45‐2.02) | 0.53 (0.27‐1.06) | 0.74 (0.38‐1.44) | |
| P interaction = 0.086 | P interaction = 0.912 | P interaction = 0.733 | P interaction = 0.173 | P interaction = 0.565 | P interaction = 0.488 | P interaction = 0.007 (0.049 b ) | |||||||||
| Interaction index = 2.47 | Interaction index = 1.06 | Interaction index = 1.20 | Interaction index = 2.08 | Interaction index = 0.69 | Interaction index = 1.42 | Interaction index = 3.87 | |||||||||
| rs7748341 | |||||||||||||||
| AA | Case/control | 262/403 | 96/111 | 126/204 | 234/312 | 90/118 | 266/400 | 55/95 | 305/424 | 97/135 | 263/385 | 137/230 | 222/289 | 134/236 | 211/258 |
| OR (95% CI) | 1 (Ref) | 1.33 (0.97‐1.82) | 1 (Ref) | 1.21 (0.92‐1.61) | 1 (Ref) | 0.87 (0.64‐1.20) | 1 (Ref) | 1.24 (0.86‐1.79) | 1 (Ref) | 0.95 (0.70‐1.29) | 1 (Ref) | 1.29 (0.98‐1.70) | 1 (Ref) | 1.44 (1.09‐1.91) | |
| AG+GG | Case/control | 124/136 | 50/87 | 57/81 | 117/143 | 50/60 | 124/162 | 37/38 | 138/186 | 37/43 | 138/181 | 77/98 | 98/126 | 66/85 | 103/132 |
| OR (95% CI) | 1.40 (1.05‐1.87) | 0.88 (0.60‐1.29) | 1.14 (0.76‐1.71) | 1.33 (0.95‐1.84) | 1.09 (0.69‐1.74) | 1.00 (0.70‐1.44) | 1.68 (0.96‐2.95) | 1.28 (0.86‐1.91) | 1.20 (0.72‐2.00) | 1.06 (0.75‐1.49) | 1.32 (0.92‐1.90) | 1.31 (0.93‐1.83) | 1.37 (0.93‐2.01) | 1.37 (0.98‐1.92) | |
| P interaction = 0.007 (0.049 b ) | P interaction = 0.881 | P interaction = 0.781 | P interaction = 0.118 | P interaction = 0.757 | P interaction = 0.155 | P interaction = 0.085 | |||||||||
| Interaction index = 0.48 | Interaction index = 0.96 | Interaction index = 0.92 | Interaction index = 0.60 | Interaction index = 0.91 | Interaction index = 0.69 | Interaction index = 0.64 | |||||||||
| rs7747696 | |||||||||||||||
| GG | Case/control | 28/32 | 10/23 | 11/18 | 27/37 | 14/16 | 24/39 | 14/11 | 24/44 | 6/13 | 32/42 | 15/19 | 22/36 | 21/17 | 16/37 |
| OR (95% CI) | 1 (Ref) | 0.50 (0.20‐1.22) | 1 (Ref) | 1.19 (0.49‐2.94) | 1 (Ref) | 0.70 (0.29‐1.69) | 1 (Ref) | 0.43 (0.17‐1.09) | 1 (Ref) | 1.65 (0.57‐4.82) | 1 (Ref) | 0.77 (0.33‐1.83) | 1 (Ref) | 0.35 (0.15‐0.83) | |
| AG+AA | Case/control | 357/507 | 135/179 | 171/267 | 324/422 | 125/165 | 365/524 | 78/122 | 418/570 | 128/167 | 368/526 | 198/313 | 298/379 | 177/304 | 298/357 |
| OR (95% CI) | 0.81 (0.48‐1.36) | 0.86 (0.50‐1.50) | 1.05 (0.48‐2.27) | 1.26 (0.59‐2.70) | 0.87 (0.41‐1.84) | 0.80 (0.38‐1.65) | 0.50 (0.22‐1.16) | 0.58 (0.26‐1.28) | 1.66 (0.61‐4.49) | 1.52 (0.57‐4.03) | 0.80 (0.40‐1.61) | 1.00 (0.50‐1.99) | 0.47 (0.24‐0.92) | 0.68 (0.35‐1.30) | |
| P interaction = 0.071 | P interaction = 0.845 | P interaction = 0.616 | P interaction = 0.079 | P interaction = 0.344 | P interaction = 0.294 | P interaction = 0.001 (0.007 b ) | |||||||||
| Interaction index = 2.44 | Interaction index = 0.91 | Interaction index = 1.28 | Interaction index = 2.49 | Interaction index = 0.58 | Interaction index = 1.64 | Interaction index = 4.88 | |||||||||
| rs72855279 | |||||||||||||||
| GG | Case/control | 10/9 | 5/13 | 2/6 | 13/16 | 9/5 | 6/17 | 6/4 | 9/18 | 3/5 | 12/17 | 6/9 | 9/13 | 9/8 | 6/14 |
| OR (95% CI) | 1 (Ref) | 0.35 (0.09‐1.36) | 1 (Ref) | 2.44 (0.42‐14.16) | 1 (Ref) | 0.20 (0.05‐0.82) | 1 (Ref) | 0.33 (0.08‐1.49) | 1 (Ref) | 1.18 (0.24‐5.89) | 1 (Ref) | 1.04 (0.27‐3.96) | 1 (Ref) | 0.38 (0.10‐1.47) | |
| AG+AA | Case/control | 376/529 | 141/187 | 181/279 | 339/440 | 131/176 | 384/543 | 87/127 | 434/595 | 131/174 | 390/549 | 208/322 | 312/400 | 191/311 | 308/380 |
| OR (95% CI) | 0.64 (0.26‐1.59) | 0.68 (0.27‐1.71) | 1.95 (0.39‐9.75) | 2.31 (0.46‐11.52) | 0.41 (0.14‐1.26) | 0.39 (0.13‐1.18) | 0.46 (0.13‐1.67) | 0.49 (0.14‐1.73) | 1.26 (0.30‐5.35) | 1.18 (0.28‐4.98) | 0.97 (0.34‐2.76) | 1.17 (0.41‐3.32) | 0.55 (0.21‐1.44) | 0.72 (0.28‐1.89) | |
| P interaction = 0.037 (0.259 b ) | P interaction = 0.446 | P interaction = 0.016 (0.112 b ) | P interaction = 0.121 | P interaction = 0.861 | P interaction = 0.589 | P interaction = 0.016 (0.112 b ) | |||||||||
| Interaction index = 4.65 | Interaction index = 0.49 | Interaction index = 6.34 | Interaction index = 3.50 | Interaction index = 0.86 | Interaction index = 1.47 | Interaction index = 5.70 | |||||||||
| rs80112640 | |||||||||||||||
| GG | Case/control | 10/9 | 5/13 | 2/6 | 13/16 | 9/5 | 6/17 | 6/4 | 9/18 | 3/5 | 12/17 | 6/9 | 9/13 | 9/8 | 6/14 |
| OR (95% CI) | 1 (Ref) | 0.35 (0.09‐1.36) | 1 (Ref) | 2.44 (0.42‐14.16) | 1 (Ref) | 0.20 (0.05‐0.82) | 1 (Ref) | 0.33 (0.08‐1.49) | 1 (Ref) | 1.18 (0.24‐5.89) | 1 (Ref) | 1.04 (0.27‐3.96) | 1 (Ref) | 0.38 (0.10‐1.47) | |
| AG+AA | Case/control | 374/529 | 140/189 | 181/279 | 335/443 | 131/176 | 384/546 | 86/129 | 431/595 | 128/175 | 389/550 | 208/323 | 308/402 | 191/313 | 307/379 |
| OR (95% CI) | 0.64 (0.26‐1.58) | 0.67 (0.26‐1.68) | 1.95 (0.39‐9.75) | 2.27 (0.46‐11.31) | 0.41 (0.14‐1.26) | 0.39 (0.13‐1.18) | 0.44 (0.12‐1.62) | 0.48 (0.14‐1.72) | 1.22 (0.29‐5.19) | 1.18 (0.28‐4.96) | 0.97 (0.34‐2.75) | 1.15 (0.41‐3.26) | 0.54 (0.21‐1.43) | 0.72 (0.28‐1.89) | |
| P interaction = 0.038 (0.266 b ) | P interaction = 0.434 | P interaction = 0.017 (0.119 b ) | P interaction = 0.116 | P interaction = 0.883 | P interaction = 0.604 | P interaction = 0.015 (0.105 b ) | |||||||||
| Interaction index = 4.60 | Interaction index = 0.48 | Interaction index = 6.27 | Interaction index = 3.56 | Interaction index = 0.88 | Interaction index = 1.45 | Interaction index = 5.76 | |||||||||
| rs1886753 | |||||||||||||||
| GG | Case/control | 77/119 | 34/51 | 48/69 | 65/101 | 23/45 | 87/125 | 17/34 | 96/137 | 25/42 | 88/129 | 52/69 | 61/102 | 42/74 | 64/91 |
| OR (95% CI) | 1 (Ref) | 1.03 (0.61‐1.73) | 1 (Ref) | 0.93 (0.57‐1.50) | 1 (Ref) | 1.36 (0.77‐2.41) | 1 (Ref) | 1.40 (0.74‐2.65) | 1 (Ref) | 1.15 (0.65‐2.02) | 1 (Ref) | 0.79 (0.49‐1.28) | 1 (Ref) | 1.24 (0.76‐2.03) | |
| AG+AA | Case/control | 308/420 | 112/149 | 135/216 | 286/356 | 117/135 | 302/437 | 76/99 | 346/475 | 109/138 | 313/437 | 162/262 | 259/312 | 157/246 | 250/302 |
| OR (95% CI) | 1.13 (0.82‐1.56) | 1.16 (0.80‐1.69) | 0.90 (0.59‐1.38) | 1.16 (0.77‐1.72) | 1.70 (0.97‐2.97) | 1.35 (0.80‐2.28) | 1.54 (0.80‐2.95) | 1.46 (0.80‐2.65) | 1.33 (0.76‐2.31) | 1.20 (0.72‐2.02) | 0.82 (0.55‐1.24) | 1.10 (0.74‐1.64) | 1.12 (0.73‐1.73) | 1.46 (0.96‐2.21) | |
| P interaction = 0.703 | P interaction = 0.372 | P interaction = 0.112 | P interaction = 0.168 | P interaction = 0.499 | P interaction = 0.060 | P interaction = 0.986 | |||||||||
| Interaction index = 0.89 | Interaction index = 1.30 | Interaction index = 0.59 | Interaction index = 0.59 | Interaction index = 0.80 | Interaction index = 1.72 | Interaction index = 1.00 | |||||||||
| rs61516247 | |||||||||||||||
| GA+GG | Case/control | 353/499 | 138/187 | 169/266 | 325/423 | 128/163 | 361/526 | 86/125 | 409/567 | 121/164 | 374/529 | 199/310 | 295/382 | 179/301 | 295/361 |
| OR (95% CI) | 1 (Ref) | 1.04 (0.81‐1.35) | 1 (Ref) | 1.21 (0.95‐1.54) | 1 (Ref) | 0.87 (0.67‐1.14) | 1 (Ref) | 1.05 (0.78‐1.42) | 1 (Ref) | 0.96 (0.73‐1.26) | 1 (Ref) | 1.20 (0.95‐1.52) | 1 (Ref) | 1.37 (1.08‐1.75) | |
| AA | Case/control | 33/40 | 8/15 | 14/19 | 27/36 | 12/18 | 29/37 | 7/8 | 34/47 | 13/16 | 28/39 | 15/22 | 26/33 | 21/20 | 19/33 |
| OR (95% CI) | 1.17 (0.72‐1.89) | 0.75 (0.32‐1.80) | 1.16 (0.57‐2.38) | 1.18 (0.69‐2.02) | 0.85 (0.40‐1.83) | 1.00 (0.58‐1.71) | 1.27 (0.45‐3.64) | 1.05 (0.63‐1.77) | 1.10 (0.51‐2.38) | 0.97 (0.57‐1.67) | 1.06 (0.54‐2.10) | 1.23 (0.71‐2.11) | 1.77 (0.93‐3.35) | 0.97 (0.54‐1.75) | |
| P interaction = 0.241 | P interaction = 0.666 | P interaction = 0.459 | P interaction = 0.828 | P interaction = 0.996 | P interaction = 0.874 | P interaction = 0.041 (0.287 b ) | |||||||||
| Interaction index = 0.54 | Interaction index = 0.82 | Interaction index = 1.43 | Interaction index = 0.88 | Interaction index = 1.00 | Interaction index = 0.93 | Interaction index = 0.40 | |||||||||
a P for interaction was adjusted by gender, age, and H. pylori infection status; b P values after Bonferroni correction; AG, atrophic gastritis; GC, gastric cancer; CON, control; OR, odds ratio; CI, confidence interval. The results are in bold if P for interaction < 0.05.
3.4. Epistasis and cumulative effects of the interacting SNPs on AG and GC risk
We further examined the epistasis in the pairwise interacting SNPs. The results suggested when PGC rs6912200 CC genotype was present, lnc‐C6orf‐132‐1 rs7747696 AG+GG genotype conferred to a highest 1.79‐fold increased risk among AG‐related combinations (P = 0.006, OR = 1.79). Regarding the association with GC risk, when PGC rs6939861 GA+AA genotype was present, lnc‐C6orf‐132‐1 rs7747696 AG+AA genotype could elevate the risk most remarkably (P = 0.023, OR = 2.06, Table 2).
Table 2.
The epistatic effects of the pairwise interacting SNPs on the risk of gastric diseasesa
| Pairwise interacting SNPs | Comparison | Subset | P (P corr) | OR (95% CI) |
|---|---|---|---|---|
| AG vs. CON | ||||
| PGC rs9471643 interacting with rs7749023 | rs9471643 GG+CC vs. GC | rs7749023 AA | 0.004 (0.020) | 1.51 (1.14‐1.99) |
| rs7749023 AC+CC | 0.414 | 0.87 (0.63‐1.21) | ||
| rs7749023 AC+CC vs. AA | rs9471643 GC | 0.014 (0.070) | 1.53 (1.09‐2.13) | |
| rs9471643 GG+CC | 0.506 | 0.91 (0.70‐1.19) | ||
| PGC rs9471643 interacting with rs7747696 | rs9471643 GG+CC vs. GC | rs7747696 AA | 0.003 (0.015) | 1.55 (1.16‐2.07) |
| rs7747696 AG+GG | 0.507 | 0.90 (0.66‐1.23) | ||
| rs7747696 AG+GG vs. AA | rs9471643 GC | 0.006 (0.030) | 1.59 (1.14‐2.22) | |
| rs9471643 GG+CC | 0.852 | 0.98 (0.75‐1.27) | ||
| PGC rs6912200 interacting with rs7749023 | rs6912200 CT+TT vs. CC | rs7749023 AA | 0.025 (0.125) | 1.44 (1.05‐1.99) |
| rs7749023 AC+CC | 0.200 | 0.79 (0.56‐1.13) | ||
| rs7749023 AC+CC vs. AA | rs6912200 CC | 0.008 (0.040) | 1.76 (1.16‐2.68) | |
| rs6912200 CT+TT | 0.855 | 0.98 (0.77‐1.24) | ||
| PGC rs6912200 interacting with rs7747696 | rs6912200 CT+TT vs. CC | rs7747696 AA | 0.026 (0.130) | 1.46 (1.05‐2.03) |
| rs7747696 AG+GG | 0.324 | 0.84 (0.60‐1.19) | ||
| rs7747696 AG+GG vs. AA | rs6912200 CC | 0.006 (0.030) | 1.79 (1.18‐2.71) | |
| rs6912200 CT+TT | 0.662 | 1.05 (0.83‐1.33) | ||
| PGC rs6912200 interacting with rs1886753 | rs6912200 CT+TT vs. CC | rs1886753 AG+GG | 0.083 | 1.28 (0.97‐1.68) |
| rs1886753 AA | 0.125 | 0.70 (0.44‐1.11) | ||
| rs1886753 AA vs. AG+GG | rs6912200 CC | 0.015 (0.075) | 1.78 (1.12‐2.82) | |
| rs6912200 CT+TT | 0.758 | 0.96 (0.74‐1.25) | ||
| GC vs. CON | ||||
| PGC rs6941539 interacting with rs7748341 | rs6941539 CT+TT vs. CC | rs7748341 AA | 0.091 | 1.32 (0.96‐1.83) |
| rs7748341 AG+GG | 0.037 (0.370) | 0.62 (0.40‐0.97) | ||
| rs7748341 AG+GG vs. AA | rs6941539 CC | 0.033 (0.330) | 1.39 (1.03‐1.87) | |
| rs6941539 CT+TT | 0.064 | 0.65 (0.41‐1.03) | ||
| PGC rs6941539 interacting with rs72855279 | rs6941539 CT+TT vs. CC | rs72855279 GG | 0.030 (0.300) | 0.11 (0.02‐0.81) |
| rs72855279 AG+AA | 0.608 | 1.07 (0.82‐1.40) | ||
| rs72855279 AG+AA vs. GG | rs6941539 CC | 0.171 | 0.52 (0.20‐1.33) | |
| rs6941539 CT+TT | 0.136 | 2.28 (0.77‐6.74) | ||
| PGC rs6941539 interacting with rs80112640 | rs6941539 CT+TT vs. CC | rs80112640 GG | 0.030 (0.300) | 0.11 (0.02‐0.81) |
| rs80112640 AG+AA | 0.668 | 1.06 (0.81‐1.38) | ||
| rs80112640 AG+AA vs. GG | rs6941539 CC | 0.166 | 0.52 (0.20‐1.32) | |
| rs6941539 CT+TT | 0.144 | 2.24 (0.76‐6.62) | ||
| PGC rs6912200 interacting with rs72855279 | rs6912200 CT+TT vs. CC | rs72855279 GG | 0.026 (0.260) | 0.16 (0.03‐0.81) |
| rs72855279 AG+AA | 0.859 | 0.98 (0.75‐1.28) | ||
| rs72855279 AG+AA vs. GG | rs6912200 CC | 0.095 | 0.38 (0.12‐1.18) | |
| rs6912200 CT+TT | 0.094 | 2.31 (0.87‐6.12) | ||
| PGC rs6912200 interacting with rs80112640 | rs6912200 CT+TT vs. CC | rs80112640 GG | 0.026 (0.260) | 0.16 (0.03‐0.81) |
| rs80112640 AG+AA | 0.820 | 0.97 (0.74‐1.27) | ||
| rs80112640 AG+AA vs. GG | rs6912200 CC | 0.095 | 0.38 (0.12‐1.18) | |
| rs6912200 CT+TT | 0.097 | 2.29 (0.86‐6.07) | ||
| PGC rs6939861 interacting with rs7749023 | rs6939861 GA+AA vs. GG | rs7749023 CC | 0.037 (0.370) | 0.35 (0.13‐0.94) |
| rs7749023 AC+AA | 0.004 (0.040) | 1.44 (1.12‐1.84) | ||
| rs7749023 AC+AA vs. CC | rs6939861 GG | 0.028 (0.280) | 0.45 (0.22‐0.92) | |
| rs6939861 GA+AA | 0.098 | 1.78 (0.90‐3.50) | ||
| PGC rs6939861 interacting with rs7747696 | rs6939861 GA+AA vs. GG | rs7747696 GG | 0.007 (0.070) | 0.27 (0.11‐0.71) |
| rs7747696 AG+AA | 0.002 (0.020) | 1.48 (1.16‐1.90) | ||
| rs7747696 AG+AA vs. GG | rs6939861 GG | 0.012 (0.120) | 0.42 (0.21‐0.83) | |
| rs6939861 GA+AA | 0.023 (0.230) | 2.06 (1.11‐3.85) | ||
| PGC rs6939861 interacting with rs72855279 | rs6939861 GA+AA vs. GG | rs72855279 GG | 0.069 | 0.19 (0.03‐1.14) |
| rs72855279 AG+AA | 0.011 (0.110) | 1.37 (1.08‐1.74) | ||
| rs72855279 AG+AA vs. GG | rs6939861 GG | 0.086 | 0.42 (0.15‐1.13) | |
| rs6939861 GA+AA | 0.084 | 2.41 (0.89‐6.54) | ||
| PGC rs6939861 interacting with rs80112640 | rs6939861 GA+AA vs. GG | rs80112640 GG | 0.069 | 0.19 (0.03‐1.14) |
| rs80112640 AG+AA | 0.009 (0.090) | 1.38 (1.08‐1.76) | ||
| rs80112640 AG+AA vs. GG | rs6939861 GG | 0.085 | 0.42 (0.15‐1.13) | |
| rs6939861 GA+AA | 0.083 | 2.42 (0.89‐6.58) | ||
| PGC rs6939861 interacting with rs61516247 | rs6939861 GA+AA vs. GG | rs61516247 GA+GG | 0.007 (0.070) | 1.41 (1.10‐1.81) |
| rs61516247 AA | 0.142 | 0.52 (0.22‐1.24) | ||
| rs61516247 AA vs. GA+GG | rs6939861 GG | 0.061 | 1.88 (0.97‐3.63) | |
| rs6939861 GA+AA | 0.324 | 0.74 (0.41‐1.35) | ||
a P was adjusted by gender, age, and H. pylori infection status; P corr, P values after Bonferroni correction; AG, atrophic gastritis; GC, gastric cancer; CON, control; OR, odds ratio; CI, confidence interval. The results are in bold if P < 0.05.
To further evaluate the diagnostic efficacy of these two‐way combinations, we calculated the cumulative ORs for them. The samples were divided into three subgroups according to the number of interacting SNPs that individuals carried with. Four pairwise PGC‐lncRNA SNPs showed significant dosage effects. Three of them conferred to an elevated GC risk with the increasing number of risk genotypes, including rs6939861‐rs7747696 (P trend = 0.043), rs6939861‐rs72855279 (P trend = 0.048), and rs6939861‐rs80112640 (P trend = 0.044); only rs6939861‐rs61516247 had a contrary effect on GC risk (P trend = 0.049, Table 3).
Table 3.
The cumulative effects of the pairwise interacting SNPs on the risk of gastric diseasesa
| Number of interacting SNP genotypes (PGC‐lncRNA) | Case | Control | P | OR (95% CI) |
|---|---|---|---|---|
| AG vs. CON | ||||
| rs9471643‐rs7749023 | ||||
| 0 | 159 | 217 | 1 (Ref) | |
| 1 | 439 | 428 | 0.002 | 1.52 (1.17‐1.97) |
| 2 | 203 | 224 | 0.055 | 1.33 (0.99‐1.79) |
| P trend = 0.167 | ||||
| rs9471643‐rs7747696 | ||||
| 0 | 145 | 206 | 1 (Ref) | |
| 1 | 429 | 426 | 0.001 | 1.56 (1.19‐2.04) |
| 2 | 229 | 243 | 0.014 | 1.45 (1.08‐1.95) |
| P trend = 0.067 | ||||
| rs6912200‐rs7749023 | ||||
| 0 | 101 | 131 | 1 (Ref) | |
| 1 | 461 | 478 | 0.011 | 1.50 (1.10‐2.05) |
| 2 | 239 | 261 | 0.074 | 1.35 (0.97‐1.88) |
| P trend = 0.468 | ||||
| rs6912200‐rs7747696 | ||||
| 0 | 95 | 127 | 1 (Ref) | |
| 1 | 434 | 464 | 0.010 | 1.52 (1.10‐2.10) |
| 2 | 274 | 285 | 0.024 | 1.46 (1.05‐2.04) |
| P trend = 0.182 | ||||
| rs6912200‐rs1886753 | ||||
| 0 | 134 | 170 | 1 (Ref) | |
| 1 | 500 | 524 | 0.044 | 1.32 (1.01‐1.74) |
| 2 | 166 | 179 | 0.180 | 1.26 (0.90‐1.76) |
| P trend = 0.330 | ||||
| GC vs. CON | ||||
| rs6941539‐rs7748341 | ||||
| 0 | 262 | 403 | 1 (Ref) | |
| 1 | 220 | 247 | 0.016 | 1.36 (1.06‐1.74) |
| 2 | 50 | 87 | 0.451 | 0.86 (0.58‐1.27) |
| P trend = 0.433 | ||||
| rs6941539‐rs72855279 | ||||
| 0 | 10 | 9 | 1 (Ref) | |
| 1 | 381 | 542 | 0.161 | 0.51 (0.20‐1.31) |
| 2 | 141 | 187 | 0.310 | 0.61 (0.24‐1.58) |
| P trend = 0.848 | ||||
| rs6941539‐rs80112640 | ||||
| 0 | 10 | 9 | 1 (Ref) | |
| 1 | 379 | 542 | 0.157 | 0.51 (0.20‐1.30) |
| 2 | 140 | 189 | 0.293 | 0.60 (0.23‐1.55) |
| P trend = 0.924 | ||||
| rs6912200‐rs72855279 | ||||
| 0 | 9 | 5 | 1 (Ref) | |
| 1 | 137 | 193 | 0.079 | 0.36 (0.12‐1.13) |
| 2 | 384 | 543 | 0.062 | 0.34 (0.11‐1.05) |
| P trend = 0.493 | ||||
| rs6912200‐rs80112640 | ||||
| 0 | 9 | 5 | 1 (Ref) | |
| 1 | 137 | 193 | 0.079 | 0.36 (0.12‐1.13) |
| 2 | 384 | 546 | 0.061 | 0.34 (0.11‐1.05) |
| P trend = 0.467 | ||||
| rs6939861‐rs7749023 | ||||
| 0 | 19 | 17 | 1 (Ref) | |
| 1 | 195 | 331 | 0.024 | 0.45 (0.22‐0.90) |
| 2 | 299 | 363 | 0.245 | 0.66 (0.33‐1.32) |
| P trend = 0.066 | ||||
| rs6939861‐rs7747696 | ||||
| 0 | 21 | 17 | 1 (Ref) | |
| 1 | 193 | 341 | 0.009 | 0.40 (0.20‐0.80) |
| 2 | 298 | 357 | 0.180 | 0.63 (0.32‐1.24) |
| P trend = 0.043 (0.430 b ) | ||||
| rs6939861‐rs72855279 | ||||
| 0 | 9 | 8 | 1 (Ref) | |
| 1 | 197 | 325 | 0.078 | 0.41 (0.15‐1.11) |
| 2 | 308 | 380 | 0.291 | 0.59 (0.22‐1.57) |
| P trend = 0.048 (0.480 b ) | ||||
| rs6939861‐rs80112640 | ||||
| 0 | 9 | 8 | 1 (Ref) | |
| 1 | 197 | 327 | 0.077 | 0.41 (0.15‐1.10) |
| 2 | 307 | 379 | 0.287 | 0.59 (0.22‐1.57) |
| P trend = 0.044 (0.440 b ) | ||||
| rs6939861‐rs61516247 | ||||
| 0 | 179 | 301 | 1 (Ref) | |
| 1 | 316 | 381 | 0.004 | 1.43 (1.12‐1.83) |
| 2 | 19 | 33 | 0.880 | 1.05 (0.57‐1.93) |
| P trend = 0.049 (0.490 b ) | ||||
a P was adjusted by gender, age, and H. pylori infection status; b P values after Bonferroni correction; AG, atrophic gastritis; GC, gastric cancer; CON, control; OR, odds ratio; CI, confidence interval. The results are in bold if P for trend < 0.05.
3.5. Interactions of three dimensions among the SNPs and environmental factors
We next investigated the interaction effects of three dimensions among the interacting PGC‐lncRNA SNPs and environmental factors, including H. pylori infection, smoking, and drinking. For AG risk, two combinations demonstrated positive interactions with smoking, which were rs9471643‐rs7749023 (P interaction = 0.045, interaction index = 3.19) and rs9471643‐rs7747696 (P interaction = 0.020, interaction index = 3.81, Table S3). Negative interaction was found between rs6941539‐rs7738341 and drinking on GC risk (P interaction = 0.049, interaction index = 0.17, Table S4). However, no significance was observed in any three‐way combination of PGC SNP‐lncRNA SNP‐H. pylori on diseases risk (P interaction > 0.05, Table S5).
The cumulative ORs of the three‐way interacting combinations for disease risk were also calculated. No significant dosage effect was indicated in them (Table S6).
3.6. Correlations of the interacting SNPs with PGC protein expression levels
To explore the possible mechanism in the SNP interactions of PGC with its neighbor lncRNAs, we analyzed the influence of the interacting SNPs on PGC protein expression in serum. Among AG‐related combinations, PGC rs6912200 CT+TT genotype showed significant lower PGII concentration than CC genotype in both total subjects and controls when lnc‐C6orf132‐1 rs7749023 and rs7747696 had AA genotype (rs6912200‐rs7749023 in total: P = 0.027; rs6912200‐rs7749023 in control: P = 0.013; rs6912200‐rs7747696 in total: P = 0.021; and rs6912200‐rs7747696 in control: P = 0.014, Table 4).
Table 4.
The correlations between the pairwise interacting SNPs and PGC protein expression levels in serum
| PGC‐lncRNA SNP genotypes | Total | Case | Control | |||||||
|---|---|---|---|---|---|---|---|---|---|---|
| N | Median (25%, 75%) | P (P corr) | N | Median (25%, 75%) | P | N | Median (25%, 75%) | P (P corr) | ||
| AG vs. CON | ||||||||||
| rs9471643‐rs7749023 | ||||||||||
| GC | AA | 375 | 8.8 (5.7, 15.5) | 158 | 12.3 (6.6, 19.3) | 217 | 8.2 (5.3, 12.2) | |||
| GC | AC+CC | 257 | 9.3 (6.0, 16.3) | 0.504 | 133 | 10.5 (6.9, 18.4) | 0.918 | 124 | 8.5 (5.4, 14.1) | 0.758 |
| GG+CC | AA | 602 | 8.8 (6.1, 15.2) | 0.806 | 302 | 11.8 (6.7, 19.2) | 0.756 | 300 | 7.7 (5.6, 10.8) | 0.129 |
| GG+CC | AC+CC | 426 | 9.2 (5.7, 17.5) | 0.259 | 203 | 12.9 (7.3, 21.3) | 0.084 | 223 | 7.3 (4.8, 11.7) | 0.451 |
| rs9471643‐rs7747696 | ||||||||||
| GC | AA | 350 | 8.8 (5.7, 15.3) | 144 | 12.2 (6.5, 19.4) | 206 | 8.2 (5.5, 12.3) | |||
| GC | AG+GG | 283 | 9.3 (6.1, 16.3) | 0.724 | 147 | 11.2 (6.9, 18.5) | 0.904 | 136 | 8.2 (5.3, 12.9) | 0.811 |
| GG+CC | AA | 566 | 8.7 (6.1, 14.8) | 0.663 | 279 | 11.4 (6.6, 18.3) | 0.814 | 287 | 7.7 (5.6, 10.8) | 0.099 |
| GG+CC | AG+GG | 470 | 9.4 (5.7, 17.5) | 0.326 | 229 | 13.1 (7.4, 21.2) | 0.120 | 241 | 7.3 (4.9, 11.8) | 0.352 |
| rs6912200‐rs7749023 | ||||||||||
| CC | AA | 231 | 9.5 (6.0, 15.8) | 100 | 13.1 (7.2, 19.9) | 131 | 8.6 (5.7, 13.3) | |||
| CC | AC+CC | 182 | 10.4 (6.2, 18.1) | 0.952 | 97 | 11.8 (8.5, 21.3) | 0.634 | 85 | 7.9 (5.2, 12.0) | 0.239 |
| CT+TT | AA | 749 | 8.7 (6.1, 15.0) | 0.027 (0.135) | 360 | 11.6 (6.6, 19.0) | 0.267 | 389 | 7.7 (5.5, 10.6) | 0.013 (0.065) |
| CT+TT | AC+CC | 499 | 9.1 (5.7, 16.5) | 0.431 | 239 | 12.1 (6.7, 20.3) | 0.941 | 260 | 7.5 (5.1, 12.4) | 0.144 |
| rs6912200‐rs7747696 | ||||||||||
| CC | AA | 221 | 10.0 (6.0, 16.0) | 94 | 13.1 (7.2, 19.8) | 127 | 8.6 (5.7, 13.3) | |||
| CC | AG+GG | 196 | 10.4 (6.3, 18.1) | 0.859 | 104 | 11.7 (8.2, 21.1) | 0.773 | 92 | 8.0 (5.1, 12.4) | 0.256 |
| CT+TT | AA | 696 | 8.6 (6.0, 14.6) | 0.021 (0.105) | 327 | 11.2 (6.6, 18.5) | 0.231 | 369 | 7.7 (5.6, 10.6) | 0.014 (0.070) |
| CT+TT | AG+GG | 557 | 9.2 (5.7, 16.9) | 0.307 | 274 | 12.6 (6.8, 20.4) | 0.840 | 283 | 7.4 (5.1, 12.3) | 0.065 |
| rs6912200‐rs1886753 | ||||||||||
| CC | AG+GG | 301 | 9.4 (6.0, 15.5) | 131 | 12.0 (8.0, 19.9) | 170 | 8.0 (5.4, 12.4) | |||
| CC | AA | 115 | 11.1 (6.6, 19.2) | 0.330 | 67 | 13.1 (7.0, 21.3) | 0.947 | 48 | 8.8 (5.5, 16.7) | 0.476 |
| CT+TT | AG+GG | 903 | 9.1 (5.9, 15.3) | 0.119 | 431 | 11.8 (6.7, 18.5) | 0.226 | 472 | 7.8 (5.6, 11.8) | 0.220 |
| CT+TT | AA | 344 | 8.6 (5.6, 16.0) | 0.232 | 166 | 12.4 (6.6, 22.9) | 0.703 | 178 | 7.2 (5.1, 9.5) | 0.064 |
| GC vs. CON | ||||||||||
| rs6941539‐rs7748341 | ||||||||||
| CC | AA | 527 | 8.5 (6.3, 14.2) | 126 | 13.5 (8.0, 21.5) | 401 | 8.1 (5.8, 11.9) | |||
| CC | AG+GG | 187 | 9.2 (5.7, 16.9) | 0.508 | 52 | 16.9 (7.1, 25.2) | 0.714 | 135 | 7.7 (5.7, 12.7) | 0.868 |
| CT+TT | AA | 153 | 8.8 (5.7, 14.4) | 0.714 | 43 | 14.5 (6.5, 29.4) | 0.481 | 110 | 8.2 (5.7, 12.0) | 0.453 |
| CT+TT | AG+GG | 107 | 8.1 (5.4, 14.2) | 0.405 | 20 | 8.8 (6.0, 13.5) | 0.134 | 87 | 8.0 (5.2, 14.3) | 0.594 |
| rs6941539‐rs72855279 | ||||||||||
| CC | GG | 13 | 9.0 (4.5, 19.3) | 4 | 13.5 (3.2, 52.7) | 9 | 9.0 (5.7, 13.4) | |||
| CC | AG+AA | 700 | 8.6 (6.2, 15.1) | 0.555 | 174 | 13.8 (8.0, 22.3) | 0.584 | 526 | 8.0 (5.7, 11.9) | 0.954 |
| CT+TT | GG | 14 | 5.6 (5.1, 10.6) | 0.209 | 1 | NA | NA | 13 | 5.8 (4.9, 12.0) | 0.434 |
| CT+TT | AG+AA | 248 | 8.7 (5.8, 14.2) | 0.508 | 62 | 12.0 (6.4, 24.1) | 0.560 | 186 | 8.2 (5.7, 12.5) | 0.926 |
| rs6941539‐rs80112640 | ||||||||||
| CC | GG | 13 | 9.0 (4.5, 19.3) | 4 | 13.5 (3.2, 52.7) | 9 | 9.0 (5.7, 13.4) | |||
| CC | AG+AA | 700 | 8.6 (6.2, 15.1) | 0.557 | 174 | 13.8 (8.0, 22.3) | 0.584 | 526 | 8.0 (5.7, 11.9) | 0.957 |
| CT+TT | GG | 14 | 5.6 (5.1, 10.6) | 0.209 | 1 | NA | NA | 13 | 5.8 (4.9, 12.0) | 0.434 |
| CT+TT | AG+AA | 250 | 8.7 (5.8, 14.2) | 0.500 | 62 | 12.0 (6.4, 24.1) | 0.560 | 188 | 8.2 (5.6, 12.5) | 0.919 |
| rs6912200‐rs72855279 | ||||||||||
| CC | GG | 7 | 5.4 (4.7, 10.4) | 2 | 3.7 (2.7, NA) | 5 | 5.8 (5.4, 12.6) | |||
| CC | AG+AA | 230 | 9.1 (6.1, 15.0) | 0.164 | 54 | 11.4 (7.6, 24.4) | 0.122 | 176 | 8.7 (5.8, 13.8) | 0.446 |
| CT+TT | GG | 20 | 8.1 (4.8, 17.4) | 0.287 | 3 | 22.2 (5.4, NA) | 0.316 | 17 | 8.0 (4.4, 12.9) | 0.674 |
| CT+TT | AG+AA | 724 | 8.5 (5.9, 14.9) | 0.242 | 185 | 13.9 (7.4, 22.0) | 0.232 | 539 | 7.8 (5.7, 11.7) | 0.628 |
| rs6912200‐rs80112640 | ||||||||||
| CC | GG | 7 | 5.4 (4.7, 10.4) | 7 | 3.7 (2.7, NA) | 5 | 5.8 (5.4, 12.6) | |||
| CC | AG+AA | 230 | 9.1 (6.1, 15.0) | 0.164 | 77 | 11.4 (7.6, 24.4) | 0.122 | 176 | 8.7 (5.8, 13.8) | 0.446 |
| CT+TT | GG | 20 | 8.1 (4.8, 17.4) | 0.287 | 3 | 22.2 (5.4, NA) | 0.316 | 17 | 8.0 (4.4, 12.9) | 0.674 |
| CT+TT | AG+AA | 727 | 8.5 (5.9, 14.7) | 0.242 | 199 | 13.9 (7.4, 22.0) | 0.232 | 542 | 7.8 (5.7, 11.7) | 0.628 |
| rs6939861‐rs7749023 | ||||||||||
| GG | CC | 23 | 8.4 (5.9, 14.1) | 6 | 5.6 (2.8, 74.6) | 17 | 9.0 (6.8, 13.2) | |||
| GG | AC+AA | 386 | 8.3 (5.9, 15.1) | 0.308 | 84 | 14.6 (7.1, 22.7) | 0.499 | 302 | 8.0 (5.7, 11.9) | 0.246 |
| GA+AA | CC | 32 | 6.7 (4.9, 14.1) | 0.145 | 4 | 10.7 (6.1, 20.0) | 0.347 | 28 | 6.2 (4.8, 13.5) | 0.222 |
| GA+AA | AC+AA | 496 | 8.7 (6.1, 15.0) | 0.341 | 135 | 13.3 (7.8, 22.9) | 0.493 | 361 | 8.1 (5.7, 12.2) | 0.276 |
| rs6939861‐rs7747696 | ||||||||||
| GG | GG | 24 | 8.7 (6.0, 14.0) | 7 | 6.4 (2.8, 62.9) | 17 | 9.0 (6.8, 13.2) | |||
| GG | AG+AA | 386 | 8.3 (5.8, 15.1) | 0.301 | 83 | 14.9 (7.1, 23.0) | 0.520 | 303 | 7.9 (5.7, 11.9) | 0.242 |
| GA+AA | GG | 42 | 6.7 (4.8, 13.0) | 0.114 | 5 | 13.1 (6.7, 17.8) | 0.338 | 37 | 6.1 (4.7, 10.1) | 0.114 |
| GA+AA | AG+AA | 490 | 8.8 (6.2, 15.1) | 0.345 | 135 | 13.3 (7.8, 22.9) | 0.510 | 355 | 8.2 (5.7, 12.3) | 0.295 |
| rs6939861‐rs72855279 | ||||||||||
| GG | GG | 11 | 7.2 (5.4, 9.4) | 3 | 4.7 (2.7, NA) | 8 | 7.6 (5.6, 9.3) | |||
| GG | AG+AA | 397 | 8.3 (5.9, 15.1) | 0.865 | 87 | 14.2 (7.1, 23.0) | 0.689 | 310 | 8.0 (5.7, 12.1) | 0.334 |
| GA+AA | GG | 16 | 7.0 (4.3, 17.4) | 0.848 | 2 | 13.8 (5.4, NA) | 0.738 | 14 | 7.0 (4.1, 16.8) | 0.218 |
| GA+AA | AG+AA | 516 | 8.7 (6.1, 14.3) | 0.877 | 138 | 13.2 (7.9, 22.3) | 0.802 | 378 | 8.1 (5.7, 12.0) | 0.368 |
| rs6939861‐rs80112640 | ||||||||||
| GG | GG | 11 | 7.2 (5.4, 9.4) | 3 | 4.7 (2.7, NA) | 8 | 7.6 (5.6, 9.3) | |||
| GG | AG+AA | 399 | 8.3 (5.9, 15.1) | 0.869 | 87 | 14.2 (7.1, 23.0) | 0.689 | 312 | 8.0 (5.7, 12.1) | 0.335 |
| GA+AA | GG | 16 | 7.0 (4.3, 17.4) | 0.848 | 2 | 13.8 (5.4, NA) | 0.738 | 14 | 7.0 (4.1, 16.8) | 0.218 |
| GA+AA | AG+AA | 515 | 8.7 (6.1, 14.3) | 0.874 | 138 | 13.2 (7.9, 22.3) | 0.802 | 377 | 8.1 (5.7, 12.0) | 0.367 |
| rs6939861‐rs61516247 | ||||||||||
| GG | GA+GG | 384 | 8.2 (5.9, 15.1) | 84 | 14.0 (6.3, 22.7) | 300 | 8.0 (5.8, 11.9) | |||
| GG | AA | 26 | 8.6 (5.2, 16.3) | 0.612 | 6 | 14.3 (9.3, 25.7) | 0.801 | 20 | 7.6 (4.9, 12.1) | 0.500 |
| GA+AA | GA+GG | 494 | 8.7 (6.1, 14.7) | 0.991 | 135 | 13.5 (7.8, 22.2) | 0.610 | 359 | 8.1 (5.7, 11.9) | 0.812 |
| GA+AA | AA | 38 | 9.3 (5.4, 13.8) | 0.791 | 5 | 11.3 (8.1, 18.0) | 0.471 | 33 | 8.7 (4.6, 14.2) | 0.466 |
P corr, P values after Bonferroni correction; AG, atrophic gastritis; GC, gastric cancer; CON, control; NA, not available. The results are in bold if P < 0.05.
3.7. Correlations of the single/interacting SNPs with lncRNA expression levels
The association between single lncRNA SNPs and expression of the three involved lncRNAs had not been clarified before, and thus, we investigated their expression levels in four genetic models of each SNP. Only rs7749023 was found to be associated with lncRNA expression. Its AC+AA genotype had a significantly higher level of lnc‐C6orf132‐1 when compared with CC genotype (P < 0.001, Table S7).
We next explored the influence of the interacting SNPs on lncRNA expression in different disease groups. The levels of lnc‐C6orf132‐1 and lnc‐LRFN‐2 were correlated with several GC‐related combinations. Notably, the AC+AA genotype of rs7749023 showed a higher level of lnc‐C6orf132‐1 in total subjects only in the presence of rs6939861 GA+AA genotype (P < 0.001), while no difference was observed when rs6939861 had GG genotype. When the GA+GG genotype of rs61516247 was present, the expression level of lnc‐LRFN‐2 in total subjects was higher in PGC rs6939861 GA+AA genotype than GG genotype (P = 0.042, Table 5).
Table 5.
The correlations between the pairwise interacting SNPs and the expression levels of lncRNAs in serum
| PGC‐lncRNA SNP genotypes | Total | Case | Control | |||||||
|---|---|---|---|---|---|---|---|---|---|---|
| Median (25%, 75%) | P (P corr) | Median (25%, 75%) | P (P corr) | Median (25%, 75%) | P (P corr) | |||||
| ΔCt | 2−ΔCt | ΔCt | 2−ΔCt | ΔCt | 2−ΔCt | |||||
| AG vs. CON | ||||||||||
| lnc‐C6orf132‐1 | ||||||||||
| rs9471643‐rs7749023 | ||||||||||
| GC | AA | 4.06 (3.26, 4.78) | 0.06 (0.04, 0.10) | 4.23 (2.63, 5.88) | 0.05 (0.02, 0.16) | 3.36 (3.26, 4.11) | 0.10 (0.06, 0.10) | |||
| GC | AC+CC | 4.86 (2.45, 5.16) | 0.03 (0.03, 0.18) | 0.546 | 4.86 (2.45, 5.16) | 0.03 (0.03, 0.18) | 0.649 | NA | NA | 0.726 |
| GG+CC | AA | 4.84 (3.22, 5.37) | 0.03 (0.02, 0.11) | 0.952 | 4.90 (3.56, 5.62) | 0.03 (0.02, 0.09) | 0.895 | 2.89 (2.65, 3.98) | 0.14 (0.07, 0.16) | 0.203 |
| GG+CC | AC+CC | 4.79 (3.73, 5.50) | 0.04 (0.02, 0.08) | 0.143 | 5.14 (4.15, 5.65) | 0.03 (0.02, 0.06) | 0.174 | 2.72 (2.11, NA) | 0.15 (0.08, NA) | 0.082 |
| rs9471643‐rs7747696 | ||||||||||
| GC | AA | 4.06 (3.25, 5.04) | 0.06 (0.03, 0.11) | 4.23 (2.63, 5.88) | 0.05 (0.02, 0.16) | 3.36 (3.16, 4.16) | 0.10 (0.06, 0.11) | |||
| GC | AG+GG | 4.25 (2.47, 5.09) | 0.06 (0.03, 0.18) | 0.496 | 4.86 (2.45, 5.16) | 0.03 (0.03, 0.18) | 0.649 | 3.48 (3.31, NA) | 0.09 (0.08, NA) | 0.991 |
| GG+CC | AA | 4.84 (3.25, 5.48) | 0.03 (0.02, 0.11) | 0.977 | 4.95 (3.42, 5.79) | 0.03 (0.02, 0.09) | 0.937 | 2.68 (2.64, NA) | 0.16 (0.05, NA) | 0.318 |
| GG+CC | AG+GG | 4.78 (3.71, 5.35) | 0.04 (0.02, 0.08) | 0.167 | 4.99 (4.06, 5.59) | 0.03 (0.02, 0.06) | 0.184 | 2.91 (2.26, 3.57) | 0.13 (0.09, 0.21) | 0.121 |
| rs6912200‐rs7749023 | ||||||||||
| CC | AA | 4.26 (3.04, 5.04) | 0.05 (0.03, 0.12) | 4.95 (2.48, 5.55) | 0.03 (0.02, 0.18) | 3.36 (2.99, 4.20) | 0.10 (0.05, 0.13) | |||
| CC | AC+CC | 4.65 (4.19, 5.36) | 0.04 (0.02, 0.05) | 0.410 | 5.04 (4.19, 5.63) | 0.03 (0.02, 0.05) | 0.162 | NA | NA | NA |
| CT+TT | AA | 4.47 (3.26, 5.37) | 0.05 (0.02, 0.10) | 0.359 | 4.85 (3.35, 5.87) | 0.03 (0.02, 0.10) | 0.323 | 3.31 (2.67, 3.80) | 0.10 (0.07, 0.16) | 0.510 |
| CT+TT | AC+CC | 4.82 (3.28, 5.40) | 0.04 (0.02, 0.10) | 0.354 | 5.03 (3.56, 5.50) | 0.03 (0.02, 0.09) | 0.341 | 3.02 (2.26, 3.63) | 0.13 (0.08, 0.21) | 0.219 |
| rs6912200‐rs7747696 | ||||||||||
| CC | AA | 4.29 (2.88, 5.00) | 0.05 (0.03, 0.14) | 4.91 (2.42, 5.72) | 0.03 (0.02, 0.19) | 3.74 (3.00, 4.25) | 0.08 (0.05, 0.13) | |||
| CC | AG+GG | 4.65 (4.15, 5.30) | 0.04 (0.03, 0.06) | 0.366 | 5.29 (4.21, 5.55) | 0.03 (0.02, 0.05) | 0.148 | NA | NA | 0.522 |
| CT+TT | AA | 4.65 (3.25, 5.46) | 0.04 (0.02, 0.10) | 0.298 | 5.09 (3.33, 5.88) | 0.03 (0.02, 0.10) | 0.282 | 3.26 (2.66, 3.81) | 0.10 (0.07, 0.16) | 0.350 |
| CT+TT | AG+GG | 4.78 (3.37, 5.31) | 0.04 (0.03, 0.10) | 0.298 | 4.88 (3.58, 5.36) | 0.03 (0.02, 0.08) | 0.313 | 3.31 (2.42, 3.69) | 0.10 (0.08, 0.19) | 0.294 |
| lnc‐LRFN2‐1 | ||||||||||
| rs6912200‐rs1886753 | ||||||||||
| CC | AG+GG | 3.55 (2.70, 4.58) | 0.09 (0.04, 0.15) | 3.92 (3.39, 4.34) | 0.07 (0.05, 0.10) | 2.49 (2.36, NA) | 0.18 (0.15, NA) | |||
| CC | AA | 3.94 (3.03, 4.63) | 0.07 (0.04, 0.13) | 0.509 | 4.11 (3.21, 4.63) | 0.06 (0.04, 0.12) | 0.957 | 3.35 (2.75, NA) | 0.11 (0.07, NA) | 0.333 |
| CT+TT | AG+GG | 3.29 (2.58, 4.15) | 0.10 (0.06, 0.17) | 0.431 | 3.46 (2.73, 4.39) | 0.09 (0.05, 0.15) | 0.229 | 2.37 (2.23, 3.13) | 0.19 (0.11, 0.21) | 0.559 |
| CT+TT | AA | 3.76 (2.86, 4.20) | 0.07 (0.05, 0.14) | 0.149 | 3.91 (3.04, 4.45) | 0.07 (0.05, 0.12) | 0.489 | 2.90 (−1.36, NA) | 0.13 (0.08, NA) | 0.456 |
| GC vs. CON | ||||||||||
| lnc‐C6orf132‐1 | ||||||||||
| rs6941539‐rs7748341 | ||||||||||
| CC | AA | 4.61 (3.28, 5.09) | 0.04 (0.03, 0.10) | 4.89 (3.82, 5.37) | 0.03 (0.02, 0.07) | 3.34 (2.83, 3.76) | 0.10 (0.07, 0.14) | |||
| CC | AG+GG | 5.08 (3.10, 5.73) | 0.03 (0.02, 0.12) | 0.655 | 5.35 (2.95, 5.75) | 0.02 (0.02, 0.13) | 0.093 | NA | NA | 0.010 (0.100) |
| CT+TT | AA | 4.24 (3.18, 5.42) | 0.05 (0.02, 0.11) | 0.729 | 3.86 (3.18, 5.54) | 0.07 (0.02, 0.11) | 0.505 | 3.69 (3.09, NA) | 0.08 (0.05, NA) | 0.379 |
| CT+TT | AG+GG | 4.79 (4.21, 5.29) | 0.04 (0.03, 0.05) | 0.227 | 5.19 (4.79, 5.55) | 0.03 (0.02, 0.04) | 0.466 | 3.23 (2.72, NA) | 0.11 (0.08, NA) | 0.904 |
| rs6941539‐rs72855279 | ||||||||||
| CC | GG | NA | NA | NA | NA | NA | NA | |||
| CC | AG+AA | 4.67 (3.27, 5.35) | 0.04 (0.02, 0.10) | 0.686 | 4.90 (3.58, 5.64) | 0.03 (0.02, 0.08) | 0.718 | 3.31 (2.68, 3.64) | 0.10 (0.08, 0.16) | NA |
| CT+TT | GG | NA | NA | NA | NA | NA | NA | NA | NA | NA |
| CT+TT | AG+AA | 4.38 (3.42, 5.36) | 0.05 (0.02, 0.09) | 0.722 | 4.98 (3.53, 5.54) | 0.03 (0.02, 0.09) | 0.614 | 3.41 (2.81, 4.15) | 0.10 (0.06, 0.14) | NA |
| rs6941539‐rs80112640 | ||||||||||
| CC | GG | 5.01 (4.51, NA) | 0.03 (0.02, NA) | NA | NA | NA | NA | |||
| CC | AG+AA | 4.65 (3.27, 5.32) | 0.04 (0.03, 0.10) | 0.442 | 4.89 (3.56, 5.68) | 0.03 (0.02, 0.09) | 0.718 | 3.31 (2.68, 3.64) | 0.10 (0.08, 0.16) | NA |
| CT+TT | GG | NA | NA | 0.873 | NA | NA | NA | NA | NA | NA |
| CT+TT | AG+AA | 4.38 (3.42, 5.36) | 0.05 (0.02, 0.09) | 0.424 | 4.98 (3.53, 5.54) | 0.03 (0.02, 0.09) | 0.614 | 3.41 (2.81, 4.15) | 0.10 (0.06, 0.14) | NA |
| rs6912200‐rs72855279 | ||||||||||
| CC | GG | NA | NA | NA | NA | NA | NA | |||
| CC | AG+AA | 4.38 (3.36, 5.17) | 0.05 (0.03, 0.10) | 0.711 | 4.95 (4.04, 5.49) | 0.06 (0.05, 0.09) | 0.732 | 3.36 (2.99, 4.20) | 0.15 (0.11, 0.19) | NA |
| CT+TT | GG | NA | NA | NA | NA | NA | NA | NA | NA | NA |
| CT+TT | AG+AA | 4.74 (3.26, 5.37) | 0.04 (0.02, 0.10) | 0.682 | 4.88 (3.51, 5.58) | 0.07 (0.05, 0.14) | 0.787 | 3.29 (2.67, 3.66) | 0.18 (0.11, 0.80) | NA |
| rs6912200‐rs80112640 | ||||||||||
| CC | GG | NA | NA | NA | NA | NA | NA | |||
| CC | AG+AA | 4.38 (3.36, 5.17) | 0.05 (0.03, 0.10) | 0.711 | 4.95 (4.04, 5.49) | 0.03 (0.02, 0.06) | 0.732 | 3.36 (2.99, 4.20) | 0.10 (0.05, 0.13) | NA |
| CT+TT | GG | 5.13 (4.77, NA) | 0.03 (0.02, NA) | 0.460 | NA | NA | NA | NA | NA | NA |
| CT+TT | AG+AA | 4.69 (3.26, 5.36) | 0.04 (0.02, 0.10) | 0.673 | 4.86 (3.45, 5.61) | 0.03 (0.02, 0.09) | 0.787 | 3.29 (2.67, 3.66) | 0.10 (0.08, 0.16) | NA |
| rs6939861‐rs7749023 | ||||||||||
| GG | CC | 5.28 (4.82, 5.79) | 0.03 (0.02, 0.04) | 5.71 (5.55, NA) | 0.02 (0.02, NA) | NA | NA | |||
| GG | AC+AA | 4.29 (3.34, 5.25) | 0.05 (0.03, 0.10) | 0.286 | 4.91 (2.95, 5.68) | 0.03 (0.02, 0.13) | 0.668 | 3.64 (3.31, 4.27) | 0.08 (0.05, 0.10) | NA |
| GA+AA | CC | 5.32 (4.71, 5.46) | 0.03 (0.02, 0.04) | 0.739 | 5.35 (5.29, NA) | 0.02 (0.02, NA) | 0.285 | NA | NA | NA |
| GA+AA | AC+AA | 4.38 (3.22, 5.14) | 0.05 (0.03, 0.11) | <0.001 (<0.001) | 4.82 (3.51, 5.45) | 0.04 (0.02, 0.09) | 0.412 | 2.91 (2.65, 3.33) | 0.13 (0.10, 0.16) | NA |
| rs6939861‐rs7747696 | ||||||||||
| GG | GG | 5.28 (4.82, 5.79) | 0.03 (0.02, 0.04) | 5.71 (5.55, NA) | 0.02 (0.02, NA) | NA | NA | |||
| GG | AG+AA | 4.54 (3.33, 5.27) | 0.04 (0.03, 0.10) | 0.287 | 4.91 (2.95, 5.68) | 0.03 (0.02, 0.13) | 0.621 | 3.64 (3.31, 4.27) | 0.08 (0.05, 0.10) | NA |
| GA+AA | GG | 5.29 (4.51, NA) | 0.03 (0.02, NA) | 0.562 | 5.32 (5.29, NA) | 0.03 (0.02, NA) | 0.285 | NA | NA | NA |
| GA+AA | AG+AA | 4.42 (3.23, 5.17) | 0.05 (0.03, 0.11) | <0.001 (<0.001) | 4.85 (3.56, 5.50) | 0.03 (0.02, 0.09) | 0.412 | 2.91 (2.65, 3.33) | 0.13 (0.10, 0.16) | NA |
| rs6939861‐rs72855279 | ||||||||||
| GG | GG | NA | NA | NA | NA | NA | NA | |||
| GG | AG+AA | 4.81 (3.43, 5.35) | 0.04 (0.02, 0.09) | 0.700 | 5.09 (3.48, 5.72) | 0.03 (0.02, 0.10) | 0.994 | 3.64 (3.31, 4.27) | 0.08 (0.05, 0.10) | NA |
| GA+AA | GG | NA | NA | NA | NA | NA | NA | NA | NA | NA |
| GA+AA | AG+AA | 4.52 (3.24, 5.31) | 0.04 (0.03, 0.11) | 0.569 | 4.86 (3.59, 5.46) | 0.03 (0.02, 0.08) | 0.581 | 2.91 (2.65, 3.33) | 0.13 (0.10, 0.16) | NA |
| rs6939861‐rs80112640 | ||||||||||
| GG | GG | NA | NA | NA | NA | NA | NA | |||
| GG | AG+AA | 4.81 (3.43, 5.35) | 0.04 (0.02, 0.09) | 0.700 | 5.09 (3.48, 5.72) | 0.03 (0.02, 0.10) | 0.994 | 3.64 (3.31, 4.27) | 0.08 (0.05, 0.10) | NA |
| GA+AA | GG | 5.01 (4.51, NA) | 0.03 (0.02, NA) | 0.873 | NA | NA | NA | NA | NA | NA |
| GA+AA | AG+AA | 4.47 (3.23, 5.23) | 0.05 (0.03, 0.11) | 0.561 | 4.85 (3.58, 5.41) | 0.03 (0.02, 0.08) | 0.581 | 2.91 (2.65, 3.33) | 0.13 (0.10, 0.16) | NA |
| lnc‐LRFN2‐2 | ||||||||||
| rs6939861‐rs61516247 | ||||||||||
| GG | GA+GG | 4.70 (3.69, 5.40) | 0.04 (0.02, 0.08) | 5.01 (3.07, 5.43) | 0.03 (0.02, 0.12) | 4.11 (3.50, 4.72) | 0.06 (0.04, 0.09) | |||
| GG | AA | 4.91 (4.17, 5.49) | 0.03 (0.02, 0.06) | 0.462 | 4.91 (4.83, NA) | 0.03 (0.03, NA) | 0.554 | NA | NA | 0.963 |
| GA+AA | GA+GG | 4.01 (3.29, 5.38) | 0.06 (0.02, 0.10) | 0.042 (0.420) | 4.12 (2.95, 5.39) | 0.06 (0.02, 0.13) | 0.394 | 3.67 (3.39, 3.87) | 0.08 (0.07, 0.10) | 0.376 |
| GA+AA | AA | 4.39 (3.72, 5.00) | 0.05 (0.03, 0.08) | 0.852 | 4.68 (3.94, 5.01) | 0.04 (0.03, 0.07) | 0.034 (0.340) | NA | NA | NA |
P corr, P values after Bonferroni correction; AG, atrophic gastritis; GC, gastric cancer; CON, control; NA, not available. The results are in bold if P < 0.05.
4. DISCUSSION
In the present study, we newly found SNP interactions between PGC and its neighbor lncRNAs could enhance the susceptibility to GC/AG. Among the 15 pairwise interacting PGC‐lncRNA SNPs, five pairs were associated with AG risk and ten pairs were associated with GC risk. Furthermore, several combinations showed obvious epistasis and cumulative effects on disease risk. Based on these results, three‐way interactions were discovered when environmental factors were taken into account. We also found the interacting SNPs could affect the expression of PGC protein and involved lncRNAs. To our knowledge, this is the first time to report SNP interactions uniting protein‐coding genes and neighbor noncoding genes for the risk of gastric diseases.
As is known to all, human body is a complex organism with tens of thousands of genes, comprising encoding and noncoding genes. Each of them exerts different function and cooperates with each other to ensure coordination of normal activities of life. By exploring the interactions of genetic variation between encoding and their neighbor noncoding genes, we can know more about crosstalk of genes and obtain better understanding for the mechanism of mutual regulation. The effect of an individual SNP on disease risk was usually reported to be weak (OR < 1.5), but combination of interacting SNPs had a moderate (OR ≥ 1.5) or strong effect (OR ≥ 2) on the susceptibility to cancer.19, 20 In our previous individual study, 7 PGC SNPs and 7 lncRNA SNPs involved had been investigated and the results announced that PGC rs6939861 was associated with a weakly increased GC risk (OR = 1.32), while rs6941539 and rs6912200 had no association with any disease risk.11, 12 All the lncRNA SNPs had no effect on GC risk.13 In the present assembled study, we found that PGC rs6941539 combined with lnc‐C6orf‐132‐1 rs72855279 and rs80112640 had interaction ORs of 4.65 and 4.60 for GC risk; PGC rs6912200 combined with rs72855279 and rs80112640 had interaction ORs of 6.34 and 6.27; and pairwise PGC rs6939861 with lnc‐C6orf‐132‐1 rs7749023, rs7747696, rs72855279, and rs80112640 had interaction ORs of 3.87, 4.88, 5.70, and 5.76 for GC risk, respectively. All of the risk effects are strong and greater than the individual effects of related SNPs, suggesting PGC‐lncRNA SNPs could synergistically enhance the susceptibility to GC and be used as more effective markers for risk prediction. Notably, two interactions rs6939861‐rs7749023 and rs6939861‐rs7747696 also survived the Bonferroni correction, which was a strict method for multiple comparison. Given the strong significance on GC, we further calculated the population attributable fraction (PAF) to assess their clinical or public health values. The RRs were 1.19 and 1.22, and PAFs were 0.093 and 0.105, respectively. It could be drawn from the results that about 9.3% and 10.5% patients with GC in our study might be attributed to their carrying combined risk genotypes of PGC rs6939861 with lnc‐C6orf‐132‐1 rs7749023 and rs7747696. The statistics may guide larger population and indicate the potential value of combined detection of polymorphisms in PGC and its neighbor lncRNAs for GC early screening.
Among the studied polymorphisms, some SNPs made no significant contribution to GC/AG risk in the main effect analysis. For example, PGC rs6912200 CT+TT genotype showed no association with AG/GC risk compared with CC genotype (P = 0.637, OR = 1.06; P = 0.547, OR = 0.93, respectively).11 However, when combined with some lncRNA SNPs, obvious epistasis was observed (P = 0.026, OR = 1.46; P = 0.026, OR = 0.16, respectively). Moreover, lnc‐C6orf‐132‐1 rs7747696 was also not associated with AG/GC (P = 0.086, OR = 1.19; P = 0.670, OR = 1.05, respectively).13 But in the presence of PGC rs6912200 CC genotype, rs7747696 AG+AA genotype was linked to a 1.79‐fold moderate increased AG risk, which was the highest in AG‐related SNPs. On GC risk, it showed a unique strong effect (OR = 2.06) when PGC rs6939861 GA+AA genotype was present. They also demonstrated a significant cumulative effect, suggesting their cooperation with each other to confer GC susceptibility. Therefore, lnc‐C6orf‐132‐1 rs7747696 AG+GG genotype combined with PGC rs6912200 CC genotype and rs6939861 GA+AA genotype might be the superior SNP models for determination of AG/GC risk, respectively.
Apart from the host genetics, environmental factors also play critical roles in the development of gastric diseases. In this study, two environmental factors including smoking and drinking were found to have modifying effects on PGC‐lncRNA SNP interactions. The carcinogenic effect of tobacco smoke on various organs is well recognized, and it accounts for about 50% increase in GC risk.21, 22 Previously, lots of studies have investigated the interaction between other genes and smoking on GC, including TNF, Exo1, CYP1A1, IL‐10, ERCC8, GSTP1, and hTERT.23, 24, 25, 26, 27, 28, 29 They all suggest genetic effects of gene polymorphisms on gastric carcinogenesis can be exacerbated by cigarette smoking. Here, the interactions of PGC rs9471643 and lnc‐C6orf‐132‐1 rs7749023/rs7747696 on AG risk could also be affected by smoking, although the mechanism has not been understood. Similar to tobacco smoke, alcohol drinking is also a well‐acknowledged independent risk factor of GC, which has been reported to have interactions with genetic variations in several metabolic enzyme genes such as GSTM1 and ALDH2.30, 31 Alcohol is initially metabolized to an intermediate metabolite, acetaldehyde, which is further metabolized and eliminated from the body.32 Reactive oxygen species (ROSs) are produced during the generation of NADH from the conversion of ethanol to acetaldehyde by alcohol dehydrogenase and may induce gastric mucosal oxidative injury.33, 34 The modifying effects of drinking on SNP interactions for GC risk were also demonstrated in our study, which were PGC rs6941539 and lnc‐C6orf‐132‐1 rs7748341. However, it needs verification whether PGC and neighbor lncRNAs participate in alcohol metabolism.
The effects of gene polymorphisms on cancer susceptibility are often achieved by affecting the expression of its encoding protein. In the present study, we evaluated the influence of interacting SNPs on PGC protein expression in serum. With respect to PGC rs6912200 with lnc‐C6orf132‐1 rs7749023, the CT/TT+AA genotype can significantly reduce PGII level compared with the CC+AA genotype, suggesting PGC rs6912200 could affect serum PGC expression. Our research group has also found healthy subjects carried with rs6912200 CT, TT, and CT/TT variant genotypes have lower serum expression levels of PGC protein.11 However, the difference cannot be observed in the subjects carried with rs7749023 AC/CC genotype, indicating lnc‐C6orf132‐1 rs7749023 might counteract with rs6912200 and upregulate PGC expression. It has been revealed that SNP interactions between PGC with some host genes such as IL1B and PTPN11 may result from the alteration of PGC protein expression. PGC can also interact with polymorphisms in miRNAs that target it, including let‐7e, miR‐4795, and miR‐365b. They can bind to the 3′‐UTR region of PGC and inhibit its expression.35 Our study first reported the SNP interactions of PGC with its neighbor lncRNAs could also affect PGC expression. PGC protein is a well‐known marker for the differentiation of gastric epithelial cells. It serves as a proteinase involved in the digestion of protein in stomach, and its levels significantly decrease in AG and dysplasia implicating poorly differentiated cells and are more susceptible to GC.10 Furthermore, the serum PGII level has been proven to be promising biomarkers for diagnosis of GC and AG in recent years.36, 37 Therefore, PGC protein has close relationship with malignancy of gastric mucosa and could well recognize the risk of malignant gastric lesions. Based on the above findings, it is not difficult to speculate the possible mechanism of SNP interactions in PGC with its neighbor lncRNAs on enhancing the susceptibility to GC/AG may due to their influence on PGC expression.
The association of studied SNPs with lncRNA expression was also investigated. One single lncRNA SNP, rs7749023, was found to affect the expression level of lnc‐C6orf132‐1. Interestingly, when rs7749023 was combined with PGC rs6939861, the influence on lnc‐C6orf132‐1 expression could only be observed in the presence of rs6939861 GA+AA genotype but none in GG genotype, suggesting the expression of involved lncRNAs might also be affected by their SNP interactions. Through lncRNA expression profile and Gene Ontology (GO) analysis, we have known lnc‐C6orf132‐1 has the ability to upregulate and downregulate the expression of some oncogenes or tumor suppressor genes related to GC progression.13 As an important class of molecular regulators in human genomes, lncRNAs could influence the expression of nearby genes through transcription‐related process such as enhancing the activity of gene promoters, which was called cis‐acting.38 In our study, three interacting PGC SNPs are located in the promoter region, including rs6912200, rs6941539, and rs9471643. The neighbor lncRNAs may exert regulatory roles on PGC in cis, act with the SNPs in PGC promoters and thus demonstrate gene‐gene interactions. Further in‐depth study is needed to elucidate the molecular mechanism involved.
In summary (Figure 1, Table S8), we conducted a case‐control study to explore the SNP interactions between PGC and its neighbor lncRNAs for the risk of GC and AG, the modifying effects of environmental factors, and the influence of SNP interactions on the expression of PGC protein and involved lncRNAs. A total of 15 pairwise interacting PGC‐lncRNA SNPs were discovered, in which five pairs were associated with AG risk and ten pairs were associated with GC risk. By comparing the epistasis and cumulative effects, superior SNP diagnostic models for AG/GC were identified respectively. Some three‐way interactions of SNPs with smoking and drinking could also be observed. Besides, a few interacting SNPs showed correlations with the expression levels of PGC protein and related lncRNAs in serum, which might account for their gene‐gene interactions on GC/AG. Our study would provide research clues for further screening combination biomarkers uniting both protein‐coding and noncoding genes with the potential in prediction of the susceptibility to GC and its precursor.
Figure 1.
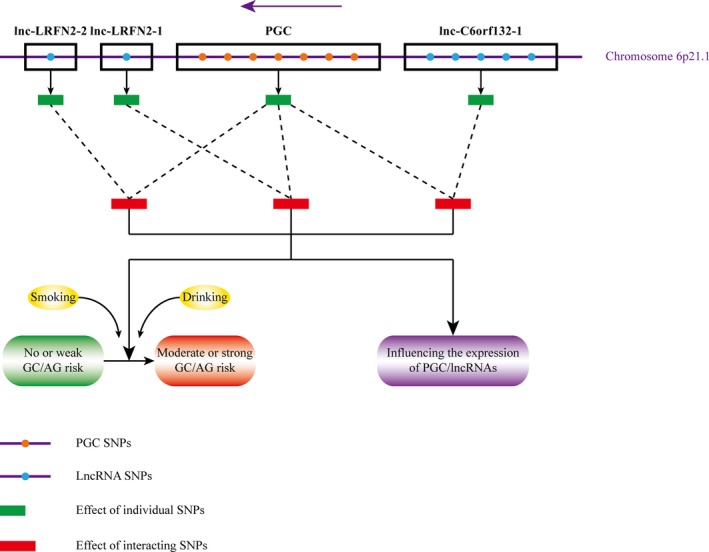
The pattern diagram of SNP interactions between PGC and its neighbor lncRNAs. A total of 14 individual SNPs are involved, including seven in PGC, five in lnc‐C6orf132‐1, one in lnc‐LRFN2‐1, and one in lnc‐LRFN2‐2. The effects of interacting SNPs modified by environmental factors could enhance the susceptibility to GC/AG and influence the expression of PGC protein and related lncRNAs
CONFLICT OF INTEREST
None declared.
Supporting information
Lv Z, Sun L, Xu Q, et al. SNP interactions of PGC with its neighbor lncRNAs enhance the susceptibility to gastric cancer/atrophic gastritis and influence the expression of involved molecules. Cancer Med. 2018;7:5252–5271. 10.1002/cam4.1743
Lv and Sun contributed equally to this work.
REFERENCES
- 1. He M, Wu C, Xu J, et al. A genome wide association study of genetic loci that influence tumour biomarkers cancer antigen 19‐9, carcinoembryonic antigen and alpha fetoprotein and their associations with cancer risk. Gut. 2014;63:143‐151. [DOI] [PubMed] [Google Scholar]
- 2. Mavaddat N, Pharoah PD, Michailidou K, et al. Prediction of breast cancer risk based on profiling with common genetic variants. J Natl Cancer Inst. 2015;107:djv036. [DOI] [PMC free article] [PubMed] [Google Scholar]
- 3. Preskill C, Weidhaas JB. SNPs in microRNA binding sites as prognostic and predictive cancer biomarkers. Crit Rev Oncog. 2013;18:327‐340. [DOI] [PMC free article] [PubMed] [Google Scholar]
- 4. Roukos DH. Assessing both genetic variation (SNPs/CNVs) and gene‐environment interactions may lead to personalized gastric cancer prevention. Expert Rev Mol Diagn. 2009;9:1‐6. [DOI] [PubMed] [Google Scholar]
- 5. Fang G, Haznadar M, Wang W, et al. High‐order SNP combinations associated with complex diseases: efficient discovery, statistical power and functional interactions. PLoS ONE. 2012;7:e33531. [DOI] [PMC free article] [PubMed] [Google Scholar]
- 6. Lv Z, Xu Q, Yuan Y. A systematic review and meta‐analysis of the association between long non‐coding RNA polymorphisms and cancer risk. Mutat Res. 2017;771:1‐14. [DOI] [PubMed] [Google Scholar]
- 7. Guil S, Esteller M. Cis‐acting noncoding RNAs: friends and foes. Nat Struct Mol Biol. 2012;19:1068‐1075. [DOI] [PubMed] [Google Scholar]
- 8. Massarrat S, Haj‐Sheykholeslami A, Mohamadkhani A, et al. Pepsinogen II can be a potential surrogate marker of morphological changes in corpus before and after H. pylori eradication. Biomed Res Int. 2014;2014:481607. [DOI] [PMC free article] [PubMed] [Google Scholar]
- 9. Yasugi S. Epithelial cell differentiation during stomach development. Hum Cell. 2000;13:177‐184. [PubMed] [Google Scholar]
- 10. Ning PF, Liu HJ, Yuan Y. Dynamic expression of pepsinogen C in gastric cancer, precancerous lesions and Helicobacter pylori associated gastric diseases. World J Gastroenterol. 2005;11:2545‐2548. [DOI] [PMC free article] [PubMed] [Google Scholar]
- 11. He CY, Sun LP, Xu Q, et al. PGC TagSNP and its interaction with H. pylori and relation with gene expression in susceptibility to gastric carcinogenesis. PLoS ONE. 2014;9:e115955. [DOI] [PMC free article] [PubMed] [Google Scholar]
- 12. He C, Tu H, Sun L, et al. Helicobacter pylori‐related host gene polymorphisms associated with susceptibility of gastric carcinogenesis: a two‐stage case‐control study in Chinese. Carcinogenesis. 2013;34:1450‐1457. [DOI] [PubMed] [Google Scholar]
- 13. Lv Z, Sun L, Xu Q, et al. Long non‐coding RNA polymorphisms in 6p21. 1 are associated with atrophic gastritis risk and gastric cancer prognosis. Oncotarget. 2017;8:95303. [DOI] [PMC free article] [PubMed] [Google Scholar]
- 14. Tu H, Sun L, Dong X, et al. Temporal changes in serum biomarkers and risk for progression of gastric precancerous lesions: a longitudinal study. Int J Cancer. 2015;136:425‐434. [DOI] [PMC free article] [PubMed] [Google Scholar]
- 15. Dixon MF, Genta RM, Yardley JH, et al. Classification and grading of gastritis. The updated Sydney System. International Workshop on the Histopathology of Gastritis, Houston 1994. Am J Surg Pathol. 1996;20:1161‐1181. [DOI] [PubMed] [Google Scholar]
- 16. Stolte M, Meining A. The updated Sydney system: classification and grading of gastritis as the basis of diagnosis and treatment. Can J Gastroenterol. 2001;15:591‐598. [DOI] [PubMed] [Google Scholar]
- 17. Sobin LH, Compton CC. TNM seventh edition: what's new, what's changed: communication from the International Union Against Cancer and the American Joint Committee on Cancer. Cancer. 2010;116:5336‐5339. [DOI] [PubMed] [Google Scholar]
- 18. He C, Xu Q, Tu H, et al. Polymorphic rs9471643 and rs6458238 upregulate PGC transcription and protein expression in overdominant or dominant models. Mol Carcinog. 2016;55:586‐599. [DOI] [PubMed] [Google Scholar]
- 19. Lin HY, Amankwah EK, Tseng TS, et al. SNP‐SNP interaction network in angiogenesis genes associated with prostate cancer aggressiveness. PLoS ONE. 2013;8:e59688. [DOI] [PMC free article] [PubMed] [Google Scholar]
- 20. Bedard PL, Krzyzanowska MK, Pintilie M, et al. Statistical power of negative randomized controlled trials presented at American Society for Clinical Oncology annual meetings. J Clin Oncol. 2007;25:3482‐3487. [DOI] [PubMed] [Google Scholar]
- 21. La Torre G, Chiaradia G, Gianfagna F, et al. Smoking status and gastric cancer risk: an updated meta‐analysis of case‐control studies published in the past ten years. Tumori. 2009;95:13‐22. [DOI] [PubMed] [Google Scholar]
- 22. Ladeiras‐Lopes R, Pereira AK, Nogueira A, et al. Smoking and gastric cancer: systematic review and meta‐analysis of cohort studies. Cancer Causes Control. 2008;19:689‐701. [DOI] [PubMed] [Google Scholar]
- 23. Zhang Y, Sun LP, Xing CZ, et al. Interaction between GSTP1 Val allele and H. pylori infection, smoking and alcohol consumption and risk of gastric cancer among the Chinese population. PLoS ONE. 2012;7:e47178. [DOI] [PMC free article] [PubMed] [Google Scholar]
- 24. Han F, Wang X, Wang X, et al. Meta‐analysis of the association of CYP1A1 polymorphisms with gastric cancer susceptibility and interaction with tobacco smoking. Mol Biol Rep. 2012;39:8335‐8344. [DOI] [PubMed] [Google Scholar]
- 25. Bau DT, Wang HC, Liu CS, et al. Single‐nucleotide polymorphism of the Exo1 gene: association with gastric cancer susceptibility and interaction with smoking in Taiwan. Chin J Physiol. 2009;52:411‐418. [DOI] [PubMed] [Google Scholar]
- 26. Zhang J, Ju H, Gao JR, et al. Polymorphisms in human telomerase reverse transcriptase (hTERT) gene, gene‐ gene and gene‐smoking interaction with susceptibility to gastric cancer in Chinese Han population. Oncotarget. 2017;8:20235‐20243. [DOI] [PMC free article] [PubMed] [Google Scholar]
- 27. Kuo WH, Huang CY, Fu CK, et al. Effects of interleukin‐10 polymorphisms and smoking on the risk of gastric cancer in Taiwan. In Vivo. 2014;28:967‐971. [PubMed] [Google Scholar]
- 28. Yang JJ, Ko KP, Cho LY, et al. The role of TNF genetic variants and the interaction with cigarette smoking for gastric cancer risk: a nested case‐control study. BMC Cancer. 2009;9:238. [DOI] [PMC free article] [PubMed] [Google Scholar]
- 29. Jing JJ, Sun LP, Xu Q, et al. Effect of ERCC8 tagSNPs and their association with H. pylori infection, smoking, and alcohol consumption on gastric cancer and atrophic gastritis risk. Tumour Biol. 2015;36:9525‐9535. [DOI] [PubMed] [Google Scholar]
- 30. Lao X, Peng Q, Lu Y, et al. Glutathione S‐transferase gene GSTM1, gene‐gene interaction, and gastric cancer susceptibility: evidence from an updated meta‐analysis. Cancer Cell Int. 2014;14:127. [DOI] [PMC free article] [PubMed] [Google Scholar]
- 31. Shin CM, Kim N, Cho SI, et al. Association between alcohol intake and risk for gastric cancer with regard to ALDH2 genotype in the Korean population. Int J Epidemiol. 2011;40:1047‐1055. [DOI] [PubMed] [Google Scholar]
- 32. Bosron WF, Li TK. Genetic polymorphism of human liver alcohol and aldehyde dehydrogenases, and their relationship to alcohol metabolism and alcoholism. Hepatology. 1986;6:502‐510. [DOI] [PubMed] [Google Scholar]
- 33. Bhattacharyya A, Chattopadhyay R, Mitra S, et al. Oxidative stress: an essential factor in the pathogenesis of gastrointestinal mucosal diseases. Physiol Rev. 2014;94:329‐354. [DOI] [PMC free article] [PubMed] [Google Scholar]
- 34. Brind AM, Hurlstone A, Edrisinghe D, et al. The role of polymorphisms of glutathione S‐transferases GSTM1, M3, P1, T1 and A1 in susceptibility to alcoholic liver disease. Alcohol Alcohol. 2004;39:478‐483. [DOI] [PubMed] [Google Scholar]
- 35. Wu YF, Xu Q, He CY, et al. Association of polymorphisms in three pri‐miRNAs that target pepsinogen C with the risk and prognosis of gastric cancer. Sci Rep. 2017;7:39528. [DOI] [PMC free article] [PubMed] [Google Scholar]
- 36. He CY, Sun LP, Gong YH, et al. Serum pepsinogen II: a neglected but useful biomarker to differentiate between diseased and normal stomachs. J Gastroenterol Hepatol. 2011;26:1039‐1046. [DOI] [PubMed] [Google Scholar]
- 37. Yoshida T, Kato J, Inoue I, et al. Cancer development based on chronic active gastritis and resulting gastric atrophy as assessed by serum levels of pepsinogen and Helicobacter pylori antibody titer. Int J Cancer. 2014;134:1445‐1457. [DOI] [PubMed] [Google Scholar]
- 38. Engreitz JM, Haines JE, Perez EM, et al. Local regulation of gene expression by lncRNA promoters, transcription and splicing. Nature. 2016;539:452‐455. [DOI] [PMC free article] [PubMed] [Google Scholar]
Associated Data
This section collects any data citations, data availability statements, or supplementary materials included in this article.
Supplementary Materials