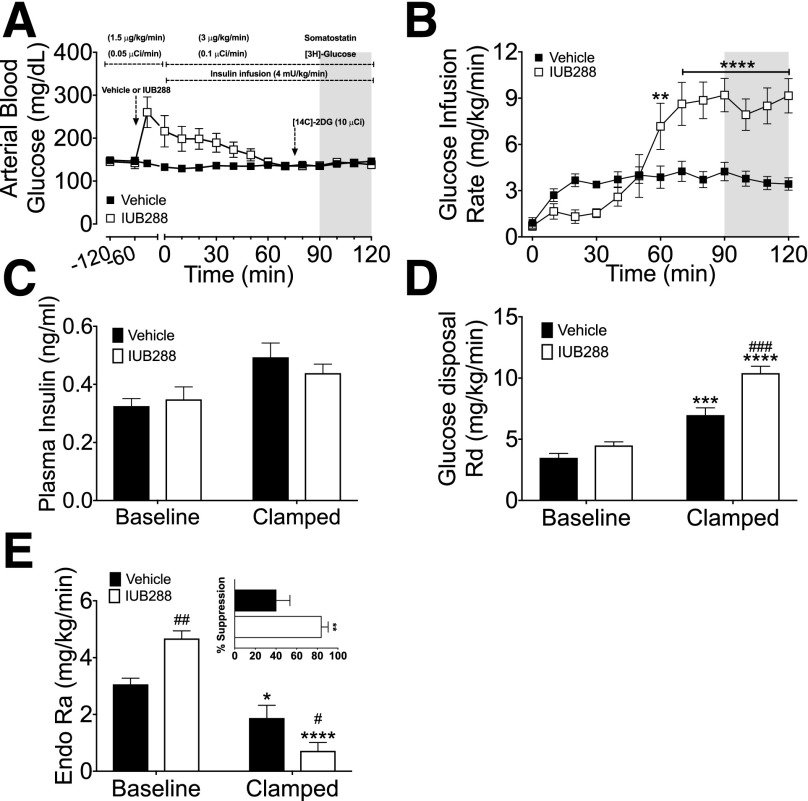
Figure 3.
GCGR agonism enhances hepatic insulin sensitivity during euglycemic clamp. Blood glucose (A) and GIR (B) during labeled euglycemic clamp. Plasma insulin (C), Rd (D), Ra (E), and suppression of Ra (E, inset) during labeled euglycemic clamp. All data are represented as mean ± SEM (n = 6–7 mice). See also Supplementary Fig. 5. *P < 0.05, **P < 0.01, ***P < 0.001, and ****P < 0.0001, vs. baseline time point; #P < 0.05, ##P < 0.01, and ###P < 0.001, vs. vehicle within time points.

