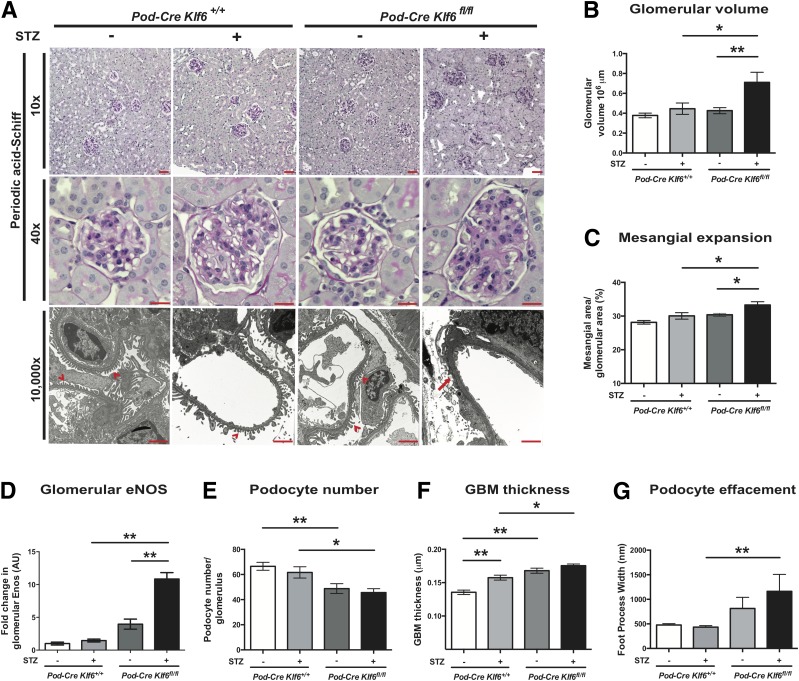
Figure 2.
Diabetic Podocin-Cre Klf6flox/flox (Pod-Cre Klf6fl/fl) mice demonstrate increased glomerular injury. A: Representative images of paraffin-embedded sections stained with PAS are shown at low power (×10) and high power (×40) to demonstrate changes in mesangial expansion, glomerular volume, and tubulointerstitial changes. Ultrastructural changes are also shown at original magnification ×10,000 by transmission EM to show changes in podocyte structure and GBM. Red arrowheads indicate upright foot processes, and red arrow shows foot process effacement. Scale bars = 100 μm. Quantification of glomerular volume (B), mesangial expansion (C), glomerular eNOS staining (D), and podocyte number (E; number of WT1+ cells per glomerulus) is shown (n = 20 glomeruli/mouse, n = 6 mice/group; *P < 0.05; **P < 0.01, Kruskal-Wallis test with Dunn posttest). Quantification of ultrastructural changes: GBM thickness (F) and podocyte effacement (G; measurement by foot process width between slit diaphragm) is also shown (n = 3 mice/group; *P < 0.05; **P < 0.01, Kruskal-Wallis test with Dunn posttest). AU, arbitrary units.

