

Abstract
Motivation
The interactive visualization of very large macromolecular complexes on the web is becoming a challenging problem as experimental techniques advance at an unprecedented rate and deliver structures of increasing size.
Results
We have tackled this problem by developing highly memory-efficient and scalable extensions for the NGL WebGL-based molecular viewer and by using Macromolecular Transmission Format (MMTF), a binary and compressed MMTF. These enable NGL to download and render molecular complexes with millions of atoms interactively on desktop computers and smartphones alike, making it a tool of choice for web-based molecular visualization in research and education.
Availability and implementation
The source code is freely available under the MIT license at github.com/arose/ngl and distributed on NPM (npmjs.com/package/ngl). MMTF-JavaScript encoders and decoders are available at github.com/rcsb/mmtf-javascript.
1 Introduction
Interactive visualization of molecular structures is a widely used tool in biological research. Displaying molecular structures on the web makes them accessible to all scientists, educators, and students, not just to experts with access to dedicated networking, hardware and software. Overviews of current web-based molecular graphics and modeling software are given by Pirhadi et al. (2016) and Yuan et al. (2017). Driven by advancements in X-ray crystallography and especially in Cryo-EM, larger and larger structures are submitted to the Protein Data Bank (PDB) archive (Berman et al., 2000; Rose et al., 2017). As a consequence, more effective ways are needed for transmitting the structure files, parsing and finally rendering them in web browsers and on mobile devices.
Advances in web browser technology opened up new avenues for implementing and deploying molecular graphics tools. A number of new 3D viewers have since emerged to address the rendering of 3D structures on the web using either HTML5 or WebGL, which adds native support for GPU hardware-acceleration. These include, JSmol, the Jmol port to JavaScript/HTML 5 (Hanson, 2010) and the WebGL-based viewers 3Dmol.js (Rego and Koes, 2015), ChemDoodle (Burger, 2015), iCn3D github.com/ncbi/icn3d, PV github.com/biasmv/pv, LiteMol (Sehnal et al., 2017), Molmil (Bekker et al., 2016), NGL Viewer (Rose and Hildebrand, 2015) and Web3DMol (Shi et al., 2017). In addition, both 3Dmol.js and NGL Viewer (Nguyen et al., 2017) have plugins for Jupyter Notebooks (jupyter.org).
While these viewers enable 3D rendering in modern web browsers and on mobile devices, efficient transmission and a small client side memory footprint of the structural data are essential for visualizing large structures. To address the challenges of the growing size of structures submitted to PDB, we updated the NGL Viewer (Rose and Hildebrand, 2015) to provide scalable molecular graphics on the web. The viewer makes extensive use of modern browser features, including WebGL and Web Workers to allow fast 3D graphics and numerical calculations (Khan et al., 2014). Further, it parses files in the Macromolecular Transmission Format (MMTF), our new binary and compressed format for molecular structures (Bradley et al., 2017). MMTF is a binary format that is much faster to parse than existing text-based file formats for macromolecular data. Through bespoke compression methods, the entire PDB archive can be stored in MMTF in about 9GB (Valasatava et al., 2017). The MMTF file format was specifically designed for high-performance transmission and efficient data representation of macromolecular data and NGL Viewer is its first application. Figure 1 demonstrates the rendering of the currently largest structure in the PDB at different scales.
Fig. 1.
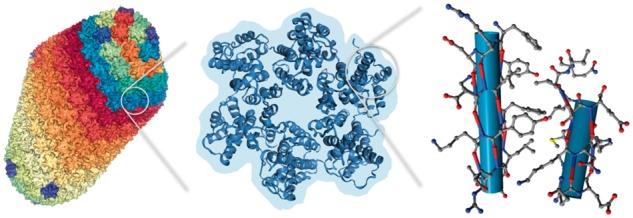
Multi-scale visualization of the 2.4 M atoms HIV-1 capsid structure [PDB ID 3J3Q, Zhao et al. (2013)] in the NGL Viewer loaded from a 13 MB gzipped MMTF file. Shown are visualizations with an increasing level of detail which are generated on-the-fly from the same file. More detailed visualizations are only created for parts of the structure to reduce visual clutter and allow fast rendering. Left: molecular surface rendering of the whole capsid. Middle: secondary structure cartoon with a background silhouette of a hexametric subunit. Right: atom and bond display of two helices shown as cylinders
2 Materials and methods
The general steps for displaying a macromolecular structure on the web are: download file, decompress & parse, populate a data model, create geometry and render it. To speed-up the download and parsing step we use the MMTF format (Bradley et al., 2017). Its compressed binary data offers smaller file-sizes and faster parsing speed. Moreover it includes all necessary bonding information for rendering. Our approaches for optimizing the data model, geometry and rendering are described below.
To enable molecular graphics that scale to large macromolecules, efficient memory management is crucial, especially on devices with limited resources. We created a parser for MMTF and a data model for NGL that allows memory reuse and avoids duplicating data. The NGL data model uses a flat, columnar layout with a single JavaScript TypedArray for each property (e.g. atom co-ordinates, Fig. 2). This allows the parsed MMTF data to be reused or copied in blocks to the NGL data model. Reusable proxy objects (e.g. for atoms) are then used for convenient property access and traversal of the structure hierarchy (Fig. 2). Moreover, bit arrays were added to leverage hardware bit-level parallelism for increased performance when combining selections and to allow storing arbitrary selections of atoms with minimal memory use. A set bit at index i indicates that the atom at i in the atomStore is selected.
Fig. 2.

Schema of the flat, columnar data model used in NGL to store molecular structures. Each property array of a store is a single Typed Array, for instance, the xCoord property array contains the x coordinates for all atoms of the structure. Special index and offset property arrays allow traversing the structure hierarchy. As there are only a few types of residues and atoms in a structure, common properties are stored in corresponding type objects. For concise and convenient access, proxy objects are available to get data from the store and type objects
For rendering, WebGL is efficiently used by preparing the data such that the number of calls to the WebGL API does not grow with the size of the macromolecules. WebGL API calls have a fixed time cost, therefore molecular representations are grouped and rendered together as opposed to rendering, e.g. each atom individually. By that, the substantial overhead every WebGL API call adds is avoided, e.g. making a WebGL API call for every atom to be rendered would be prohibitively slow even for moderately sized structures. As in previous NGL versions (Rose and Hildebrand, 2015), spheres and cylinders can be rendered efficiently as ray-casted impostors (Fig. 3A): For each pixel, the GPU tests the intersection of sphere and camera ray to produce high quality images independent of resolution (Sigg et al., 2006). Impostors are also used to render cylinders and hyperboloids, the latter follows the approach by Chavent et al. (Chavent et al., 2011) to produce the HyperBalls representation. Long running calculations like generating molecular surfaces can be performed on separate Web Worker threads to leverage available CPUs and to avoid blocking the user interface.
Fig. 3.
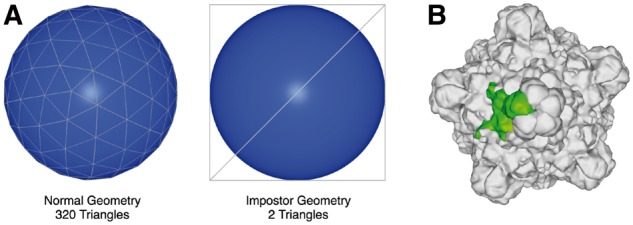
(A) Comparison of the amount of triangles required to render the surface of a sphere using the standard triangle-geometry approach (left) versus ray-casted impostors (right). (B) Example of using software instancing to render the surface (green) of a highly symmetric virus capsid (PDB ID 1RB8). The surface geometry is transferred once to the GPU and then reused 59 times
The Viewer supports common molecular representations, including spacefill, ball & stick, cartoon and surfaces. It can parse and render volumetric data showing electron densities and electrostatic potentials. Multi-model files and trajectories from molecular dynamics simulations can be loaded and animated. When rendering instances of biological assemblies and crystallographic unit cells, transformations are performed on the GPU to minimize memory usage and data transferred to the GPU (Fig. 3B).
3 Results and discussion
We have developed a memory efficient representation for molecular data in the NGL Viewer as well as a reference implementation for decoding and parsing MMTF files in JavaScript. The developments in the NGL data model and the use of MMTF significantly reduce the peak memory consumption. In Figure 4, we show the rendering of some of the largest structures in the PDB. In Table 1, we compare the loading of these structures from MMTF (Bradley et al., 2017) and mmCIF (Westbrook and Fitzgerald, 2009) files. MMTF files are about one third to one quarter the size of the corresponding gzipped mmCIF files, which speeds up the download of structures. Second, on average, MMTF files can be parsed about 10 times faster than mmCIF files. Third, maximum heap memory is reduced by a factor of two or more for very large structures. These improvements, together with fast rendering, enable the interactive visualization of even the largest structures in the PDB in a web browser.
Fig. 4.
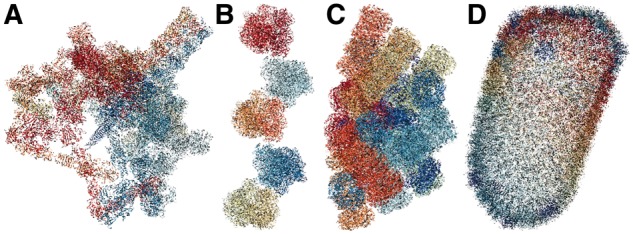
Large structures: (A) PDB ID 5IV5, (B) 4V4G, (C) 5Y6P and (D) 3J3Q, rendered with NGL Viewer in a cartoon representation. Note that these are the same structures used in Table 1 for the performance metrics
Table 1.
Metrics for parsing and rendering four of the largest structures in the PDB archive from the MMTF and mmCIF files using NGL v2
| PDB ID | aFile parsing [ms] | Geometry creation and rendering [ms] | aJS Heap Memory [MB] | aFile size [MB] | Atom count |
|---|---|---|---|---|---|
| 5IV5 | 386/3312 | 774 | 195/348 | 3.3/11.0 | 549 576 |
| 4V4G | 485/4377 | 850 | 198/454 | 3.9/15.4 | 717 805 |
| 5Y6P | 654/7623 | 1368 | 196/594 | 9.0/28.7 | 1 234 811 |
| 3J3Q | 965/14514 | 2155 | 193/787 | 13.5/47.3 | 2 440 800 |
Note: Tests were performed in Chrome 64 under MacOS X 10.11 on a Mac mini (Processor 2.6 GHz Intel Core i5, Memory 16 GB 1600 MHz DDR3, Graphics Intel Iris 1536 MB). The JS Heap Memory is as reported by the Performance Tool in the Chrome developer tools.
Data for MMTF/mmCIF, respectively.
Due to its high performance, NGL Viewer has been selected as the default 3D viewer for the RCSB PDB website (rcsb.org) and has replaced RCSB PDB Mobile (Quinn et al., 2015), a dedicated viewer for mobile devices. NGL Viewer downloads MMTF files that contain the asymmetric unit and transformations to create biological assemblies. Shown in Figure 5 is the biological assembly of the rat liver vault protein, generated by applying the symmetry transformations on the GPU.
Fig. 5.
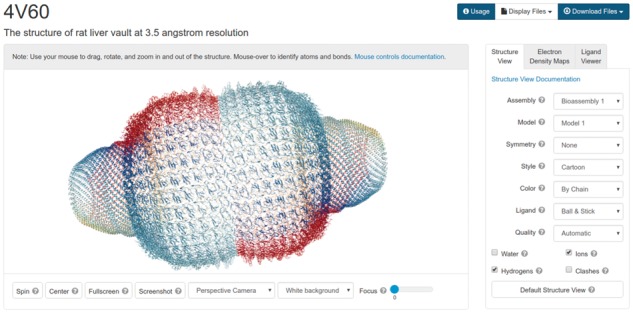
Biological Assembly view of the rat liver vault protein PDB ID 4V60 rendered with NGL Viewer using the MMTF file format on the RCSB PDB website
Another use case of NGL is the interactive download and rendering of structures using the NGLview plugin (Nguyen et al., 2017) in Jupyter Notebooks. Here, the fast download and rendering lets a user browse through a set of structures without any noticeable delay in loading and rendering structures. Several other viewers and biomolecular libraries have adopted the MMTF file format (see: mmtf.rcsb.org). LiteMol (Sehnal et al., 2017) has adopted BinaryCIF, a version of the mmCIF file format using MMTF’s encoding and compression strategies.
Molecular visualization is fundamental to biological research. Profound advances in experimental techniques provide ever more data on ever larger biological systems. We described a number of methods that enable scalable molecular graphics on the web. Using our viewer, large systems can be interactively viewed and manipulated using a web-browser, even on mobile devices.
Acknowledgements
This project was supported in part by the NIH (U01 CA198942; PI: PW Rose), and the RCSB PDB which is jointly funded by the NSF, the NIH, and the US DoE (NSF DBI-1338415; PI: SK Burley).
Conflict of Interest: none declared.
References
- Bekker G.-J. et al. (2016) Molmil: a molecular viewer for the pdb and beyond. J. Cheminform., 8, 42. [DOI] [PMC free article] [PubMed] [Google Scholar]
- Berman H.M. et al. (2000) The protein data bank. Nucleic Acids Res., 28, 235–242. [DOI] [PMC free article] [PubMed] [Google Scholar]
- Bradley A.R. et al. (2017) MMTF—an efficient file format for the transmission, visualization, and analysis of macromolecular structures. PLoS Comput. Biol., 13, e1005575. [DOI] [PMC free article] [PubMed] [Google Scholar]
- Burger M.C. (2015) Chemdoodle web components: html5 toolkit for chemical graphics, interfaces, and informatics. J. Cheminform., 7, 35.. [DOI] [PMC free article] [PubMed] [Google Scholar]
- Chavent M. et al. (2011) GPU-accelerated atom and dynamic bond visualization using hyperballs: a unified algorithm for balls, sticks, and hyperboloids. J. Comput. Chem., 32, 2924–2935. [DOI] [PubMed] [Google Scholar]
- Hanson R.M. (2010) Jmol–a paradigm shift in crystallographic visualization. J. Appl. Crystallography, 43, 1250–1260. [Google Scholar]
- Khan F. et al. (2014) Using JavaScript and WebCL for numerical computations: a comparative study of native and web technologies. In Proceeding DLS’14 Proceedings of the 10th ACM Symposium on Dynamic languages, Portland, Oregon, USA, pp. 91–102.
- Nguyen H. et al. (2017) Nglview—interactive molecular graphics for jupyter notebooks. Bioinformatics, 1241–1242. [DOI] [PMC free article] [PubMed] [Google Scholar]
- Pirhadi S. et al. (2016) Open source molecular modeling. J. Mol. Graph. Model., 69, 127–143. [DOI] [PMC free article] [PubMed] [Google Scholar]
- Quinn G.B. et al. (2015) RCSB PDB Mobile: iOS and Android mobile apps to provide data access and visualization to the RCSB Protein Data Bank. Bioinformatics, 31, 126–127. [DOI] [PMC free article] [PubMed] [Google Scholar]
- Rego N., Koes D. (2015) 3dmol.js: molecular visualization with WebGL. Bioinformatics, 31, 1322–1324. [DOI] [PMC free article] [PubMed] [Google Scholar]
- Rose A.S., Hildebrand P.W. (2015) NGL Viewer: a web application for molecular visualization. Nucleic Acids Res., W576–W579. [DOI] [PMC free article] [PubMed] [Google Scholar]
- Rose P.W. et al. (2017) The RCSB protein data bank: integrative view of protein, gene and 3D structural information. Nucleic Acids Res., 45, D271–D281. [DOI] [PMC free article] [PubMed] [Google Scholar]
- Sehnal D. et al. (2017) LiteMol suite: interactive web-based visualization of large-scale macromolecular structure data. Nat. Methods, 14, 1121–1122. [DOI] [PubMed] [Google Scholar]
- Shi M. et al. (2017) Web3DMol: interactive protein structure visualization based on WebGL. Nucleic Acids Res., 45, W523–W527. [DOI] [PMC free article] [PubMed] [Google Scholar]
- Sigg C. et al. (2006). GPU-based ray-casting of quadratic surfaces In: Botsch M., Chen B., Pauly M., Zwicker M. (eds). Symposium on Point-Based Graphics. The Eurographics Association, Aire-la-Ville, Switzerland, pp. 59–65. [Google Scholar]
- Valasatava Y. et al. (2017) Towards an efficient compression of 3D coordinates of macromolecular structures. PLoS One, 12, e0174846.. [DOI] [PMC free article] [PubMed] [Google Scholar]
- Westbrook J., Fitzgerald P. (2009) The PDB format, mmCIF formats, and other data formats In: Structural Bioinformatics, chapter 10, 2nd edn, John Wiley & Sons, Inc. pp. 271–291. [Google Scholar]
- Yuan S. et al. (2017) Implementing WebGL and HTML5 in macromolecular visualization and modern computer-aided drug design. Trends Biotechnol., 35, 559–571. [DOI] [PubMed] [Google Scholar]
- Zhao G. et al. (2013) Mature HIV-1 capsid structure by cryo-electron microscopy and all-atom molecular dynamics. Nature, 497, 643–646. [DOI] [PMC free article] [PubMed] [Google Scholar]