Abstract
Photoacoustic technology in combination with molecular imaging is a highly effective method for accurately diagnosing brain glioma. For glioma detection at a deeper site, contrast agents with higher photoacoustic imaging sensitivity are needed. Herein, we report a MoS2–ICG hybrid with indocyanine green (ICG) conjugated to the surface of MoS2 nanosheets. The hybrid significantly enhanced photoacoustic imaging sensitivity compared to MoS2 nanosheets. This conjugation results in remarkably high optical absorbance across a broad near-infrared spectrum, redshifting of the ICG absorption peak and photothermal/photoacoustic conversion efficiency enhancement of ICG. A tumor mass of 3.5 mm beneath the mouse scalp was clearly visualized by using MoS2–ICG as a contrast agent for the in vivo photoacoustic imaging of orthotopic glioma, which is nearly twofold deeper than the tumors imaged in our previous report using MoS2 nanosheet. Thus, combined with its good stability and high biocompatibility, the MoS2–ICG hybrid developed in this study has a great potential for high-efficiency tumor molecular imaging in translational medicine.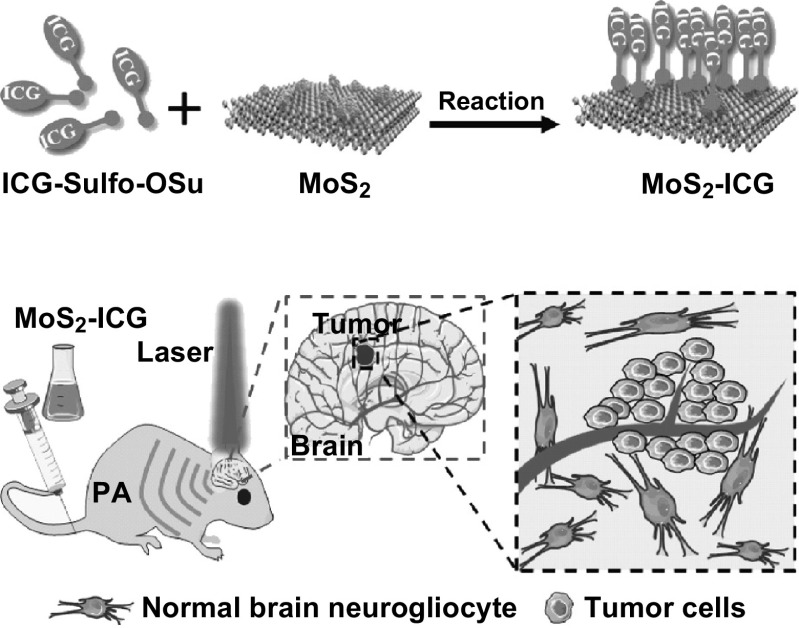
Electronic supplementary material
The online version of this article (10.1007/s40820-018-0202-8) contains supplementary material, which is available to authorized users.
Keywords: MoS2–ICG hybrid, Orthotopic brain glioma, Photoacoustic imaging, Molecular imaging
Highlights
MoS2 nanosheets was covalently conjugated with indocyanine green (ICG) by facile mixing ICG-Sulfo-NHS and MoS2 nanosheets.
The 3.5 mm imaging depth demonstrated in this study is one of the deepest among all the glioma photoacoustic imaging research reported so far by using the nanoprobe in the NIR I spectral region.
The design and validation of the MoS2–ICG hybrid bring up an effective strategy for synthesizing highly sensitive photoacoustic nanoprobes, i.e., by covalently conjugating optical dyes with transition metal dichalcogenides.
Introduction
Brain glioma is a highly invasive intracranial tumor that accounts for nearly one-third of all tumor cases in the central nervous system and shows a high incidence rate, high mortality rate, high recurrence rate, and low curing rate [1, 2]. The 5-year survival rate of glioma for adults is less than 5% [3]. Invasive growth of glioma cells obscures the boundary between normal brain tissue and tumor tissue, making it extremely difficult to accurately diagnose this tumor and delineate the tumor boundary [4]. Novel imaging methods with high sensitivity, specificity, and resolution at tumor-relative imaging depth are urgently needed for accurate diagnosis of glioma, based on which precise tumor surgery can be performed to achieve complete tumor removal and improve the prognosis of the patients [5, 6].
As a novel non-ionizing imaging method, photoacoustic imaging has been rapidly developed in recent years [7, 8]. This imaging technology acquires structural, functional, and molecular information for biological tissues by detecting the acoustic signals generated from the chromophores in the tissue [9–11]. As the contrast of photoacoustic imaging originates from the discrepancy of optical absorption, it retains the high sensitivity and specificity of conventional optical imaging methods [12–14]. Moreover, by detecting the significantly less scattered acoustic waves, photoacoustic imaging can achieve better resolution at higher imaging depth in biological tissues [15–17]. However, when used for brain glioma detection, the lack of endogenous contrast is a major limitation to the distinction between tumor and normal tissues through photoacoustic imaging.
The advent of molecular imaging has provided unprecedented opportunities for glioma detection with high sensitivity and specificity, as the tumor cells can be selectively labeled with exogenous contrast agents to achieve tumor-specific enhanced imaging. Hence, by combining photoacoustic imaging with molecular imaging (i.e., photoacoustic molecular imaging), brain glioma can be diagnosed with high sensitivity, specificity, and resolution at greater depth [18–20]. Nanomaterials such as gold nanoparticles and organic nanoparticles have been used as contrast agents for photoacoustic imaging of glioma [20, 21]. While these contrast agents have good photoacoustic imaging effects, the relatively low near-infrared (NIR) absorbance, narrow NIR absorption spectrum, and short absorbance–wavelength limit their potential for highly efficient in vivo photoacoustic imaging applications. Kircher et al. [20] first synthesized a photoacoustic-magnetic resonance imaging (MRI)-Raman triple-modality imaging nanoprobe and applied it to delineate brain glioma margins. The optical absorption peak of the nanoprobe is approximately 540 nm, which is very close to that of endogenous hemoglobin. Therefore, it is difficult to distinguish the photoacoustic signal of the nanoprobe from that of hemoglobin in in vivo imaging applications. Fan et al. [21] fabricated a perylene bisimide-based nanoparticle with a 675-nm absorbance peak for in situ photoacoustic imaging of mouse C6 brain glioma. The nanoparticle was shown to have excellent enhanced permeability and retention effects for tumor passive targeting. However, as an organic functional small molecule, perylene bisimide tends to be cleared from the blood circulation quickly. Moreover, the absorbance peak of perylene bisimide at 675 nm is close to visible light range, which may lead to high background photoacoustic signals in the blood. Therefore, it is of great needs to develop exogenous probe with long absorption wavelength and high sensitivity for photoacoustic imaging of orthotopic brain glioma.
Molybdenum disulfide (MoS2), a kind of transition metal dichalcogenides with distinctive physical and chemical properties, has sparked an explosion of interest in biomedicine [22–24]. In our previous study, a MoS2 nanoplatform was synthesized and shown to have with good biocompatibility and excellent tumor targeting capability for orthotopic glioma imaging [22]. In situ brain glioma sitting 1.8 mm beneath the mouse scalp was clearly visualized with the aid of MoS2 nanosheet-enhanced photoacoustic imaging. However, the imaging depth must be further increased for glioma detection at even deeper sites. Hence, contrast agents with higher photoacoustic imaging sensitivity (in specific, longer absorption wavelength and higher absorption coefficient) are needed. Because of its large specific surface area, MoS2 nanosheets have a high loading capability, providing an effective strategy for synthesizing highly sensitive photoacoustic contrast agents by loading the optical dyes onto its surface [23–27]. Once loaded onto the MoS2 nanosheets surface, the optical dye is stabilized, and its internal blood circulation time is significantly prolonged. This high loading capability of MoS2 nanosheets and synergetic absorbance of optical dye along with MoS2 nanosheets endow the agent with a high optical absorption characteristic, making it a suitable candidate for photoacoustic molecular imaging applications.
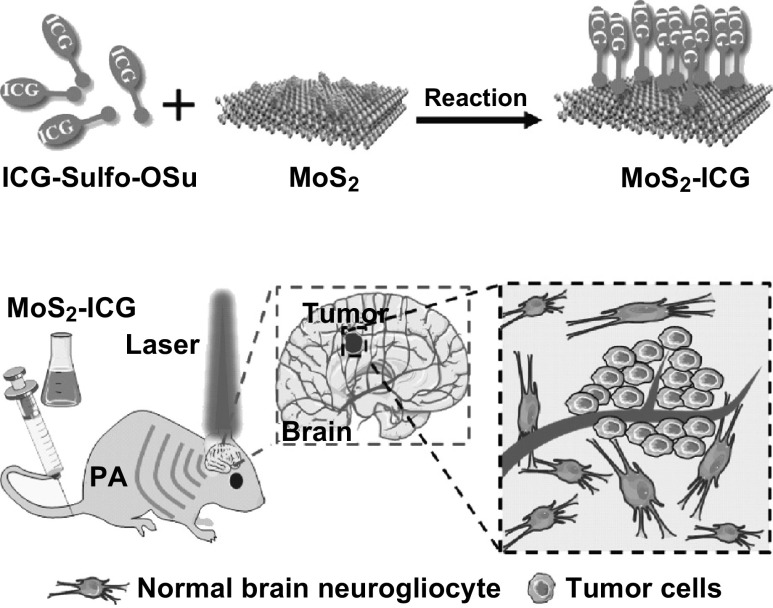
Herein, we developed a covalently conjugating strategy for the synthesis of a MoS2–indocyanine green (ICG) hybrid for in vivo photoacoustic imaging of orthotropic glioma at deep site (Scheme 1). ICG is an FDA-approved optical dye with a high NIR extinction coefficient [28, 29]. By conjugating ICG with MoS2 nanosheets, the absorption peak of MoS2–ICG is redshifted to 800 nm, much longer than that of MoS2 nanosheets (800 vs 675 nm), enabling photoacoustic imaging at longer wavelength to achieve greater penetration depth and lower background noise [27, 30, 31]. In vitro studies were carried out to validate the optical and photoacoustic performance of MoS2–ICG by comparing it with MoS2 in our previous study [22]. Next, the hybrid was applied for in vivo photoacoustic imaging of orthotopic glioma, and the high sensitivity in deep glioma visualization was demonstrated.
Scheme 1.
Schematic of MoS2–ICG hybrid synthesis and its application in photoacoustic (PA) imaging of orthotopic brain glioma
Experimental
Materials
MoS2 was purchased from Sigma-Aldrich (St. Louis, MO, USA). Bovine serum albumin (BSA) was obtained from Biosharp (Seoul, Korea). Dulbecco’s modified Eagle’s medium (DMEM), fetal bovine serum (FBS), trypsin–EDTA solution, and phosphate-buffered saline (PBS) were purchased from Gibco (Grand Island, NY, USA). Cell counting kit-8 (CCK-8) and 4′,6-diamidino-2-phenylindole (DAPI) were obtained from Dojindo (Tokyo, Japan). ICG-Sulfo-OSu was obtained from AAT Bioquest, Inc. (Sunnyvale, CA, USA).
BSA-Assisted Exfoliation of Monolayer MoS2 Nanosheets
Monolayer MoS2 nanosheets were exfoliated by ice-bath sonication in a solution of BSA and water. Briefly, 50 mg of MoS2 powder was added to 10 mL of an aqueous solution containing 10 mg of BSA. The mixed suspension was sonicated in an ice bath for 8 h. After centrifugation at 8000 rpm for 20 min, the supernatant was collected to obtain the monolayer MoS2 nanosheets.
Synthesis of ICG-Conjugated MoS2 Nanosheets (MoS2–ICG)
Monolayer MoS2 nanosheets were covalently conjugated to ICG-Sulfo-NHS, an ICG derivative. Briefly, 1 mg ICG-Sulfo-NHS powder was dissolved in DMSO, and then added to 1 mL MoS2 nanosheets solution (~ 1 mg mL−1) and stirred at 25 °C for 12 h. Unbound ICG-Sulfo-NHS was removed by dialysis (8000–12,000 molecular cutoff) in deionized water for 24 h. The MoS2–ICG hybrid was collected and stored at 4 °C. All procedures were carried out without any direct light exposure. To determine the ICG loading efficiency, the optical absorbance of the dialysate was measured with a UV–Vis spectrometer at 780 nm and compared against a calibration curve to calculate the amount of unbound ICG. Conjugated ICG in MoS2 nanosheets was determined as unbound ICG subtracted from the total ICG used. The loading efficiency was calculated as W1/W2 × 100%, where W1 represents the weight of the conjugated ICG in MoS2 nanosheets and W2 is the weight of MoS2.
Characterization
Atomic force microscopy (AFM) images were captured with a Bruker microscope (Billerica, MA, USA). Fourier transform infrared (FTIR) spectra measurement was carried out using an FTIR spectrometer (Bruker Vertex 80 V). UV–Vis–NIR spectra were detected with a UV–Vis–NIR spectrophotometer (PerkinElmer Lambda 750, Waltham, MA, USA). Fluorescence spectra were measured with a Luminescence Spectrometer (LS 55, Perkin–Elmer). Cell viability was detected by a multimode reader (BioTek SynergyTM 4, Winooski, VT, USA). The concentration of MoS2 was measured by ICP-OES (PE ICP-OES Optima 7000DV, PerkinElmer, USA). Our custom-built acoustic resolution photoacoustic microscopy (AR-PAM) system was used for all photoacoustic measurements. The AR-PAM system consists of a tunable pulsed optical parametric oscillator (OPO) laser (Vibrant 355 II HE, Opotek, Carlsbad, USA), a focused ultrasound transducer (V315-SU, Olympus IMS, Waltham, USA; central frequency: 10 MHz; fractional bandwidth: 6 MHz; N.A.: 0.4), and a precision motorized 3D scanning stage (PSA2000-11, Zolix, Beijing, China).The lateral resolution of AR-PAM was measured to be 220 μm (theoretically calculated to be 210 μm) and the imaging depth reached ~ 10 mm as demonstrated in our previous study [29]. Detailed information regarding the system is given in supplementary information (Fig. S1).
Cell Line and Animal Model
The human brain glioma cell line U87 was obtained from American Type Culture Collection (Manassas, VA, USA) and cultured in DMEM media supplemented with 10% FBS and 1% penicillin–streptomycin solution in a humidified incubator (5% CO2 at 37 °C). Balb/c nude mice (3–5 weeks old) were purchased from the Medical Experimental Animal Center of Guangdong Province (Guangzhou, China). For orthotopic glioma model establishment, 1 × 10⁶ U87 tumor cells in 6 μL PBS were injected into the striatum: Bregma 2.0 mm, left lateral 2.0 mm, depth 3.4 mm. The tumor growth was monitored by MRI (3T Magnetom Trio, Erlangen, Germany). All animal handling and experimental procedures were approved by the Animal Study Committee of Shenzhen Institutes of Advanced Technology, Chinese Academy of Sciences.
Cellular Uptake of MoS2–ICG
Fluorescence imaging was applied to confirm the internalization of MoS2–ICG into tumor cells. U87 cells were first cultured in a confocal dish for 24 h, and then mixed with MoS2–ICG or free ICG (~ 0.2 mg mL−1) for 1, 3, and 8 h incubation. Free MoS2 nanosheets were removed from the cells by washing three times with PBS. The treated cells were fixed with paraformaldehyde solution (4%) for 8 min followed by DAPI (10 μg mL−1) for 3 min. Fluorescence images of the cells were captured with a Leica TCS SP5 confocal laser scanning microscope (Wetzlar, Germany; Ex = 405 and 633 nm for DAPI and ICG, respectively).
In Vitro Biocompatibility
For the cytotoxicity assay, U87 cells were plated in a 96-well plate (5 × 10⁴ cells per well) and cultured for 24 h. Next, the cells were treated with different concentrations of MoS2–ICG (0.1, 0.2, 0.5, and 1 mg mL−1) for 24 h. Relative cell viability (RCV) was assessed by CCK-8 assay and then determined in a 96-well plate reader (BioTek Synergy™ 4) at 450 nm with Eq. 1:
| 1 |
where At, Apc, and Anc represent the absorbance of the tested group, positive control, and negative control, respectively. In addition, the whole blood of Balb/c nude mice was collected and centrifuged (1500 rpm, 3 min) to separate the red blood cells (RBCs). The RBCs were further washed with PBS three times. Next, 10% RBCs (v/v, in PBS) were incubated with different concentrations of MoS2–ICG (25, 50, 100, 150, 200, and 300 μg mL−1) at 37 °C for 3 h. After centrifugation (10,000 rpm, 1 min), the supernatant was collected and analyzed with a UV–Vis–NIR spectrometer at 541 nm. The hemolytic percentage (HP) is calculated using Eq. 2:
| 2 |
where Dt, Dpc, and Dnc are the absorbance of the tested sample and the positive (deionized water) and negative (PBS) controls, respectively.
In Vitro Photoacoustic Measurement
Monolayer MoS2 and MoS2–ICG water solutions containing the same concentration of MoS2 or different concentrations (1, 0.5, 0.25, and 0.125 mg mL−1) of MoS2–ICG were mixed with agarose gel (1.5%) at a 1:1 ratio and measured by AR-PAM under 800 nm laser irradiation to characterize their photoacoustic performance. The MoS2–ICG sample with the highest concentration was further covered with a mouse skull, and the photoacoustic cross-sectional B-scan images of the sample were obtained under 675- and 800-nm pulsed laser excitation, respectively. The pulse energy at both wavelengths before and after penetrating the skull was recorded with an energy meter (Nova II, Ophir, Jerusalem, Israel). Furthermore, MoS2–ICG was mixed (at 0–4 °C) with Matrigel matrix at a 1:1 ratio and then injected into the lower flank of mouse subcutaneously. After the sample mixture solidified, the injected region was imaged by AR-PAM under 675- and 800-nm pulsed laser excitation. The signal-to-noise ratio (SNR) was calculated as Eq. 3:
| 3 |
where S is the signal and N is the noise.
In Vivo Photoacoustic Imaging of Orthotopic Glioma
Mice bearing orthotopic U87 glioma were anesthetized with a 2% isoflurane/oxygen mixture and placed in the prone position. Photoacoustic imaging of the tumor region was performed by AR-PAM under 800-nm laser irradiation before and at 1, 3, and 5 h post-intravenous injection of MoS2–ICG (100 μL, 1 mg mL−1). Ultrasound images of the tumor region were captured simultaneously with AR-PAM.
In Vivo Biocompatibility of MoS2–ICG
Healthy Balb/c mice (5 mice in total) were intravenously injected with 10 mg kg−1 MoS2–ICG (150 μL). At days 1 and 15 post-injection, mouse blood was collected via orbit for complete blood panel testing at Shenzhen Center for Disease and Prevention. Furthermore, major organs from the MoS2–ICG-treated mice were harvested, including the heart, liver, kidney, lung, and spleen. The organ tissues were stained with hematoxylin and eosin (H&E) and examined under a digital microscope (Olympus, CX31, Tokyo, Japan) after fixation in 10% neutral-buffered formalin, embedding into paraffin and sectioning at 5 mm thickness.
Results and Discussion
Synthesis and Characterization of MoS2–ICG Hybrid
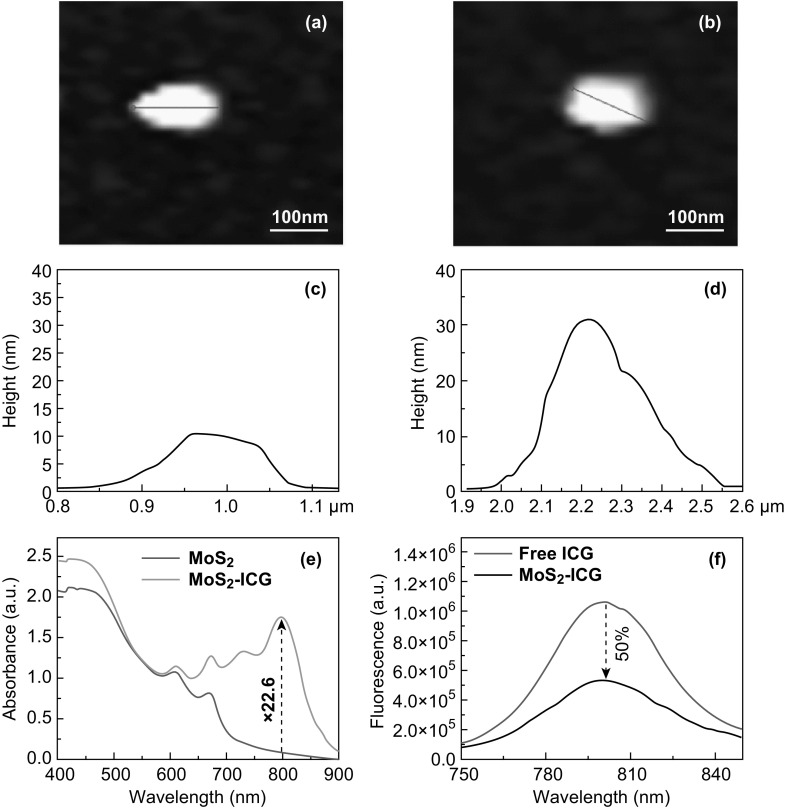
Albumin-capped MoS2 nanosheets with single-layer nanostructure were prepared by protein-assisted exfoliation [22]. The obtained MoS2 nanosheets were conjugated with ICG through EDC crosslinking reaction, and the products were further purified by 24-h dialysis. Compared to ICG and MoS2 alone, a more intense peak at ~ 1650 cm−1 was observed from the FTIR spectrum of MoS2–ICG (Fig. S2), indicating the presence of a –NH–CO–bond between MoS2 and ICG and successful covalent conjugation of ICG to BSA via an esterification reaction [29]. The morphology and nanostructures of MoS2–ICG hybrid were investigated by AFM and TEM imaging. As shown in Figs. 1a–d and S3, the prepared MoS2–ICG showed a sheet-like morphology, and the edge thickness of both MoS2–ICG and MoS2 was 0.65 nm, revealing a single-layer structure [22, 32]. The middle thickness of MoS2–ICG increased from 11.2 to 32.5 nm compared to MoS2 nanosheets, indicating the success of ICG conjugation. The size distribution of MoS2–ICG was 50–250 nm, with an average diameter of 122 nm (Fig. S4). The polydispersity index and zeta potential of MoS2–ICG were 0.208 and − 24.6 mV, respectively (Fig. S5). The average diameter of MoS2–ICG did not change over 7 days in water, PBS, FBS, and cell media (Fig. S6), or at pH 6.8 condition (Fig. S7), demonstrating the good stability of the hybrid.
Fig. 1.
a, b AFM images and c, d thickness profiles of MoS2 (a, c) and MoS2–ICG (b, d). e Absorbance spectra of MoS2 and MoS2–ICG at the same concentration of MoS2. f Fluorescence spectra of free ICG and MoS2–ICG at the same concentration of ICG
The ICG loading efficacy of MoS2–ICG was calculated to be 23.5%, which is higher than that of human serum albumin encapsulated nanoparticles (11%) [28], demonstrating that MoS2 with unique layer nanostructure and high large specific surface area favored the absorption of small optical dyes. The optical properties of MoS2 nanosheets were significantly altered after the loading of ICG. As shown in Fig. 1e, the optical absorbance of MoS2–ICG at the peak wavelength (800 nm) was significantly higher than that of MoS2 (Fig. 1e) because of the conjugation of ICG. (ICG loading efficiency was calculated to be 23.5%.) The absorbance intensity of MoS2–ICG was 22.6-fold (vertical dashed line in Fig. 1e) higher than that of MoS2 nanosheets under the same concentration. In addition, the NIR absorption spectrum of MoS2–ICG was expanded compared to that of ICG, with a redshift of the absorbance peak by 20 nm (from 780 to 800 nm) (Fig. S8). The broadened NIR spectrum and redshift of the absorbance peak occurred presumably because of the covalent conjugation of ICG onto the MoS2 surface, resulting in local aggregation of ICG molecules into oligomers [33–35]. After conjugating ICG to MoS2 nanosheets, the fluorescence of MoS2–ICG decreased by nearly 50% compared to free ICG at the same concentration of ICG (Fig. 1f), likely due to the fluorescence quenching effect induced by ICG aggregation and FRET (fluorescence/Förster resonance energy transfer) photoacoustic effect as reported previously [29, 36–40]. The decreased fluorescence intensity leads to greater photothermal conversion. Therefore, the photothermal/photoacoustic conversion efficiency of MoS2–ICG was enhanced compared to that of free ICG.
Photoacoustic Properties of MoS2–ICG Hybrid
The photoacoustic properties of MoS2–ICG were investigated with our custom-built AR-PAM system [22]. As shown in Fig. 2a, the photoacoustic signal of MoS2–ICG was nearly 16-fold higher than that of MoS2 under 800-nm laser excitation at the same concentration of MoS2, suggesting that the conjugation of ICG significantly enhanced the photoacoustic sensitivity of MoS2 nanosheets. Figure 2b shows that the photoacoustic signal of MoS2–ICG was linearly dependent on its concentration (R2= 0.99) when the concentration range was between 0.125 and 1 mg mL−1. No obvious photoacoustic signal attenuation was detected after MoS2–ICG was irradiated with 5000 laser pulses with 5 mJ cm−2 laser fluence (Fig. 2c), indicating the excellent photostability of the hybrid.
Fig. 2.

a Photoacoustic (PA) signal comparison of MoS2 and MoS2–ICG at the same concentration of MoS2. Photoacoustic signals of b MoS2–ICG at different concentrations and c MoS2–ICG illuminated with 5000 laser pulses
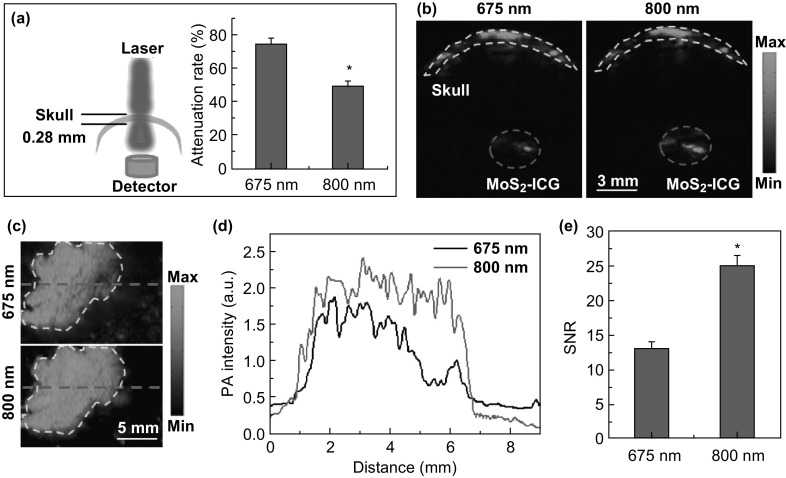
The laser energy attenuation for both 675- and 800-nm pulsed laser wavelengths was detected after penetrating through the mouse skull as shown in Fig. 3a. Compared to 675 nm, the 800-nm wavelength enabled greater laser energy penetration, mainly because of decreased optical scattering of the skull at the longer wavelength. Figure 3b shows the photoacoustic cross-sectional B-scan images of MoS2–ICG covered with the mouse skull under both 675- and 800-nm pulsed laser excitation at the same illumination energy. A higher photoacoustic signal was observed at 800-nm compared to that at 675 nm, mainly due to the more penetrated laser energy and higher optical absorbance at that wavelength. Further, the MoS2–ICG mixed with Matrigel matrix was subcutaneously injected into the mouse back and excited by 675- and 800-nm pulsed laser to obtain the photoacoustic maximum amplitude projection (MAP) images as shown in Fig. 3c. To quantify the in vivo photoacoustic performance with the two excitation wavelengths, the same dashed line was drawn on the two MAP images in Fig. 3c, and the photoacoustic signal intensity along the dashed line was plotted (Fig. 3d). The peak intensity of 800-nm wavelength was approximately 1.35-fold higher than that of 675 nm, which is consistent with the absorbance difference at the two wavelengths. Figure 3e further shows the SNR comparison of the photoacoustic MAP images at the two wavelengths. The 1.55-fold higher SNR for 800-nm excitation attributed to not only the higher photoacoustic signal intensity of MoS2–ICG at this wavelength (Fig. 3d), but also the lower background noise (Fig. 3c, d), as less tissue absorption and scattering occurred at the 800-nm wavelength. Thus, it is indicated that 800-nm pulsed laser is more suitable for in vivo MoS2–ICG enhanced photoacoustic imaging of brain glioma.
Fig. 3.
a Attenuation rate of 675- and 800-nm pulsed laser after penetrating the mouse skull. b Photoacoustic cross-sectional B-scan images of MoS2–ICG covered with mouse skull under 675- and 800-nm laser excitation. Yellow dashed line delineates the outline of the skull. Red circle indicates the MoS2–ICG sample. c Photoacoustic MAP images of mouse back post-subcutaneous injection of MoS2–ICG under 675- and 800-nm laser excitation. The enclosed area by the yellow dashed line indicates the injected region. d Photoacoustic signal intensity plot corresponding to the two red dashed lines in c. e SNR of photoacoustic images under 675- and 800-nm laser excitation in c
Cellular Uptake and in Vitro Biocompatibility of MoS2–ICG Hybrid
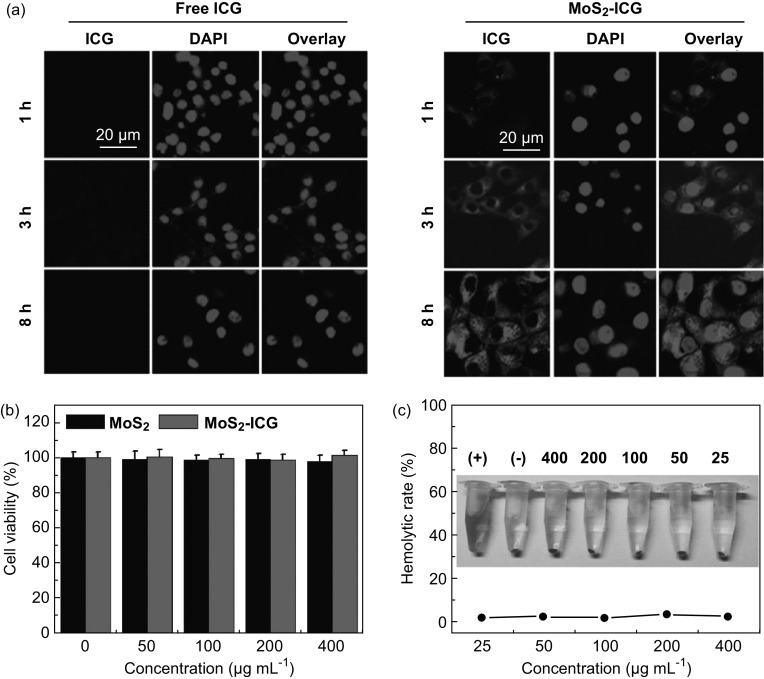
The cellular uptake behavior of MoS2–ICG hybrid was investigated by confocal microscopy. ICG fluorescence signals were observed in the cytoplasm of MoS2–ICG-treated U87 glioma cells at different time points (1, 3, and 8 h). As shown in Fig. 4a, numerous MoS2–ICG nanoprobes entered the cells and centered at the cytoplasm. The enhanced cellular uptake and internalization of MoS2–ICG occurred presumably through the albumin receptor-mediated endocytosis pathway in U87 glioma cells, which improved cell uptake efficiency and enhanced tumor cell targeting [22]. As shown in Fig. 4b, the cytotoxicity of MoS2–ICG and MoS2 on cells was determined by the standard CCK-8 assay. No obvious cytotoxicity was observed in U87 glioma cells after treatment with different concentrations (50, 100, 200, and 400 μg mL−1) of MoS2–ICG and MoS2 nanosheets. Moreover, the effect of MoS2–ICG on the hemolytic behavior of RBCs was also investigated and is shown in Fig. 4c. PBS and deionized water were used as negative and positive controls, respectively. The hemolysis percentages were lower than 2.5% at all tested MoS2–ICG concentrations from 25 to 400 μg mL−1 (Fig. 4c), indicating that MoS2–ICG did not induce hemolysis. These result demonstrated that MoS2–ICG had good biocompatibility in vitro.
Fig. 4.
a Confocal fluorescence images of U87 glioma cells incubated with free ICG and MoS2–ICG for 1, 3, and 8 h. Blue shows fluorescence of DAPI and red shows fluorescence of ICG. b Viability of U87 glioma cells incubated with different concentrations of MoS2–ICG for 24 h. c Hemolysis percentage of RBCs after treatment with different concentrations of MoS2–ICG for 3 h. (+) and (−) each indicates distilled water and PBS as positive and negative controls. The inset photograph shows the direct observation of hemolysis
In Vivo Photoacoustic Imaging of MoS2–ICG in Orthotopic Glioma Model
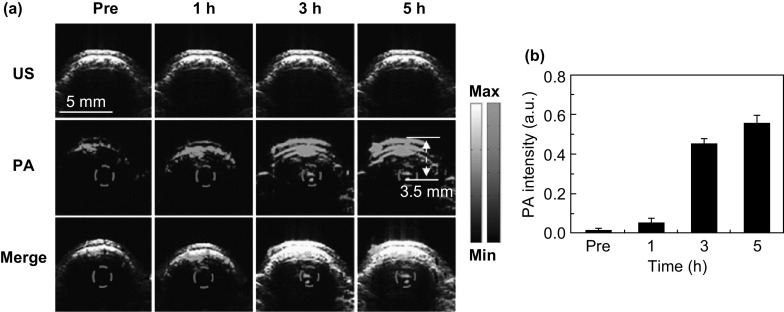
The success of tumor model establishment was confirmed by the MRI results (Fig. S9). Figure 5a shows the cross-sectional (B-scan) ultrasound, photoacoustic, and their merged images of the tumor region before and after the tail-vein injection of MoS2–ICG. The ultrasound images were used to provide the boundary information of the tumor, as well as to confirm the site of the tumor during the experiment. The photoacoustic images further show the depth resolved distribution of MoS2–ICG in the tumor region at high resolution. The merged images therefore contain both structural and molecular information, which is vital for a variety of medical applications such as imaging guided photothermal therapy of tumors. As shown in Fig. 5a, photoacoustic signals of the blood vessels in the mouse scalp, skull, and brain were observed prior to MoS2–ICG injection (Pre in Fig. 5a). No obvious photoacoustic signals were observed at the tumor site (red circle) before and 1 h after MoS2–ICG injection. However, at 3 and 5 h post-injection, photoacoustic signals were clearly visualized at the tumor site because of the accumulation of MoS2–ICG. The multiple (three) layers at 3 and 5 h in Fig. 5a correspond to the contrast agent-enhanced scalp, skull, and brain cortex. Quantitative analysis of the photoacoustic signal enhancement in the tumor region at different time points post-injection was also performed. As can be seen from Fig. 5b, the photoacoustic signal gradually increased from 1 to 5 h after the injection of MoS2–ICG, indicating more and more accumulation of the hybrid in the tumor region. The specific accumulation of MoS2–ICG in tumor was presumably due to the enhanced permeability and retention (EPR) effect of the tumor and the albumin receptor-mediated tumor targeted effect of the MoS2–ICG hybrid. The hybrid has an average diameter of 122 nm, which is in accordance with the report that nanoparticles with average size in range of 10–200 nm possess better EPR effect in solid tumor [41]. In addition, the BSA coating on the surface of MoS2–ICG endows the hybrid with great biocompatibility, resulting in prolonged blood circulation time and more tumor accumulation. The maximum imaging depth of the tumor site was measured as 3.5 mm beneath the scalp, which can be seen from both the photoacoustic and the MRI cross-sectional images (Figs. 5a and S9b). Compared with our previous study that used MoS2 as contrast agent, the imaging depth in this study is enhanced by twofold. Furthermore, to the best of our knowledge, the photoacoustic imaging depth reported in this study is one of the deepest for all the photoacoustic glioma imaging research reported so far by using the nanoprobe in the NIR I spectral region (see Table S1). Table S1 illustrates the comparison of the imaging depth and applied laser wavelength for the reported glioma photoacoustic imaging studies using various types of nanoparticles in the NIR I spectral region [20–22, 42–45]. It can be seen that by using the highly sensitive MoS2–ICG hybrid reported in this study and an excitation wavelength at 800 nm, the imaging depth as large as 3.5 mm has been reached.
Fig. 5.
a B-scan ultrasound (US), photoacoustic (PA), and their merged images of the brain tumor region before and at 1, 3, and 5 h after intravenous injection of MoS2–ICG. The ultrasound images were used to delineate the scalp and skull of the mouse. The photoacoustic signals in the red circles show the accumulation and distribution of MoS2–ICG within the brain glioma. b Quantification results of photoacoustic signals in the tumor region at different time points before and after MoS2–ICG injection
In Vivo Biocompatibility of MoS2–ICG
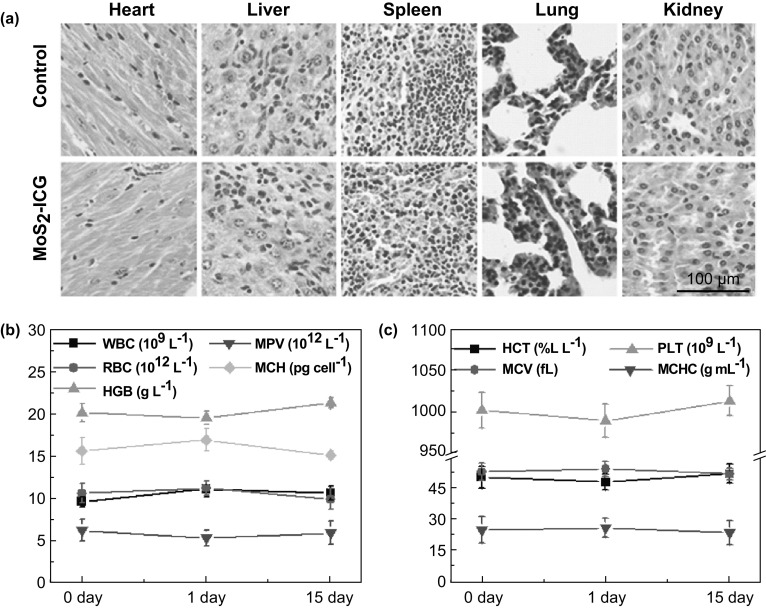
Histology analysis and a blood assay were used to evaluate the in vivo biocompatibility of MoS2–ICG. H&E staining images of the major organs, including the heart, liver, spleen, lung, and kidney, revealed no obvious damage or inflammation in the MoS2–ICG-treated group and control group (Fig. 6a). Moreover, no significant difference in blood panel parameters between the MoS2–ICG-treated group and control group was found (Fig. 6b, c), indicating that MoS2–ICG did not affect normal blood function with excellent histocompatibility. The great in vivo biocompatibility was likely due to the endogenic protein BSA coating on the MoS2 nanosheets.
Fig. 6.
a Representative H&E-stained images of the major organs including the heart, liver, spleen, lung, and kidney collected from control group mice and mice treated with MoS2–ICG. b, c Blood analysis of MoS2–ICG-treated group mice. WBC number of white blood cells; RBC number of red blood cells; MPV mean platelet volume; MCH mean corpuscular hemoglobin; HGB concentration of hemoglobin; HCT hematocrit; MCV mean corpuscular volume; MCHC mean corpuscular hemoglobin concentration; PLT platelets
Conclusions
In summary, a MoS2–ICG hybrid was successfully prepared and applied for in vivo photoacoustic imaging of deep-sitting orthotopic brain glioma. Covalent conjugation of ICG and MoS2 is facile by mixing ICG-Sulfo-NHS and monolayer MoS2 nanosheets. The high imaging sensitivity of MoS2–ICG was validated, and potential causes were investigated and found to be: (1) strong optical absorbance across a broad NIR spectrum, enabling high photoacoustic signal generation; (2) redshifting of the MoS2–ICG absorption peak, enabling deeper penetration and lower background for in vivo imaging applications and (3) reduced ICG fluorescence due to the aggregation induced fluorescence quenching and FRET photoacoustic effect, enabling more energy to be converted to photoacoustic signal emission. Cellular uptake experiments showed that MoS2–ICG was internalized into the cytoplasm of U87 glioma cells with high efficiency. Both in vitro and in vivo studies showed that MoS2–ICG has excellent biocompatibility. In vivo photoacoustic imaging of orthotopic brain glioma demonstrated that the tumor mass sitting 3.5 mm below the scalp can be clearly identified through the enhancement by MoS2–ICG, which is nearly twofold deeper than that in our previous report using MoS2 nanosheets and to the best of our knowledge, is one of the deepest among all the glioma photoacoustic imaging studies reported so far by using the nanoprobe in the NIR I spectral region. Notably, the depth of photoacoustic molecular imaging depends on both the sensitivity of the imaging probes and the performance of the imaging system. While the effort for pursuing novel imaging probes with higher sensitivity should be a sustained ongoing process, photoacoustic imaging implementation with centimeter penetration depth capability such as photoacoustic computed tomography system should also be employed to translate the current study further on bigger animal models or even human beings. To conclude, the distinctive performance of MoS2–ICG, combined with the unique capability of photoacoustic imaging, reveals its potential for highly sensitive and accurate glioma detection in future translational medicine.
Electronic supplementary material
Below is the link to the electronic supplementary material.
Acknowledgements
The authors gratefully acknowledge the following Grants support: National Natural Science Foundation of China (NSFC) Grants 91739117, 81522024, 81427804, 61405234, 81430038 and 61475182; National Key Basic Research (973) Program of China Grant 2014CB744503 and 2015CB755500; Guangdong Natural Science Foundation Grant 2014B050505013 and 2014A030312006; Shenzhen Science and Technology Innovation Grant JCYJ20170413153129570, JCYJ20160531175040976, JCYJ20150521144321005, JCYJ20160608214524052, JCYJ20160422153149834; JCYJ20150731154850923; SIAT Innovation Program for Excellent Young Researchers 201510.
Footnotes
Chengbo Liu, Jingqin Chen and Ying Zhu are contributed equally to this work.
Contributor Information
Zonghai Sheng, Email: zh.sheng@siat.ac.cn.
Liang Song, Email: liang.song@siat.ac.cn.
References
- 1.de Robles P, Fiest KM, Frolkis AD, Pringsheim T, Atta C, St Germaine-Smith C, Day L, Lam D, Jette N. The worldwide incidence and prevalence of primary brain tumors: a systematic review and meta-analysis. Neuro-Oncology. 2014;17(6):776–783. doi: 10.1093/neuonc/nou283. [DOI] [PMC free article] [PubMed] [Google Scholar]
- 2.Jiang X, Xin H, Ren Q, Gu J, Zhu L, et al. Nanoparticles of 2-deoxy-d-glucose functionalized poly (ethylene glycol)-co-poly (trimethylene carbonate) for dual-targeted drug delivery in glioma treatment. Biomaterials. 2014;35(1):518–529. doi: 10.1016/j.biomaterials.2013.09.094. [DOI] [PubMed] [Google Scholar]
- 3.Shabihkhani M, Telesca D, Movassaghi M, Naeini YB, Naeini KM, et al. Incidence, survival, pathology, and genetics of adult Latino Americans with glioblastoma. J. Neuro-Oncol. 2017;132(2):351–358. doi: 10.1007/s11060-017-2377-0. [DOI] [PubMed] [Google Scholar]
- 4.Wen PY, Reardon DA. Neuro-oncology in 2015: progress in glioma diagnosis, classification and treatment. Nat. Rev. Neurol. 2016;12(2):69–70. doi: 10.1038/nrneurol.2015.242. [DOI] [PubMed] [Google Scholar]
- 5.Ahmed R, Oborski MJ, Hwang M, Lieberman FS, Mountz JM. Malignant gliomas: current perspectives in diagnosis, treatment, and early response assessment using advanced quantitative imaging methods. Cancer Manag. Res. 2014;24(6):149–170. doi: 10.2147/CMAR.S54726. [DOI] [PMC free article] [PubMed] [Google Scholar]
- 6.Sagiyama K, Mashimo T, Togao O, Vemireddy V, Hatanpaa KJ, et al. In vivo chemical exchange saturation transfer imaging allows early detection of a therapeutic response in glioblastoma. Proc. Natl. Acad. Sci. U.S.A. 2014;111(12):4542–4547. doi: 10.1073/pnas.1323855111. [DOI] [PMC free article] [PubMed] [Google Scholar]
- 7.Wang LV, Hu S. Photoacoustic tomography: in vivo imaging from organelles to organs. Science. 2012;335(6075):1458–1462. doi: 10.1126/science.1216210. [DOI] [PMC free article] [PubMed] [Google Scholar]
- 8.Kim C, Favazza C, Wang LV. In vivo photoacoustic tomography of chemicals: high-resolution functional and molecular optical imaging at new depths. Chem. Rev. 2010;110(5):2756–2782. doi: 10.1021/cr900266s. [DOI] [PMC free article] [PubMed] [Google Scholar]
- 9.Wang X, Pang Y, Ku G, Xie X, Stoica G, Wang LV. Noninvasive laser-induced photoacoustic tomography for structural and functional in vivo imaging of the brain. Nat. Biotechnol. 2003;21(7):803–806. doi: 10.1038/nbt839. [DOI] [PubMed] [Google Scholar]
- 10.Li J, Rao J, Pu K. Recent progress on semiconducting polymer nanoparticles for molecular imaging and cancer phototherapy. Biomaterials. 2018;155:217–235. doi: 10.1016/j.biomaterials.2017.11.025. [DOI] [PMC free article] [PubMed] [Google Scholar]
- 11.Jiang Y, Upputuri PK, Xie C, Lyu Y, Zhang L, Xiong Q, Pramanik M, Pu K. Broadband absorbing semiconducting polymer nanoparticles for photoacoustic imaging in second near-infrared window. Nano Lett. 2017;17(8):4964–4969. doi: 10.1021/acs.nanolett.7b02106. [DOI] [PubMed] [Google Scholar]
- 12.Jiang Y, Pu K. Advanced photoacoustic imaging applications of near-infrared absorbing organic nanoparticles. Small. 2017;13(30):1700710. doi: 10.1002/smll.201700710. [DOI] [PubMed] [Google Scholar]
- 13.Lyu Y, Zhen X, Miao Y, Pu K. Reaction-based semiconducting polymer nanoprobes for photoacoustic imaging of protein sulfenic acids. ACS Nano. 2016;11(1):358–367. doi: 10.1021/acsnano.6b05949. [DOI] [PubMed] [Google Scholar]
- 14.Pu K, Shuhendler AJ, Jokerst JV, Mei J, Gambhir SS, Bao Z, Rao J. Semiconducting polymer nanoparticles as photoacoustic molecular imaging probes in living mice. Nat. Nanotechnol. 2014;9(3):233–239. doi: 10.1038/nnano.2013.302. [DOI] [PMC free article] [PubMed] [Google Scholar]
- 15.Li G, Chen Y, Zhang L, Zhang M, Li S, Li L, Wang T, Wang C. Facile approach to synthesize gold nanorod@polyacrylic acid/calcium phosphate yolk–shell nanoparticles for dual-mode imaging and pH/NIR-responsive drug delivery. Nano-Micro Lett. 2018;10(1):7. doi: 10.1007/s40820-017-0155-3. [DOI] [PMC free article] [PubMed] [Google Scholar]
- 16.Luke GP, Yeager D, Emelianov SY. Biomedical applications of photoacoustic imaging with exogenous contrast agents. Ann. Biomed. Eng. 2012;40(2):422–437. doi: 10.1007/s10439-011-0449-4. [DOI] [PubMed] [Google Scholar]
- 17.Gao D, Sheng Z, Liu Y, Hu D, Zhang J, Zhang X, Zheng H, Yuan Z. Protein-modified CuS nanotriangles: a potential multimodal nanoplatform for in vivo tumor photoacoustic/magnetic resonance dual-modal imaging. Adv. Healthc. Mater. 2017;6(1):1601094. doi: 10.1002/adhm.201601094. [DOI] [PubMed] [Google Scholar]
- 18.Copland JA, Eghtedari M, Popov VL, Kotov N, Mamedova N, Motamedi M, Oraevsky AA. Bioconjugated gold nanoparticles as a molecular based contrast agent: implications for imaging of deep tumors using optoacoustic tomography. Mol. Imaging Biol. 2004;6(5):341–349. doi: 10.1016/j.mibio.2004.06.002. [DOI] [PubMed] [Google Scholar]
- 19.Mallidi S, Luke GP, Emelianov S. Photoacoustic imaging in cancer detection, diagnosis, and treatment guidance. Trends Biotechnol. 2011;29(5):213–221. doi: 10.1016/j.tibtech.2011.01.006. [DOI] [PMC free article] [PubMed] [Google Scholar]
- 20.Kircher MF, De La Zerda A, Jokerst JV, Zavaleta CL, Kempen PJ, et al. A brain tumor molecular imaging strategy using a new triple-modality MRI-photoacoustic-Raman nanoparticle. Nat. Med. 2012;18(5):829–834. doi: 10.1038/nm.2721. [DOI] [PMC free article] [PubMed] [Google Scholar]
- 21.Fan Q, Cheng K, Yang Z, Zhang R, Yang M, et al. Perylene-diimide-based nanoparticles as highly efficient photoacoustic agents for deep brain tumor imaging in living mice. Adv. Mater. 2015;27(5):843–847. doi: 10.1002/adma.201402972. [DOI] [PMC free article] [PubMed] [Google Scholar]
- 22.Chen J, Liu C, Hu D, Wang F, Wu H, et al. Single-layer MoS2 nanosheets with amplified photoacoustic effect for highly sensitive photoacoustic imaging of orthotopic brain tumors. Adv. Funct. Mater. 2016;26(47):8715–8725. doi: 10.1002/adfm.201603758. [DOI] [Google Scholar]
- 23.Luo Y, Zhang Y, Zhao Y, Fang X, Ren J, et al. Aligned carbon nanotube/molybdenum disulfide hybrids for effective fibrous supercapacitors and lithium ion batteries. J. Mater. Chem. A. 2015;3:17553–17557. doi: 10.1039/C5TA04457J. [DOI] [Google Scholar]
- 24.Ma X, Shi M. Thermal evaporation deposition of few-layer MoS2 films. Nano-Micro Lett. 2013;5(2):135–139. doi: 10.1007/BF03353741. [DOI] [Google Scholar]
- 25.Loo AH, Bonanni A, Ambrosi A, Pumera M. Molybdenum disulfide (MoS2) nanoflakes as inherently electroactive labels for DNA hybridization detection. Nanoscale. 2014;6:11971–11975. doi: 10.1039/C4NR03795B. [DOI] [PubMed] [Google Scholar]
- 26.Wang YW, Fu YY, Peng QL, Guo SS, Liu G, Li J, Yang HH, Chen GN. Dye-enhanced graphene oxide for photothermal therapy and photoacoustic imaging. J. Mater. Chem. B. 2013;1:5762–5767. doi: 10.1039/c3tb20986e. [DOI] [PubMed] [Google Scholar]
- 27.Liu Y, Kang N, Lv J, Zhou Z, Zhao Q, Ma L, Chen Z, Ren L, Nie L. Deep photoacoustic/luminescence/magnetic resonance multimodal imaging in living subjects using high-efficiency upconversion nanocomposites. Adv. Mater. 2016;28(30):6411–6419. doi: 10.1002/adma.201506460. [DOI] [PubMed] [Google Scholar]
- 28.Sheng Z, Hu D, Zheng M, Zhao P, Liu H, et al. Smart human serum albumin-indocyanine green nanoparticles generated by programmed assembly for dual-modal imaging-guided cancer synergistic phototherapy. ACS Nano. 2014;8(12):12310–12322. doi: 10.1021/nn5062386. [DOI] [PubMed] [Google Scholar]
- 29.Chen J, Liu C, Zeng G, You Y, Wang H, et al. Indocyanine green loaded reduced graphene oxide for in vivo photoacoustic/fluorescence dual-modality tumor imaging. Nanoscale Res. Lett. 2016;11(1):85. doi: 10.1186/s11671-016-1288-x. [DOI] [PMC free article] [PubMed] [Google Scholar]
- 30.Sheng Z, Hu D, Xue M, He M, Gong P, Cai L. Indocyanine green nanoparticles for theranostic applications. Nano-Micro Lett. 2013;5(3):145–150. doi: 10.1007/BF03353743. [DOI] [Google Scholar]
- 31.Wang XH, Peng HS, Yang W, Ren ZD, Liu XM, Liu YA. Indocyanine green-platinum porphyrins integrated conjugated polymer hybrid nanoparticles for near-infrared-triggered photothermal and two-photon photodynamic therapy. J. Mater. Chem. B. 2017;5(9):1856–1862. doi: 10.1039/C6TB03215J. [DOI] [PubMed] [Google Scholar]
- 32.Guan G, Zhang S, Liu S, Cai Y, Low M, et al. Protein induces layer-by-layer exfoliation of transition metal dichalcogenides. J. Am. Chem. Soc. 2015;137(19):6152–6155. doi: 10.1021/jacs.5b02780. [DOI] [PubMed] [Google Scholar]
- 33.Devoisselle JM, Soulie-Begu S, Maillols H, Desmettre T, Mordon SR. Wavelength-resolved measurements of fluorescence lifetime of indocyanine green. J. Biomed. Opt. 2011;16(6):067010. doi: 10.1117/1.3593386. [DOI] [PubMed] [Google Scholar]
- 34.Kneipp J, Kneipp H, Rice WL, Kneipp K. Optical probes for biological applications based on surface-enhanced Raman scattering from indocyanine green on gold nanoparticles. Anal. Chem. 2005;77(8):2381–2385. doi: 10.1021/ac050109v. [DOI] [PubMed] [Google Scholar]
- 35.Li Y, Wen T, Zhao R, Liu X, Ji T, et al. Localized electric field of plasmonic nanoplatform enhanced photodynamic tumor therapy. ACS Nano. 2014;8(11):11529–11542. doi: 10.1021/nn5047647. [DOI] [PubMed] [Google Scholar]
- 36.Hu D, Zhang J, Gao G, Sheng Z, Cui H, Cai L. Indocyanine green-loaded polydopamine-reduced graphene oxide nanocomposites with amplifying photoacoustic and photothermal effects for cancer theranostics. Theranostics. 2016;6(7):1043–1052. doi: 10.7150/thno.14566. [DOI] [PMC free article] [PubMed] [Google Scholar]
- 37.Wang Y, Wang LV. Förster resonance energy transfer photoacoustic microscopy. J. Biomed. Opt. 2012;17(8):0860071. doi: 10.1117/1.JBO.17.8.086007. [DOI] [PMC free article] [PubMed] [Google Scholar]
- 38.Wang Y, Xia J, Wang LV. Deep-tissue photoacoustic tomography of Förster resonance energy transfer. J. Biomed. Opt. 2013;18(10):101316. doi: 10.1117/1.JBO.18.10.101316. [DOI] [PMC free article] [PubMed] [Google Scholar]
- 39.Cayre F, Mura S, Andreiuk B, Sobot D, Gouazou S, Desmaële D, Klymchenko AS, Couvreur P. In vivo FRET imaging to predict the risk associated with hepatic accumulation of squalene-based prodrug nanoparticles. Adv. Healthc. Mater. 2018;7(3):1700830. doi: 10.1002/adhm.201700830. [DOI] [PubMed] [Google Scholar]
- 40.Ku G, Zhou M, Song S, Huang Q, Hazle J, Li C. Copper sulfide nanoparticles as a new class of photoacoustic contrast agent for deep tissue imaging at 1064 nm. ACS Nano. 2012;6(8):7489–7496. doi: 10.1021/nn302782y. [DOI] [PMC free article] [PubMed] [Google Scholar]
- 41.Lee JH, Park G, Hong GH, Choi J, Choi HS. Design considerations for targeted optical contrast agents. Quant. Imaging Med. Surg. 2012;2(4):266–273. doi: 10.3978/j.issn.2223-4292.2012.12.04. [DOI] [PMC free article] [PubMed] [Google Scholar]
- 42.Ray A, Wang X, Lee YEK, Hah HJ, Kim G, et al. Targeted blue nanoparticles as photoacoustic contrast agent for brain tumor delineation. Nano Res. 2011;4(11):1163–1173. doi: 10.1007/s12274-011-0166-1. [DOI] [PMC free article] [PubMed] [Google Scholar]
- 43.Lu W, Melancon MP, Xiong C, Huang Q, Elliott A, et al. Effects of photoacoustic imaging and photothermal ablation therapy mediated by targeted hollow gold nanospheres in an orthotopic mouse xenograft model of glioma. Cancer Res. 2011;71(19):6116–6121. doi: 10.1158/0008-5472.CAN-10-4557. [DOI] [PMC free article] [PubMed] [Google Scholar]
- 44.Li ML, Oh JT, Xie X, Ku G, Wang W, Li C, Lungu G, Stoica G, Wang LV. Simultaneous molecular and hypoxia imaging of brain tumors in vivo using spectroscopic photoacoustic tomography. Proc. IEEE Inst. Electr. Electron. Eng. 2008;96(3):481–489. doi: 10.1109/JPROC.2007.913515. [DOI] [Google Scholar]
- 45.Li W, Chen R, Lv J, Wang H, Liu Y, Peng Y, Qian Z, Fu G, Nie L. In vivo photoacoustic imaging of brain injury and rehabilitation by high-efficient near-infrared dye labeled mesenchymal stem cells with enhanced brain barrier permeability. Adv. Sci. 2018;5(2):1700277. doi: 10.1002/advs.201700277. [DOI] [PMC free article] [PubMed] [Google Scholar]
Associated Data
This section collects any data citations, data availability statements, or supplementary materials included in this article.


