. 2018 Oct 23;7:e37857. doi: 10.7554/eLife.37857

Figure 6. Pet1-Di-CNO pups demonstrate a disordered gasp response to the initial asphyxic bout and induced apnea.

(A) Example respiratory traces immediately following the first asphyxia-induced apnea: top trace, from a Pet1-Di-CNO pup that goes on to die during a subsequent bout; bottom trace, from a control-Di-CNO pup (non-Di-expressor). Illustrated are differences in gasp characteristics and components that are plotted in B–D. (B) First gasp size (normalized to body weight). (C) Time to first gasp during initial apnea. (D) Time difference (s, seconds) between gasp intervals. (E) Mean heart rate (HR) between gasp intervals. (F) Baseline ventilatory equivalents per oxygen, V˙E/V˙O2, prior to CNO administration in relation to genotype coupled with CNO exposure (neuron perturbation) and assay survival. Abbreviations: (I–IV) – time difference (s) between 1st and 2nd (I), 2nd and 3rd (II), 3rd and 4th (III), or 4th and 5th (IV) gasps, respectively. Red * or bracket compares Pet1-Di-CNO pups that go on to die versus Pet1-Di-CNO pups that survive. Blue * or bracket compares Pet1-Di-CNO pups that go on to die versus control-Di-CNO pups that survive. Shapes representing fatal bout – diamond (bout 1), triangle (bout 3), square (bout 4). Circles represent pups that survived all bouts. * (p<0.05) and **** (p<0.0001). Variability of baseline breathing and HR pre- versus during CNO exposure (prior to any asphyxic-apnea challenge) for Pet1-Di and control-Di pups is analyzed in Figure 6—figure supplement 1 and Figure 6—figure supplement 2, respectively.

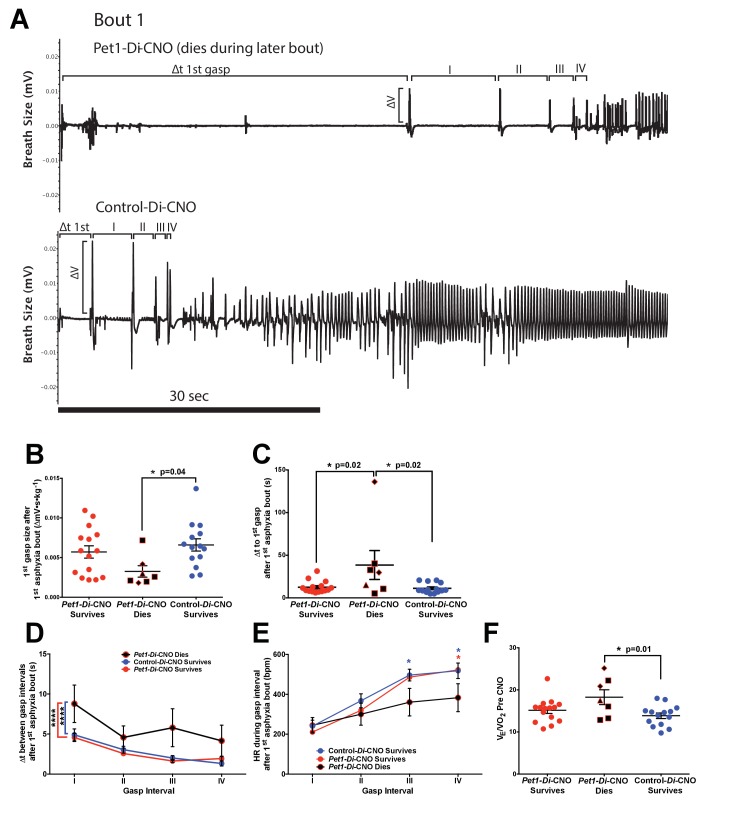
Figure 6.

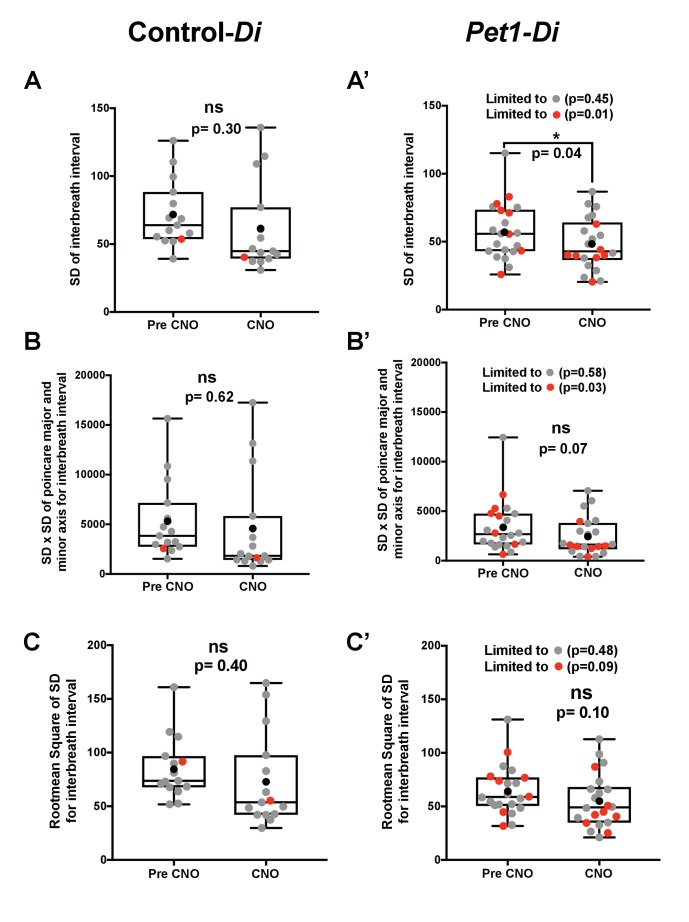
Figure 6—figure supplement 1. Variability for the baseline room air interbreath interval in Control-Di and Pet1-Di pups prior to and during CNO exposure.

Figure 6—figure supplement 1.

(A–C) Control-Di pups; (A’–C’) Pet1-Di pups; gray dots reflect pups that survived all four asphyxia-induced apnea challenges; red dots, pups that died during the assay; black dots reflect the mean; box-whisker plot shows median as the horizontal line, 1st and 3rd quartiles as the ‘box,’ and maximum and minimum values as the ‘whiskers.’ Variability expressed as (A, A’) the standard deviation (SD) of the interbeat interval, (B, B’) the product of the length times the width of the distribution of the Poincare plot, and (C, C’) the root mean square of successive differences (RMSSD). Significant differences pre- versus during CNO exposure were detected for Pet1-Di mice (A’ and B’ as well when limiting analyses to animals that died).
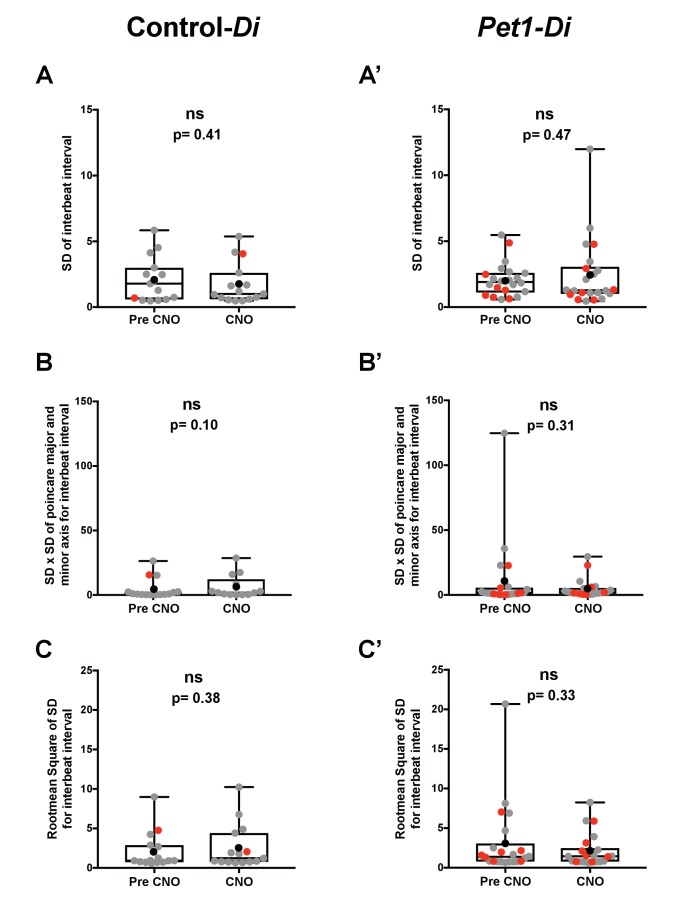
Figure 6—figure supplement 2. Variability for the baseline room air interbeat interval in Control-Di and Pet1-Di pups prior to and during CNO exposure.

Figure 6—figure supplement 2.

(A–C) Control-Di pups; (A’–C’) Pet1-Di pups; gray dots reflect pups that survived all four asphyxia-induced apnea challenges; red dots, pups that died during the assay; black dots reflect the mean; box-whisker plot shows median as the horizontal line, 1st and 3rd quartiles as the ‘box,’ and maximum and minimum values as the ‘whiskers.’ Variability expressed as (A, A’) the standard deviation (SD) of the interbeat interval, (B, B’) the product of the length times the width of the distribution of the Poincare plot, and (C, C’) the root mean square of successive differences (RMSSD). No significant differences pre- versus during CNO exposure were detected for either genotype.