

Many signaling and gene regulatory networks convert graded stimuli into all-or-none switch-like responses. Such ultrasensitivity can produce bistability in cell populations, leading to different cell fates and enhancing survival. We discovered an ultrasensitive response of M. xanthus to nutrient medium addition during development. A small change in nutrient medium concentration caused a profound change in the developmental process. The level of the transcription factor MrpC correlated with multicellular mound formation and differentiation into spores. A threshold level of MrpC is proposed to be necessary to initiate mound formation and create a positive feedback loop that may explain the ultrasensitive response. Understanding how this biological switch operates will provide a paradigm for the broadly important topic of cellular behavior in microbial communities.
KEYWORDS: FruA, MrpC, Myxococcus xanthus, bacterial development, gene regulatory network, sporulation, ultrasensitive response
ABSTRACT
Upon depletion of nutrients, Myxococcus xanthus forms mounds on a solid surface. The differentiation of rod-shaped cells into stress-resistant spores within mounds creates mature fruiting bodies. The developmental process can be perturbed by the addition of nutrient medium before the critical period of commitment to spore formation. The response was investigated by adding a 2-fold dilution series of nutrient medium to starving cells. An ultrasensitive response was observed, as indicated by a steep increase in the spore number after the addition of 12.5% versus 25% nutrient medium. The level of MrpC, which is a key transcription factor in the gene regulatory network, correlated with the spore number after nutrient medium addition. The MrpC level decreased markedly by 3 h after adding nutrient medium but recovered more after the addition of 12.5% than after 25% nutrient medium addition. The difference in MrpC levels was greatest midway during the period of commitment to sporulation, and mound formation was restored after 12.5% nutrient medium addition but not after adding 25% nutrient medium. Although the number of spores formed after 12.5% nutrient medium addition was almost normal, the transcript levels of “late” genes in the regulatory network failed to rise normally during the commitment period. However, at later times, expression from a reporter gene fused to a late promoter was higher after adding 12.5% than after adding 25% nutrient medium, consistent with the spore numbers. The results suggest that a threshold level of MrpC must be achieved in order for mounds to persist and for cells within to differentiate into spores.
IMPORTANCE Many signaling and gene regulatory networks convert graded stimuli into all-or-none switch-like responses. Such ultrasensitivity can produce bistability in cell populations, leading to different cell fates and enhancing survival. We discovered an ultrasensitive response of M. xanthus to nutrient medium addition during development. A small change in nutrient medium concentration caused a profound change in the developmental process. The level of the transcription factor MrpC correlated with multicellular mound formation and differentiation into spores. A threshold level of MrpC is proposed to be necessary to initiate mound formation and create a positive feedback loop that may explain the ultrasensitive response. Understanding how this biological switch operates will provide a paradigm for the broadly important topic of cellular behavior in microbial communities.
INTRODUCTION
Myxococcus xanthus provides an excellent model system to study bacterial interactions, as it can undergo a multicellular developmental process which involves the coordinated movement and differentiation of thousands of cells (reviewed in reference 1). Upon depletion of nutrients, cells alter their movements to form mounds (reviewed in reference 2). The differentiation of rod-shaped cells inside mounds into round stress-resistant spores results in the formation of fruiting bodies, while some cells persist outside as peripheral rods (3). During the developmental process, the majority of the population lyses, and a minority of the cells remain as spores or peripheral rods (4–6). How cells adopt three different fates is unknown. Understanding cell fate determination in this model system has broad potential implications since microbes form communities (microbiomes and biofilms) in which cells differentiate and profoundly impact their environment, including other living organisms (7–11).
The developmental process of M. xanthus is governed by a signal-responsive gene regulatory network (reviewed in reference 12). Starvation triggers the production of intracellular second messenger signals. The intracellular signal guanosine pentaphosphate and guanosine tetraphosphate [(p)ppGpp] leads to production of the extracellular A- and C-signals (13–16). The C-signal is a short-range signal that appears to be a proteolytic fragment of CsgA (17, 18) and/or lipids produced by phospholipase activity of intact CsgA (19). C-signaling appears to posttranslationally activate FruA (5, 20, 21), a transcription factor whose production is controlled by a cascade of transcription factors governed by starvation (reviewed in reference 12) (Fig. 1). The cascade appears to include phosphorylated MrpB (MrpB-P) and MrpC (22, 23) (Fig. 1). MrpC binds to the promoter regions of hundreds of developmentally regulated genes (24), including the promoter region of fruA, where MrpC appears to activate transcription (25) (Fig. 1). FruA and MrpC bind cooperatively to the promoter regions of many genes important for mound formation and/or sporulation (24, 26–30). Among the genes under combinatorial control of FruA and MrpC is the dev operon (26), whose products, DevTRS, negatively autoregulate transcription (31–33) to prevent the overexpression of DevI, an inhibitor of the cellular shape change that leads to spore formation (31, 34) (Fig. 1).
FIG 1.

Simplified model of the gene regulatory network governing M. xanthus development. Starvation increases the level of phosphorylated MrpB (MrpB-P), which activates mrpC transcription. MrpC negatively autoregulates by competing with MrpB-P for binding to the mrpC promoter region. The addition of nutrient medium can halt development by lowering the mrpC transcript level (as described in this study but not depicted in the model) and by inducing proteolysis of MrpC, as depicted here. MrpC activates transcription of the gene for FruA and causes an increase in C-signaling, which posttranslationally activates FruA to FruA*. FruA* promotes mound formation, which enhances short-range C-signaling by bringing cells into proximity, creating a positive feedback loop. FruA* and MrpC bind cooperatively to the promoter region of the dev operon and activate transcription. The resulting DevTRS proteins negatively autoregulate. DevI normally delays cellular shape change leading to spore maturation, but if overproduced, DevI blocks sporulation. A rising level of FruA* in cells within mounds, together with MrpC, activates the transcription of genes involved in commitment to cellular shape change and spore maturation, resulting in spore-filled fruiting bodies. See the text for details and references.
Combinatorial control by FruA and MrpC has been proposed to provide checkpoints for mound formation and persistent starvation, respectively, prior to commitment to sporulation (5, 28, 35). FruA could provide a checkpoint for mound formation if C-signaling activates FruA and activated FruA (designated FruA*) stimulates mound formation, forming a positive feedback loop (Fig. 1). Efficient C-signaling requires cells to move into alignment (36–38), as they do during mound formation (39–41). C-signaling appears to activate FruA (5, 20), but the mechanism of activation is unknown. FruA* may cause methylation of the FrzCD component (42, 43) of the Frz chemosensory system that controls the gliding movements of cells (44), since C-signaling alters cell movements to promote mound formation (45, 46). As mounds form, cells move into alignment, enhancing short-range C-signaling, which would cause FruA* to rise further. The rising level of FruA* would eventually activate genes that commit a cell to form a spore within a mound, provided that MrpC is available to bind cooperatively to promoter regions (Fig. 1).
MrpC could provide a checkpoint for persistent starvation, because MrpC in developing cells is susceptible to proteolysis upon the addition of nutrient medium (35) (Fig. 1). Under submerged culture conditions, in which growing cells are resuspended in starvation buffer and allowed to adhere to the bottom of a plastic container, the cells in the biofilm undergo development (47). Under these conditions, wild-type M. xanthus strain DK1622 forms mounds between 15 and 18 h poststarvation (PS) (35). Sonication-resistant spores form by 27 h PS, and the number of spores increases greatly by 36 to 48 h PS (5, 35). The critical period of commitment to sporulation was found to be between 24 and 30 h PS, since adding nutrient medium before or at 24 h blocked sporulation, whereas adding nutrient medium at 30 h or later did not block sporulation (35). Before and during the commitment period, adding nutrient medium caused the MrpC level to decline rapidly due to proteolysis. Proteolysis of MrpC was proposed to halt the expression of genes required for commitment to sporulation if nutrients reappear.
Sporulation involves cellular shape change and spore maturation (Fig. 1). During maturation, the spore becomes resistant to stresses, such as sonication and heat. One step during maturation is deposition of a polysaccharide coat on the spore surface, and this step is carried out by products of the exo and nfs operons (48, 49). These operons are expressed late during the developmental process under the control of C-signaling (50, 51), but their regulation is not well understood, although the expression of exo (previously called fdgA) depends in part on FruA, and the DNA-binding domain of FruA binds upstream of the three exo promoters (52).
In this study, we investigated the response of developing M. xanthus to the addition of different nutrient medium concentrations. We added a 2-fold dilution series of nutrient medium to developing cells and measured phenotypic and molecular markers of the developmental process. We discovered that cells respond ultrasensitively to the addition of nutrient medium in terms of mound and spore formation, and recovery of the ability to form mounds and spores after nutrient medium addition correlated with the MrpC level during the period of commitment to sporulation. Our results suggest that a threshold level of MrpC must be reached in order to restore mound formation, perhaps by meeting a threshold requirement for C-signaling and FruA* to initiate mound formation and sustain a positive feedback loop that further elevates the FruA* level enough to efficiently activate genes that commit cells to form spores (Fig. 1).
RESULTS
M. xanthus responds ultrasensitively to nutrient medium addition during development.
Previous work has shown that 24 to 30 h PS is a critical period of commitment to spore formation during the development of M. xanthus under submerged culture conditions (35). Replacement of the starvation buffer overlaying the cells adhered to the bottom of the culture vessel with CTTYE nutrient medium (1% Casitone, 10 mM Tris-HCl [pH 8.0], 1 mM KH2PO4·K2HPO4, 8 mM MgSO4, [final pH 7.6], 0.2% yeast extract) prior to commitment halts development. To further investigate the effect of CTTYE addition, the starvation buffer at 18 h PS was replaced with a 2-fold dilution series of CTTYE in starvation buffer, and sonication-resistant spores were measured at 30, 36, and 42 h of total incubation. At all three times, the number of sonication-resistant spores was much higher after the addition of ≤12.5% CTTYE than after the addition of ≥25% CTTYE (see Fig. S1 in the supplemental material). Therefore, the response to 12.5% versus 25% CTTYE was examined more thoroughly, including biological replicates and spore quantification at later times (42, 48, or 72 h of total incubation) to determine whether cells eventually formed spores after adding 25% CTTYE at 18 h PS. When the starvation buffer overlay was replaced with 25% or 100% CTTYE, cells dispersed from the mounds and appeared to grow as a biofilm of nearly uniform thickness (Fig. 2A). In contrast, after replacement with 12.5% CTTYE, the initial reversal of mound formation was overcome, and mounds were restored by 27 h of total incubation. These mounds began to darken at 42 h and became darker at 72 h, suggestive of ongoing sporulation.
FIG 2.
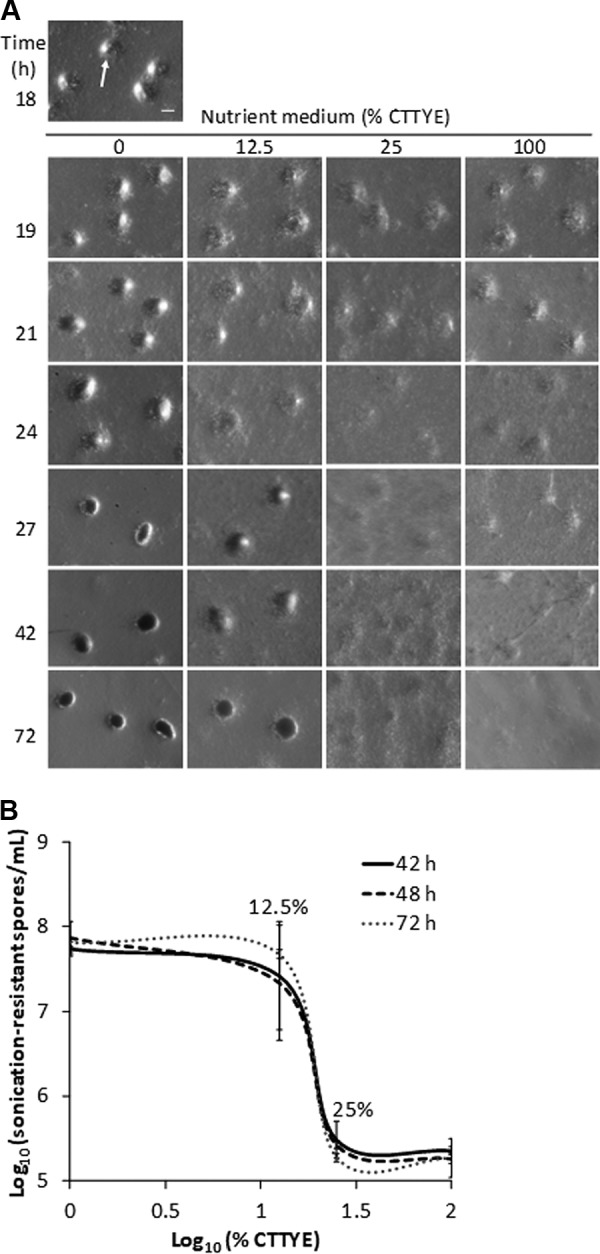
The ultrasensitive response of developing M. xanthus to nutrient medium addition. Wild-type strain DK1622 was subjected to starvation under submerged culture conditions. The culture supernatant was replaced with the indicated percentage of CTTYE nutrient medium at 18 h poststarvation (PS). (A) Effect of CTTYE addition on fruiting body formation. Images were obtained at 18 h PS and at the indicated times of total incubation. Mounds formed by 18 h PS (an arrow points to one) and darkened by 27 h of total incubation when the culture supernatant was replaced with fresh starvation buffer (0% CTTYE). Cells dispersed from mounds when the culture supernatant was replaced with CTTYE, but mounds reformed by 27 h of total incubation with 12.5% CTTYE, whereas cells remained dispersed with 25% or 100% CTTYE. Bar = 100 μm. Similar results were observed in three biological replicates. (B) Effect of CTTYE addition on sonication-resistant spore formation. Cultures were harvested at the indicated times of total incubation for the measurement of sonication-resistant spores. Log-log plot shows the average of three biological replicates (y axis; error bars show one standard deviation) at each nutrient concentration (x axis).
Consistent with the observation of darkened mounds, a steep increase in the number of sonication-resistant spores was observed with 12.5% CTTYE compared with that with 25% CTTYE at 42, 48, or 72 h of total incubation (Fig. 2B). A 2-fold decrease in nutrient concentration led to about a 100-fold increase in the number of sonication-resistant spores. Hence, the sporulation response is nonlinear over this range of nutrient medium addition to developing cells. The values of the slopes between 12.5% versus 25% CTTYE in the log-log plots shown in Fig. 2B range between −6 and −7, indicative of an ultrasensitive response (53).
Mature spores form despite 12.5% CTTYE addition.
Since a considerable number of sonication-resistant spores were observed despite the addition of 12.5% CTTYE at 18 h PS, we investigated whether these spores were “mature” (i.e., resistant to heat and sonication and able to germinate in the presence of nutrients and grow to produce a colony). The number of mature spores was lower than the number of sonication-resistant spores from the same treatment, but the striking difference between 12.5% versus 25% CTTYE remained at 42 or 48 h of total incubation and was even greater on average at 72 h (Fig. 3). Clearly, mature spores form much more efficiently after adding 12.5% CTTYE than after adding 25% CTTYE.
FIG 3.
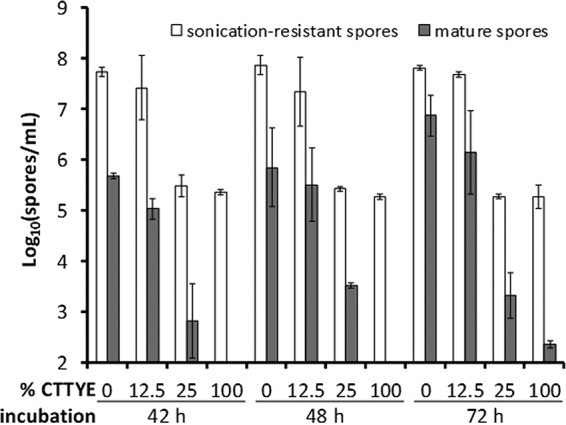
Effect of nutrient medium addition on formation of sonication-resistant spores and mature spores. Wild-type M. xanthus strain DK1622 was subjected to starvation under submerged culture conditions. The culture supernatant was replaced with fresh starvation buffer (0% CTTYE) or the indicated percentage of CTTYE nutrient medium at 18 h poststarvation, and cultures were harvested at the indicated times of total incubation for the measurement of sonication-resistant spores and mature spores. Values are the average of three biological replicates, and error bars show one standard deviation.
MrpC protein level correlates with sporulation after CTTYE addition.
Since sporulation exhibited an ultrasensitive response to CTTYE addition, the molecular response to the addition of 12.5% versus 25% CTTYE was compared by systematically measuring transcript and protein levels. MrpC is a key transcription factor in the gene regulatory network governing sporulation (reviewed in reference 12). Upon the addition of 100% CTTYE, MrpC has been reported to be rapidly degraded, halting the expression of genes important for sporulation (35). Therefore, the mrpC transcript and MrpC protein levels were measured after the addition of 0%, 12.5%, 25%, or 100% CTTYE at 18 h PS, until 30 h of total incubation (i.e., leading up to and including the critical period of commitment to spore formation).
The addition of CTTYE caused a 5-fold decline in mrpC transcripts within 1 h (Fig. 4A). While the mrpC transcript level remained low after the addition of 100% CTTYE, a partial recovery of the transcript level occurred after the addition of 12.5% or 25% CTTYE. On average, the mrpC transcript level recovered more after adding 12.5% CTTYE than after adding 25% CTTYE at 24 to 30 h of total incubation (i.e., during the commitment period). While the average mrpC transcript level was higher after the addition of 12.5% than after the addition of 25% CTTYE, especially at 24 and 27 h, the error of the measurements was large, and the differences were not statistically significant at the 95% confidence level (P = 0.15 at 24 h and P = 0.16 at 27 h in Student's unpaired two-tailed t tests). Nevertheless, the results clearly show significant recovery of the mrpC transcript level after 12.5% CTTYE addition (e.g., P = 0.02 comparing 19 and 27 h).
FIG 4.
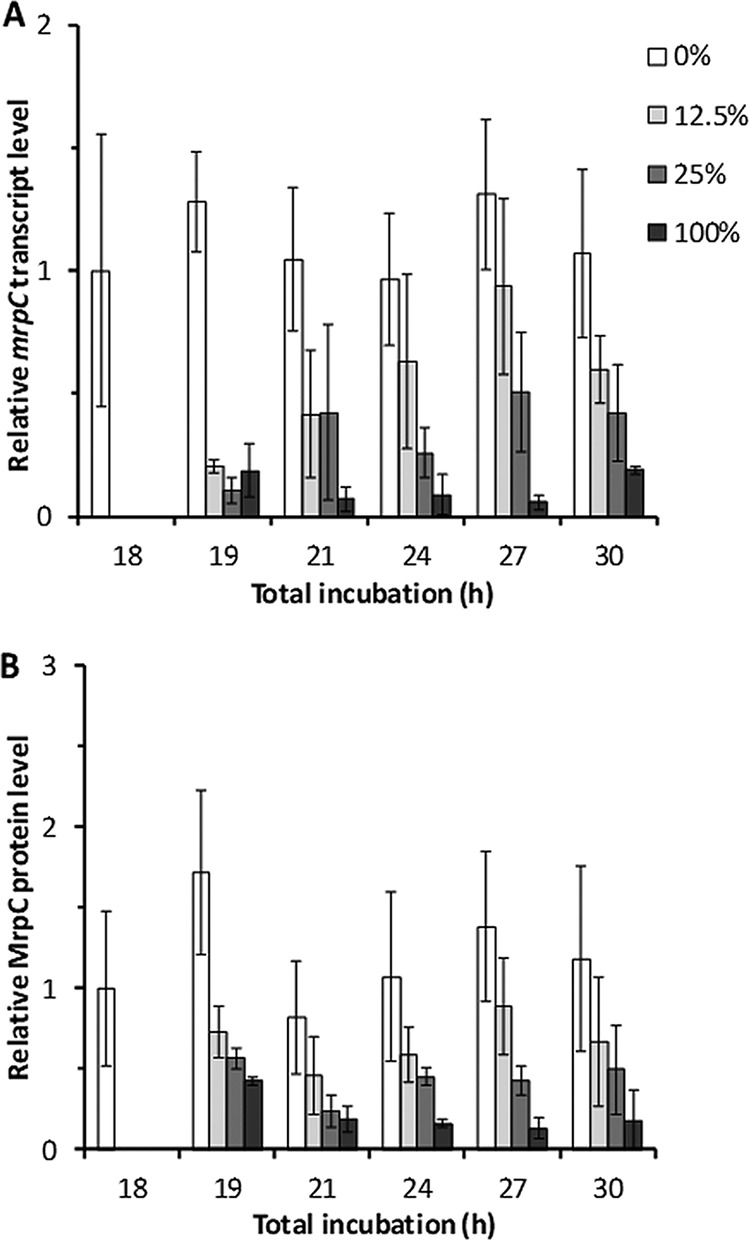
Effect of nutrient medium addition on the mrpC transcript and MrpC protein levels. Wild-type M. xanthus strain DK1622 was subjected to starvation under submerged culture conditions. At 18 h poststarvation, culture supernatants were replaced with fresh starvation buffer (0%) or the percentage of CTTYE nutrient medium indicated in the key. Cultures were harvested at the indicated times of total incubation. (A) mrpC transcript levels. RNA was isolated from the cultures and subjected to quantitative reverse transcription-PCR (RT-qPCR) analysis. (B) MrpC protein levels. Protein samples from the cultures were analyzed by immunoblotting using anti-MrpC antibodies. In both panels, values are the average of three biological replicates, relative to the sample at 18 h, and error bars show one standard deviation.
The MrpC protein level was consistent with the mrpC transcript level, but the initial decline in the MrpC level after CTTYE addition was not as large, and the difference after 12.5% versus 25% CTTYE addition was less pronounced at 24 h (Fig. 4B). The difference in MrpC levels was greatest at 27 h (P = 0.06 comparing 12.5% versus 25% CTTYE addition).
In previous work, our group observed a rapid decline in MrpC protein levels and a slower decline of mrpC transcript levels after the addition of 100% CTTYE to developing cells (35). However, the samples for the two measurements were collected in different experiments under slightly different conditions (i.e., 6-well plates for protein measurements and petri plates for transcript measurements). Here, the samples for the two measurements were collected from petri plates in the same experiment, and by 1 h after adding CTTYE at 18 h PS, the mrpC transcript level had declined more than the MrpC protein level (Fig. 4). To test whether development in 6-well plates would yield a different outcome than development in petri plates, samples for protein measurements were collected from 6-well plates. The results were similar to those shown in Fig. 4B (i.e., petri plate samples), except the difference in MrpC level after 12.5% versus 25% CTTYE addition was more pronounced at 24 h (P = 0.05), similar to the difference at 27 h (P = 0.03) (see Fig. S2 in the supplemental material). Clearly, a difference between development in 6-well plates versus petri plates does not explain why the MrpC level declined more slowly here (Fig. 4B and S2) than previously (35). We do not understand the discrepancy.
The mrpC transcript level declined slowly in previous work, but CTTYE was added to developing cells at 24 h PS (35). Here, CTTYE was added at 18 h PS, and the mrpC transcript level declined rapidly (Fig. 4A). We did not investigate this difference. Rather, we focused on possible explanations of the recovery of the mrpC transcript and MrpC protein levels after CTTYE addition (Fig. 4), because recovery of the MrpC level correlated with restoration of mound (Fig. 2A) and spore (Fig. 2B and 3) formation after 12.5% CTTYE addition at 18 h PS.
Recovery of the MrpC level after CTTYE addition is regulated by synthesis rather than stability.
Our results showed recovery of both the mrpC transcript and MrpC protein levels after CTTYE addition (Fig. 4). A simple explanation of the recovery would be resumption of mrpC transcription, which is positively regulated by MrpB, an NtrC-like response regulator likely activated by phosphorylation (22). However, an assay for MrpB-P has not been developed. To determine whether CTTYE addition regulates an event necessary for MrpB-P production, we measured the mrpB transcript level after the addition of 0%, 12.5%, 25%, or 100% CTTYE at 18 h PS, until 30 h of total incubation. The mrpB transcript level rose at 19 h on average and then returned to the starting value at 21 h for all treatments (Fig. 5). Later, the level stayed about the same after adding 12.5% or 25% CTTYE, but oddly, the level was elevated on average and highly variable after the 0% or 100% treatments. Although we do not understand the results with the 0% and 100% treatments, clearly there was no correlation between the mrpB transcript level and the mrpC transcript level (Fig. 4A) after adding 12.5% versus 25% CTTYE. Since the response to CTTYE addition is not due to regulation of the mrpB transcript level, we infer that the response is due to regulation of the MrpB-P level and/or another factor that affects the mrpC transcript level (see Discussion).
FIG 5.
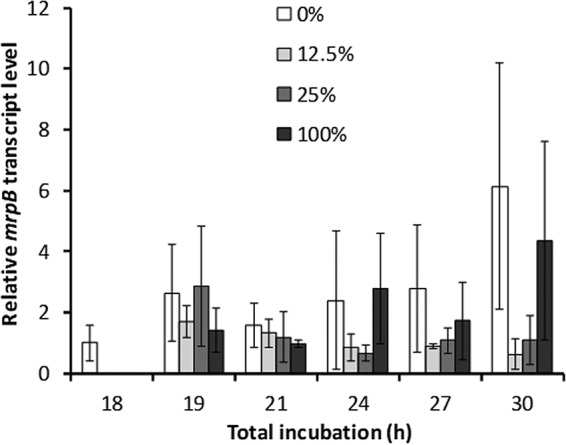
Effect of nutrient medium addition on the mrpB transcript level. Wild-type M. xanthus strain DK1622 was subjected to starvation under submerged culture conditions. At 18 h poststarvation, culture supernatants were replaced with fresh starvation buffer (0%) or the percentage of CTTYE nutrient medium indicated in the key. Cultures were harvested at the indicated times of total incubation. RNA was isolated from the cultures and subjected to RT-qPCR analysis. Values are the average of three biological replicates, relative to the sample at 18 h, and error bars show one standard deviation.
While recovery of the mrpC transcript level (Fig. 4A) may account for recovery of the MrpC protein level (Fig. 4B and S2) after CTTYE addition, we also considered the possibility that a difference in nutrient-regulated proteolysis of MrpC could play a role (35). To determine the stability of MrpC after CTTYE addition at 18 h PS, the protein synthesis inhibitor chloramphenicol was added at 27 h, and samples were collected every 15 min for 1 h. As expected, the MrpC levels in all samples declined after chloramphenicol addition, and the decline was on average more rapid in samples to which CTTYE had been added at 18 h PS (Fig. 6). However, the decline was more rapid on average in samples to which 12.5% CTTYE had been added than with 25% CTTYE. This would not account for the observed higher steady-state level of MrpC at 27 h after adding 12.5% than after adding 25% CTTYE (Fig. 4B and S2). Given the short half-life of MrpC in both cases (Fig. 6), it is unlikely that a difference in MrpC stability earlier during the period between 18 h PS (when CTTYE was added) and 27 h of total incubation (when chloramphenicol was added) accounts for the observed difference in the MrpC level.
FIG 6.
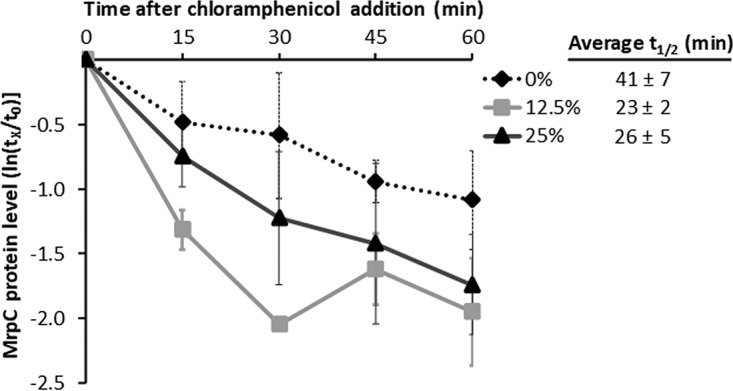
MrpC protein stability after nutrient medium addition. Wild-type M. xanthus strain DK1622 was subjected to starvation under submerged culture conditions in 6-well plates. At 18 h poststarvation, culture supernatants were replaced with fresh starvation buffer (0%) or the percentage of CTTYE nutrient medium indicated in the key. At 27 h of total incubation, culture supernatants were supplemented with 200 μg/ml chloramphenicol, and a culture was harvested immediately (t0) and at each indicated time (tx) after chloramphenicol addition, for measurement of the MrpC level by immunoblot using anti-MrpC antibodies. MrpC levels at tx were normalized to that at t0 for each of three biological replicates and used to determine the MrpC half-life for each replicate. The average half-life (average t1/2) and one standard deviation are shown in the legend. The graph shows the average ln(tx/t0) and one standard deviation for the three biological replicates.
Taken together, our results suggest that recovery of the mrpC transcript level after CTTYE addition involves regulation of transcript synthesis and/or stability, and this accounts for the recovery of the steady-state MrpC level due to protein synthesis (i.e., translation of mrpC transcripts) rather than regulation of protein stability.
FruA protein level remains high after CTTYE addition, despite a drop in the fruA transcript level.
MrpC activates transcription of the fruA gene (25), which encodes another important transcription factor for sporulation (reviewed in reference 12). Therefore, we measured the fruA transcript and FruA protein levels after the addition of 0%, 12.5%, 25%, or 100% CTTYE at 18 h PS, until 30 h of total incubation. The addition of CTTYE caused the fruA transcript level to drop quickly, and surprisingly, there was no recovery (Fig. 7A), unlike the mrpC transcript (Fig. 4A) and MrpC protein (Fig. 4B and S2) levels. In spite of the very low level of fruA transcript after CTTYE addition, the FruA protein level remained high at 19 and 21 h and only declined about 2-fold later, with the exception that the FruA level recovered on average at 27 h after adding 12.5% CTTYE (Fig. 7B); however, the error of the measurements is large, and the difference from the 25% CTTYE addition is not statistically significant (P = 0.18).
FIG 7.
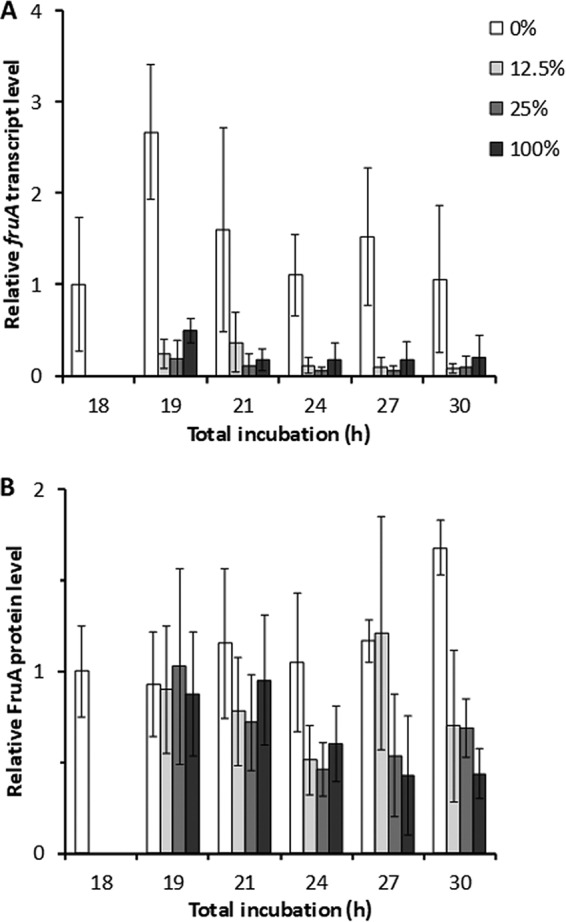
Effect of nutrient medium addition on the fruA transcript and FruA protein levels. Wild-type M. xanthus strain DK1622 was subjected to starvation under submerged culture conditions. At 18 h poststarvation, culture supernatants were replaced with fresh starvation buffer (0%) or the percentage of CTTYE nutrient medium indicated in the key. Cultures were harvested at the indicated times of total incubation. (A) fruA transcript levels. RNA was isolated from the cultures and subjected to RT-qPCR analysis. (B) FruA protein levels. Protein samples from the cultures were analyzed by immunoblotting using anti-FruA antibodies. In both panels, values are the average of three biological replicates, relative to the sample at 18 h, and error bars show one standard deviation.
Our results agree with the previous observation that the FruA level declines more slowly than the MrpC level after the addition of 100% CTTYE (35). The slow decline in the FruA level despite the rapid drop in the fruA transcript level implies that FruA is more stable than MrpC in developing cells. We measured FruA stability after adding CTTYE at 18 h PS and then adding chloramphenicol at 27 h. As expected, FruA was quite stable even after CTTYE addition (see Fig. S3 in the supplemental material) and more stable than MrpC (Fig. 6).
Taken together, our results show that the fruA transcript level after CTTYE addition (Fig. 7A) does not correlate with the MrpC level (Fig. 4B and S2), mound formation (Fig. 2A), or sporulation (Fig. 2B and 3). Nevertheless, the stability of FruA (Fig. S3) allows it to persist in developing cells even if CTTYE is added (Fig. 7B), and after 12.5% CTTYE addition, the levels of FruA and MrpC are adequate to support mound formation and sporulation.
Transcript levels of “late” genes fail to rise normally after CTTYE addition.
To test whether CTTYE addition affects the expression of operons induced later than the mrpC and fruA genes during development, we measured transcript levels after the addition of 0%, 12.5%, 25%, or 100% CTTYE at 18 h PS, until 30 h of total incubation, for operons we refer to as “late” genes. Among the late genes we chose (dev, exo, nfs, fadIJ, and MXAN_3259), the dev operon is the best characterized and requires cooperative binding of MrpC and FruA to the promoter region (26) in order to produce proteins that regulate the timing of sporulation (31). FruA has also been shown to bind in the promoter region of the exo operon (52), whose products together with those of the nfs operon are involved in forming the polysaccharide layer of the spore coat (48, 49). Developmental expression of fadIJ depends on MrpC and FruA and is important for β-oxidation of fatty acids stored in lipid bodies and both mound formation and spore maturation (54). The promoter region of the predicted MXAN_3259–MXAN_3263 operon is bound by the DNA-binding domain of Nla6, a developmental transcription factor, and the disruption of MXAN_3259 impairs spore formation but not mound formation (55).
Strikingly, all the late gene transcript levels decreased by 1 or 3 h after CTTYE addition (i.e., at 19 or 21 h of total incubation) and failed to recover by 30 h of total incubation, with the notable exception that all five exhibited extremely high and varied transcript levels at 30 h after the 100% nutrient treatment (Fig. 8 and S4). The high transcript levels at 30 h after the addition of 100% CTTYE at 18 h PS were unexpected, since mound formation was reversed (Fig. 2A), very few spores formed at 30 h (Fig. S1) or later (Fig. 2B and 3), and the MrpC level remained low (Fig. 4B and S2). The dev transcript level was different from those of the other four since a decrease was not observed until 3 h after CTTYE addition and a large increase was not observed at 30 h in the 0% CTTYE addition control (Fig. 8A). The other four late gene transcript levels decreased on average by 1 h after CTTYE addition and increased on average from about 4- to 30-fold at 30 h in the 0% CTTYE addition control (Fig. 8B and S4). During the normal period of commitment to sporulation (24 to 30 h PS), the levels of all the late gene transcripts are considerably higher on average in the 0% CTTYE addition control than after the addition of 12.5% or 25% CTTYE at 18 h PS (Fig. 8 and S4). How then do spores form after the addition of 12.5% CTTYE at 18 h PS?
FIG 8.
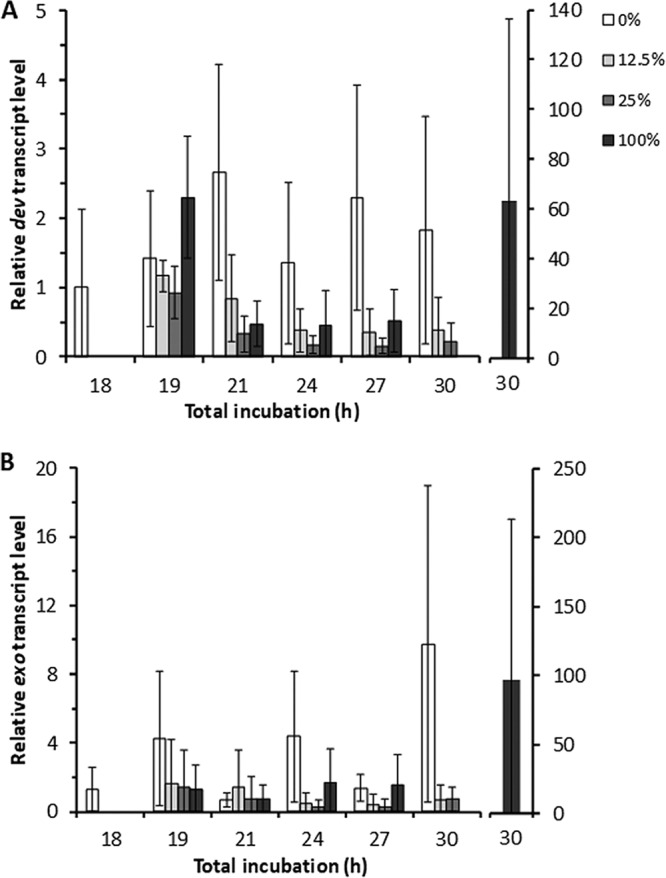
Effect of nutrient medium addition on late gene transcript levels. Wild-type M. xanthus strain DK1622 was subjected to starvation under submerged culture conditions. At 18 h poststarvation, culture supernatants were replaced with fresh starvation buffer (0%) or the percentage of CTTYE nutrient medium indicated in the key. Cultures were harvested at the indicated times of total incubation. RNA was isolated from the cultures and subjected to RT-qPCR analysis. Values are the average of three biological replicates, relative to the sample at 18 h, and error bars show one standard deviation. (A and B) dev (A) and exo (B) transcript levels.
We hypothesized that late genes are expressed more after adding 12.5% than after adding 25% CTTYE at 18 h PS but not until after 30 h of total incubation, because the number of sonication-resistant spores rises between 30 and 36 h (Fig. S1), and the number of mature spores rises even later, between 48 and 72 h (Fig. 3). To test our hypothesis, we measured the expression of a lacZ reporter fused to the exo promoter. Because the fusion was created by the insertion of Tn5 lac Ω7536 into exoC (48, 50), sonication-resistant spores fail to form, and β-galactosidase activity could easily be measured in sonic extracts of cells late during development without the need to break spores. We added 0%, 12.5%, or 25% CTTYE at 18 h PS and measured β-galactosidase activity at 42, 48, and 72 h of total incubation. Activity rose about 3-fold between 42 and 72 h in the 0% CTTYE addition control (Fig. 9). In agreement with our hypothesis, activity was higher after adding 12.5% CTTYE than 25% CTTYE at all times tested and rose about 2-fold between 42 and 72 h after the 12.5% nutrient treatment. Higher expression of exo and other late genes may account for the higher number of spores observed after adding 12.5% versus 25% CTTYE (Fig. 2B and 3).
FIG 9.
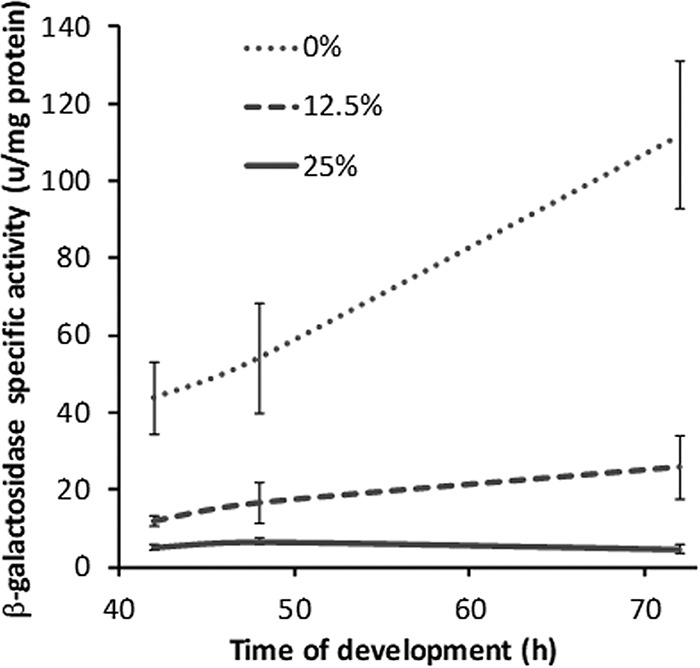
Effect of nutrient medium addition on exo-lacZ expression. M. xanthus strain DK10524 was subjected to starvation under submerged culture conditions in 6-well plates. At 18 h poststarvation, culture supernatants were replaced with fresh starvation buffer (0%) or the percentage of CTTYE nutrient medium indicated in the key. Cultures were harvested at the indicated times of total incubation for the measurement of β-galactosidase activity. Values are the average of three biological replicates, and error bars show one standard deviation.
DISCUSSION
Our experiments revealed an ultrasensitive response of developing M. xanthus to the addition of nutrient medium. A 2-fold difference in the concentration of CTTYE determined whether mounds reformed and resulted in about a 100-fold difference in the number of spores formed. Systematic measurements of the molecular response showed that recovery of the MrpC level after the addition of CTTYE correlated with the ultrasensitive developmental response, suggesting a threshold requirement for MrpC. Recovery of the MrpC level was regulated at the level of synthesis and/or stability of the mrpC transcript, not at the level of MrpC stability. In contrast to MrpC, FruA was quite stable after CTTYE addition. We propose that recovery of the MrpC level is necessary to allow C-signaling and activation of FruA, which promotes mound formation and sporulation (Fig. 1). Although the formation of mounds and spores is restored, the transcript levels of late genes are not fully restored, indicating that the developmental process is robust to this perturbation.
A threshold level of MrpC may be necessary to meet a threshold requirement for C-signaling.
MrpC is important for C-signaling, since an mrpC null mutant failed to rescue the development of a csgA mutant upon mixing (23). Also, the mrpC mutant accumulated less CsgA protein during development. Hence, MrpC positively regulates C-signaling (Fig. 1).
Interestingly, distinct threshold levels of C-signaling are required for mound formation, sporulation, and expression of particular genes during development (56–58). In one study, small incremental differences (e.g., 0.2 unit) in the amount of CsgA added to a csgA mutant determined whether or not mounds formed, affected the sporulation efficiency 100-fold, and differentially influenced the expression of an early versus a late developmental gene (56). These observations suggest that the developmental process responds ultrasensitively to C-signaling.
Since C-signaling is positively regulated by MrpC (23), we propose that after CTTYE addition, the MrpC level must recover to a certain threshold in order to meet a threshold requirement of C-signaling for mound formation. In order to test this hypothesis, it will be crucial to elucidate the mechanism by which C-signaling activates FruA and how FruA* initiates mound formation. Once initiated, mound formation would bring cells into proximity, enhancing short-range C-signaling (reviewed in reference 12) and resulting in more FruA*. This positive-feedback loop may explain the ultrasensitivity of the developmental process to C-signaling. Positive feedback is a common mechanism to generate ultrasensitivity leading to bistability and alternative cell fates (53, 59, 60).
A rising level of FruA* produced in response to C-signaling during development would not only promote mound formation, it would trigger gene expression and lead to sporulation (56–58). FruA* and MrpC have been proposed to bind cooperatively to activate the transcription of genes that commit rod-shaped cells to form spores (5, 28, 35) (Fig. 1). The dev operon is regulated in this way (26), and the products of the dev operon include the negative autoregulators DevTRS and the sporulation inhibitor DevI, forming a timer of sporulation (31, 34) (Fig. 1). The dev promoter may have a relatively low threshold for FruA*, whereas genes essential for commitment to sporulation may have a higher threshold (5), since some genes depend more strongly on C-signaling and are expressed later during development than dev (27, 30, 61). Neither the dev transcript level nor that of the other late genes we tested recovered significantly more after adding 12.5% CTTYE at 18 h PS than after adding 25% CTTYE by 30 h of total incubation (Fig. 8 and S4). However, none of these genes are essential for the initial cellular shape change during sporulation, but rather, dev controls the timing of sporulation (31), and the other late genes we tested are involved in spore maturation (48, 54) (S. Saha and L. Kroos, unpublished data).
We propose that other late genes remain to be identified which have a relatively high threshold for FruA* and therefore depend strongly on C-signaling, and these are essential for the initial cellular shape change during sporulation. We predict that the transcript level of such genes would be higher during the critical period of commitment to sporulation (i.e., at about 27 h of total incubation, when the MrpC level is higher; Fig. 4B and S2) after adding 12.5% CTTYE at 18 h PS than after adding 25% CTTYE. We are searching for such genes.
CTTYE addition regulates both mrpC transcript and MrpC protein levels.
The rapid decline of the mrpC transcript level observed here (Fig. 4A) suggested a more important role of transcript synthesis and/or stability in the response to CTTYE addition than previously suspected (35). Interestingly, the mrpC transcript declined to a similar level by 1 h after the addition of different concentrations of CTTYE at 18 h PS (Fig. 4A). This observation could be explained if the addition of ≥12.5% CTTYE nearly halts the initiation of mrpC transcription, since the half-life of mrpC transcripts in developing cells at 18 h PS is about 10 min (5). MrpB-P appears to be an activator of mrpC transcription (22, 62). We showed that the mrpB transcript level (Fig. 5) did not respond to CTTYE addition in a way that would explain the observed changes in the mrpC transcript level (Fig. 4A). Several other explanations are possible for the rapid decline and differential recovery of the mrpC transcript level after the addition of different concentrations of CTTYE. Nutrient-regulated dephosphorylation of MrpB-P would provide an attractive mechanism to control the activation of mrpC transcription. Such a mechanism could involve nutrient sensing by MrpA, which has been proposed to act as a phosphatase of MrpB rather than a kinase, based on mutant phenotypes (22). Alternatively, or in addition, MrpC itself could be a nutrient-sensing autorepressor. In two recent studies, MrpC was shown to negatively autoregulate (5, 62), and it may do so by competing with MrpB-P for overlapping binding sites in the mrpC promoter region (62). It is also possible that CTTYE addition destabilizes mrpC transcripts. The mechanism of mrpC transcript turnover has not been investigated.
The MrpC protein level declined more slowly and recovered more slowly than the mrpC transcript level (Fig. 4). This pattern is consistent with regulation primarily of the transcript level. We expected the decline of the MrpC level after 100% CTTYE addition to be more rapid based on previous work by our group (35). Although we do not understand this difference, we did observe shortening of the MrpC half-life after the addition of CTTYE (Fig. 6), consistent with nutrient-regulated proteolysis of MrpC (35). Furthermore, our results indicate that lower concentrations of CTTYE (i.e., 12.5% or 25% rather than 100%) induce proteolysis that persists for at least 9 h, since CTTYE was added at 18 PS and MrpC stability was measured at 27 h of total incubation (Fig. 6). However, the average half-life of MrpC did not differ significantly after the addition of 12.5% versus 25% CTTYE, so a difference in nutrient-regulated proteolysis does not account for the observed differential recovery of the steady-state MrpC level at 27 h (Fig. 4B and S2). Rather, differential recovery of the mrpC transcript level (Fig. 4A) and the resulting synthesis of MrpC appear to account for differential recovery of the MrpC protein level (Fig. 4B and S2).
Recovery of the MrpC level after the addition of 12.5% CTTYE at 18 h PS reached a maximum at 24 to 27 h of total incubation (Fig. 4B and S2). According to our model, a threshold level of MrpC was reached so that C-signaling could activate FruA, restoring mound formation (Fig. 2A) and efficient sporulation (Fig. 2B and 3). We cannot rule out the possibility that the activity of MrpC is regulated (e.g., by phosphorylation or nucleotide binding), as well as the level of MrpC. It was reported previously that two serine-threonine protein kinases, Pkn8 and Pkn14, form a cascade in which Pkn8 phosphorylates Pkn14 and Pkn14 phosphorylates MrpC (63, 64). Deletion of pkn8 or pkn14 in the DZF1 strain background accelerated development (63). However, recently, it was found that the deletion of pkn14 in the DZ2 or DK1622 background (B. Feeley and P. Higgs, personal communication) or a plasmid insertion mutation in pkn14 in the DK1622 background has no effect on development (S. Saha, Y. Hoang, R. Rajagopalan, and L. Kroos, unpublished data). Therefore, it is unlikely that phosphorylation of MrpC by Pkn14 affects MrpC activity in a way that is important for the ultrasensitive response. MrpC has a potential nucleotide-binding domain (22), but nucleotide binding has not been shown to affect MrpC activity, despite testing many different nucleotides for an effect on DNA binding by MrpC (28). On the other hand, accelerated accumulation of MrpC or CsgA due to reduced proteolysis (65, 66) or overexpression (57), respectively, has been correlated with accelerated development, consistent with our model that a threshold level of MrpC must be reached to meet a threshold requirement for C-signaling.
In an effort to test our model that MrpC must reach a threshold level in order for development to proceed, we fused mrpC to a vanillate-inducible promoter (67) and integrated the fusion ectopically in an mrpC mutant. Maximum induction with vanillate restored the MrpC level in the mrpC mutant to about 60% of the wild-type level at 18 h PS but was insufficient to restore mound formation or sporulation (see Fig. S5 in the supplemental material). These results suggest that the MrpC level must reach more than about 60% of the wild-type level in order to restore development. We note that this condition was met when 12.5% CTTYE was added at 18 h PS, after 27 h of total incubation, but not when 25% CTTYE was added (Fig. 4B and S2). Unfortunately, the vanillate-inducible construct was unable to fully restore the MrpC level in the mrpC mutant, which our model predicts would restore development. An inducible system capable of higher expression during development will need to be engineered. The mrpC promoter may be a good starting point, since the mrpC transcript is highly abundant, about 10% of the 16S rRNA level in cells at 24 h PS (5).
After the addition of 25% CTTYE, the MrpC level recovered slightly at 24 h of total incubation but did not increase thereafter by 30 h of incubation (Fig. 4B and S2). According to our model, the level of MrpC did not reach the threshold to allow C-signaling to activate FruA, so the positive-feedback loop that normally sustains mound formation was interrupted. Cells in the mounds that had formed by 18 h PS dispersed and appeared to grow as a biofilm (Fig. 2A). The spore number did not increase significantly between 36 and 72 h (Fig. S1, 2B, and 3). There was no indication that the developmental process had restarted by 72 h. The phenotypic effects of adding 100% CTTYE were similar to those of adding 25% CTTYE (Fig. 2 and 3), and there was no recovery of the MrpC level after the addition of 100% CTTYE (Fig. 4B and S2). These observations raise the question of why development fails to restart, rather than restarting later than after 12.5% CTTYE addition (e.g., after the nutrients in ≥25% CTTYE are exhausted). We considered the possibility that cells exposed to ≥25% CTTYE lose the ability to undergo development. Therefore, we added 25% or 100% CTTYE at 18 h PS; then, at 27 h of total incubation, we replaced the overlay with fresh starvation buffer. We found that cells retain the ability to form mounds by 42 h of total incubation, and the mounds darken by 96 h of total incubation (Fig. S6). Interestingly, the darkened mounds are abnormally large at 96 h under two conditions, either the addition of 12.5% CTTYE at 18 h PS or 25% CTTYE at 18 h PS followed by replacement of the overlay with fresh starvation buffer at 27 h of total incubation. These conditions appear to favor the merging of smaller mounds, a behavior observed for some mounds in close proximity without the addition of nutrient medium to developing cells (68). The total number of spores formed was similar in all cases where darkened mounds were observed (Fig. S6). We conclude that exposure to ≥25% CTTYE (for 9 h) does not irreversibly damage cells so they lose the ability to form mounds and spores. Perhaps, exposure to ≥25% CTTYE for more than 9 h irreversibly damages cells for development. Alternatively, CTTYE may contain, or cause cells to produce, an inhibitor of development that can neither be utilized nor overcome when ≥25% CTTYE is added at 18 h PS.
The impact on C-signal-dependent production of FruA* may be quite large when ≥25% CTTYE is added at 18 h PS. In a recent study conducted under the same conditions of submerged culture development used here, it was estimated that by 18 h PS, mound formation had progressed sufficiently for C-signaling to activate FruA at least 9-fold (5). This estimate is a minimum based on measurements of the dev transcript levels in the wild type and mutants, and on mathematical modeling assuming low occupancy of the dev promoter by active FruA and MrpC. If the dev promoter approaches saturation binding of active FruA and MrpC, C-signaling may activate FruA as much as 30-fold by 18 h PS. Even the addition of 12.5% CTTYE at 18 h PS likely lowers C-signal-dependent production of FruA* temporarily, accounting for the initial reversal of mound formation, which was restored by 27 h of total incubation (Fig. 2A).
Sporulation despite low levels of fruA and late gene transcripts after CTTYE addition.
It was surprising that the fruA transcript level after CTTYE addition (Fig. 7A) did not correlate with the MrpC level (Fig. 4B and S2), since MrpC binds to the fruA promoter region and appears to activate transcription (25). One possible explanation is that recovery of the MrpC level after CTTYE addition does not meet a threshold for binding to the fruA promoter region, even though, according to our model, recovery of the MrpC level after 12.5% CTTYE addition meets a threshold for C-signaling (i.e., perhaps the csgA promoter region or that of another gene important for C-signaling has a higher affinity for MrpC). Alternatively, CTTYE addition may induce a factor that prevents MrpC from activating fruA transcription or that destabilizes fruA transcripts.
Despite the low level of fruA transcripts after CTTYE addition, the FruA protein level remained fairly high, decreasing at most about 2-fold at 24 to 30 h of total incubation (Fig. 7B). At 27 h of total incubation, the half-life of FruA was ≥1 h whether or not CTTYE had been added at 18 h PS (Fig. S3), consistent with prior determinations of the FruA half-life with or without 100% CTTYE addition at 18 and 24 h PS (35). The stability of FruA ensures its presence despite the drop in fruA transcripts. Hence, FruA is available for activation by C-signaling under conditions permissive for the recovery of MrpC and C-signaling.
Like the fruA transcript level, the late gene transcript levels declined after CTTYE addition and failed to recover, except all the late genes exhibited extremely high and varied transcript levels at 30 h after adding 100% CTTYE at 18 h PS (Fig. 8 and S4). The exception is very surprising, because there was no other indication that development had restarted after 100% CTTYE addition, either in terms of the MrpC level (Fig. 4B and S2) or phenotypically (Fig. 2 and 3). Rather, cells appear to grow as a biofilm after either 100% or 25% CTTYE addition (Fig. 2A). Yet, late gene transcripts accumulate abundantly only after adding 100% CTTYE, and not until 12 h later (i.e., 30 h of total incubation) (Fig. 8 and S4). Under this particular condition, at least some cells in the population appear to make one or more factors that increase synthesis and/or stability of late gene transcripts. Identification of such factors may provide insight into the potential biological significance of this unexpected response and could uncover novel regulatory mechanisms that normally control late gene expression.
How do mature spores form after 12.5% CTTYE addition at 18 h PS, considering that four of the late genes we tested (exo, nfs, fadIJ, and MXAN_3259) are involved in spore maturation (48, 54) (S. Saha and L. Kroos, unpublished data) but their transcript levels failed to rise normally at 30 h of total incubation (Fig. 8B and S4)? We showed that exo is expressed more highly after adding 12.5% CTTYE than 25% CTTYE at 18 h PS, when examined between 42 and 72 h of total incubation (Fig. 9). Perhaps, the other three late genes also recover slowly after 12.5% CTTYE addition. However, recovery of exo expression was incomplete after 12.5% CTTYE addition compared to that with 0% CTTYE (Fig. 9). Related to this, it was concluded recently that very little exo expression is required for sporulation, based on finding a low level of exo transcripts in a devI devS double mutant that nevertheless forms a normal number of mature spores (31). Perhaps, transcripts of the late genes involved in spore maturation are normally made in excess. On the other hand, the standard method of measuring mature spores, which we employ, may not reflect the selective pressures encountered by spores in natural environments (i.e., the spores made after 12.5% CTTYE addition may differ from spores made normally, in terms of resistance to insults harsher than what we employed). Of course, like FruA, the products of the late genes may be more stable than their transcripts after CTTYE addition. However, the fruA transcript and FruA protein levels were already quite high at 18 h PS (Fig. 7), whereas the transcript levels of the late genes involved in spore maturation were low at 18 h PS and increased on average from about 4- to 30-fold at 30 h in the 0% CTTYE addition control (Fig. 8B and S4). Some combination of the possibilities mentioned above likely explains how mature spores form after 12.5% CTTYE addition.
MATERIALS AND METHODS
Bacterial strains, plasmids, and primers.
The strains, plasmids, and primers used in this study are listed in Table S1 in the supplemental material. To construct pYH1, which was used to induce production of MrpC in an mrpC mutant background, primers Pvan-mrpC F and Pvan-mrpC R were used to generate a PCR product using chromosomal DNA from M. xanthus strain DK1622 as the template. The product was digested with NdeI and EcoRI and mixed with pMR3692 (also digested with the same restriction enzymes) in a Gibson assembly reaction to enzymatically join the overlapping DNA fragments (69). The reaction mixture was transformed into Escherichia coli strain DH5α with outgrowth in Luria-Bertani (LB) liquid prior to plating on LB agar supplemented with 50 μg/ml kanamycin sulfate for selection at 37°C. The DNA sequence of the joined fragments was verified, and the plasmid was transformed into M. xanthus strain SW2808 using electroporation (70), with outgrowth in Casitone-Tris (CTT) liquid (see below for description of medium) prior to plating on CTT agar supplemented with 40 μg/ml kanamycin sulfate to select transformants. Ectopic integration of pYH1 was verified by colony PCR using primers pMR3691 MCS G-F and mrpC qPCR R. The resulting strain was named YH1.
Growth and development.
M. xanthus was grown at 32°C on CTT agar (1% Casitone, 10 mM Tris-HCl [pH 8.0], 1 mM KH2PO4·K2HPO4, 8 mM MgSO4, [final pH 7.6], 1.5% agar) or in CTTYE liquid medium (CTT with 0.2% yeast extract) with shaking at 350 rpm. Development was performed under submerged culture conditions in 8.5-cm-diameter plastic petri dishes or in 3.5-cm-diameter wells of plastic 6-well plates with starvation buffer MC7 (10 mM morpholinepropanesulfonic acid [MOPS] [pH 7.0], 1 mM CaCl2) (47). Briefly, cells from log-phase cultures in CTTYE liquid were collected by centrifugation and resuspended in MC7 to 1,000 Klett units. Either 1.5 ml of the cell suspension was added to 10.5 ml of MC7 in a petri dish or 240 μl of the cell suspension was added to 1.6 ml MC7 in one well of a 6-well plate. Upon incubation at 32°C, cells formed a biofilm at the bottom of the plate. At 18 h PS, the overlay was replaced with fresh MC7 as a control or with different concentrations of CTTYE to observe the effect of adding nutrient medium. To induce the production of MrpC from Pvan-mrpC, 0.5 mM vanillate was added during growth when the culture reached 50 Klett units, and 0.5 mM vanillate was added after cells were collected and resuspended in MC7 at the beginning of submerged culture development.
Microscopy.
The images of developing fruiting bodies were taken with a Leica Wild M8 microscope equipped with an Olympus E-620 digital camera.
Sample collection.
Samples were collected from petri dish submerged cultures unless indicated in the figure legends that 6-well plates were used. To collect samples from petri dishes, at the indicated times, the overlay was replaced with 5 ml of MC7. Cells were scraped from the plate, and the entire contents were aspirated into a 15-ml plastic tube. Samples were mixed thoroughly by pipetting and vortexing as described previously (35). For immunoblot analysis, a 0.1-ml aliquot was mixed with an equal volume of 2× sample buffer (0.125 M Tris-HCl [pH 6.8], 20% glycerol, 4% sodium dodecyl sulfate [SDS], 0.2% bromophenol blue, 0.2 M dithiothreitol), boiled for 5 min, and stored at −20°C. For total protein analysis and/or spore measurement, a 0.4-ml aliquot was stored at −20°C. The rest of the sample (4.5 ml) was treated with 0.5 ml of RNase stop solution (5% phenol [pH < 7] in ethanol) and subjected to flash-freezing in dry ice-ethanol before storing at −80°C.
To collect samples from submerged cultures in 6-well plates, cells were scraped from one well, and the entire contents were aspirated in to a 15-ml plastic tube and thoroughly mixed as described previously (35). For immunoblot analysis, a 0.1-ml aliquot was prepared and stored as described above. For total protein analysis and/or spore measurement, a 0.4-ml aliquot was stored at −20°C. For the β-galactosidase assay, the overlay was replaced with 1 ml of MC7, cells were scraped and mixed thoroughly, and one 0.4-ml aliquot was collected and stored at −20°C.
Spore measurement.
Sonication-resistant spores and mature spores were measured as described previously (35). Briefly, a 0.4-ml aliquot collected as described above was sonicated for 10-s intervals three times with cooling on ice between. A Neubauer chamber was used to count sonication-resistant spores. To measure mature spores, samples were incubated at 50°C for 2 h before sonication, serial dilutions were made in MC7, aliquots (0.1 ml) were mixed with 2.5 ml CTT soft (0.7%) agar and plated on CTT agar, and colonies were counted after incubation at 32°C for 10 days.
RNA extraction and analysis.
RNA was extracted from samples collected as described above and treated with RNase stop solution. RNA was extracted using the hot-phenol method, and the RNA was digested with DNase I (Roche) as described previously (65). Total RNA (1 μg) was used to synthesize cDNA with Superscript III reverse transcriptase (Lifetech) and random primers (Promega), according to the manufacturer's instructions. Control reactions were not subjected to cDNA synthesis. Quantitative PCR (qPCR) was performed as described previously (5). Briefly, cDNA was subjected to qPCR in quadruplicate using a LightCycler 480 system (Roche). Gene expression was quantified using the relative standard curve method (user bulletin 2; Applied Biosystems, MA, USA), with a standard curve generated with M. xanthus DK1622 chromosomal DNA for each set of qPCRs. The transcript level in each sample was normalized to the amount of 16S rRNA, which was also determined by qPCR and served as an internal control. The resulting values were further normalized to the average of the 18-h-PS samples, which was set as 1.
Total protein and immunoblot analyses.
For total protein analysis, a 0.4-ml aliquot was sonicated as described above for spore measurement and centrifuged at 10,000 × g for 1 min, and the protein content in the supernatant was measured using a Bradford (71) assay kit (catalog number 5000006; Bio-Rad Laboratories). For immunoblot analysis, we used a semiquantitative method to measure the relative levels of MrpC and FruA, as described previously (5). Briefly, an equal volume of each sample was subject to SDS-PAGE and immunoblotting, as described previously (72), with anti-MrpC (1:20,000 dilution) or anti-FruA antibodies (1:1,000 dilution). On each immunoblot, a sample of the wild-type strain DK1622 at 18 h PS served as an internal control for normalization of signal intensities across immunoblots. Signals were detected using a ChemiDoc MP imaging system (Bio-Rad), with exposure times short enough to ensure that signals were not saturated, and signal intensities were quantified using Image Lab 5.1 software (Bio-Rad) with the global analysis setting. After normalization to the internal control, each signal intensity was divided by the total protein concentration of the corresponding sample. The resulting values were further normalized to the average of the 18-h-PS samples, which was set as 1.
Protein stability.
The culture supernatant was replaced with fresh starvation buffer or different percentages of CTTYE at 18 h PS and then supplemented with 200 μg/ml chloramphenicol at 27 h of total incubation. Samples were collected immediately and at 15-min intervals for 1 h for total protein and immunoblot analyses, as described above, except without an internal control, since only signals on the same blot were compared. Each signal intensity was divided by the total protein concentration of the corresponding sample and then normalized to the value for the relevant sample collected immediately after chloramphenicol addition, which was set as 1. The natural log of the resulting values was plotted against the time after chloramphenicol addition, and the slope of a linear fit of the data was used to calculate the protein half-life, assuming a first-order kinetic degradation reaction, as described previously (66).
β-Galactosidase assay.
Samples collected and stored as described above for the β-galactosidase assay were thawed on ice and then sonicated and centrifuged as described above for total protein analysis. The β-galactosidase-specific activity of the supernatant was determined as described previously (73) using o-nitrophenyl-β-d-galactoside (ONPG) as the substrate. Optical densities were read using a microplate reader SpectraMax M2 (Molecular Devices), and the specific activity was calculated using the following equation: (213 × OD420)/[(milliliter of supernatant assayed)(milligrams of protein/milliliter of supernatant)(minutes of incubation)] (OD420, optical density at 420 nm).
Supplementary Material
ACKNOWLEDGMENTS
We thank Oleg Igoshin for discussions about the ultrasensitive response, Mitch Singer for providing bacterial strains, and Shreya Saha for suggesting primers for RNA analysis.
This research was supported by National Science Foundation grant MCB-1411272 and by salary support for L.K. from Michigan State University AgBioResearch.
Footnotes
Supplemental material for this article may be found at https://doi.org/10.1128/JB.00456-18.
REFERENCES
- 1.Yang Z, Higgs P. 2014. Myxobacteria: genomics, cellular and molecular biology. Caister Academic Press, Norfolk, UK. [Google Scholar]
- 2.Kaiser D., Robinson M., Kroos L. 2010. Myxobacteria, polarity, and multicellular morphogenesis. Cold Spring Harb Perspect Biol 2:a000380. doi: 10.1101/cshperspect.a000380. [DOI] [PMC free article] [PubMed] [Google Scholar]
- 3.O'Connor KA, Zusman DR. 1991. Development in Myxococcus xanthus involves differentiation into two cell types, peripheral rods and spores. J Bacteriol 173:3318–3333. doi: 10.1128/jb.173.11.3318-3333.1991. [DOI] [PMC free article] [PubMed] [Google Scholar]
- 4.Lee B, Holkenbrink C, Treuner-Lange A, Higgs PI. 2012. Myxococcus xanthus developmental cell fate production: heterogeneous accumulation of developmental regulatory proteins and reexamination of the role of MazF in developmental lysis. J Bacteriol 194:3058–3068. doi: 10.1128/JB.06756-11. [DOI] [PMC free article] [PubMed] [Google Scholar]
- 5.Saha S, Patra P, Igoshin OA, Kroos L. 2018. Systematic analysis of the Myxococcus xanthus developmental gene regulatory network supports posttranslational regulation of FruA by C-signaling. bioRxiv http://biorxiv.org/cgi/content/short/415331v1. [DOI] [PubMed]
- 6.Wireman JW, Dworkin M. 1977. Developmentally induced autolysis during fruiting body formation by Myxococcus xanthus. J Bacteriol 129:796–802. [DOI] [PMC free article] [PubMed] [Google Scholar]
- 7.Flemming HC, Wingender J, Szewzyk U, Steinberg P, Rice SA, Kjelleberg S. 2016. Biofilms: an emergent form of bacterial life. Nat Rev Microbiol 14:563–575. doi: 10.1038/nrmicro.2016.94. [DOI] [PubMed] [Google Scholar]
- 8.Nadell CD, Drescher K, Foster KR. 2016. Spatial structure, cooperation and competition in biofilms. Nat Rev Microbiol 14:589–600. doi: 10.1038/nrmicro.2016.84. [DOI] [PubMed] [Google Scholar]
- 9.Shapiro J, Dworkin M. 1997. Bacteria as multicellular organisms. Oxford University Press, Oxford. [Google Scholar]
- 10.Wintermute EH, Silver PA. 2010. Dynamics in the mixed microbial concourse. Genes Dev 24:2603–2614. doi: 10.1101/gad.1985210. [DOI] [PMC free article] [PubMed] [Google Scholar]
- 11.Barratt MJ, Lebrilla C, Shapiro HY, Gordon JI. 2017. The gut microbiota, food science, and human nutrition: a timely marriage. Cell Host Microbe 22:134–141. doi: 10.1016/j.chom.2017.07.006. [DOI] [PMC free article] [PubMed] [Google Scholar]
- 12.Kroos L. 2017. Highly signal-responsive gene regulatory network governing Myxococcus development. Trends Genet 33:3–15. doi: 10.1016/j.tig.2016.10.006. [DOI] [PMC free article] [PubMed] [Google Scholar]
- 13.Crawford EW Jr, Shimkets LJ. 2000. The Myxococcus xanthus socE and csgA genes are regulated by the stringent response. Mol Microbiol 37:788–799. doi: 10.1046/j.1365-2958.2000.02039.x. [DOI] [PubMed] [Google Scholar]
- 14.Harris BZ, Kaiser D, Singer M. 1998. The guanosine nucleotide (p)ppGpp initiates development and A-factor production in Myxococcus xanthus. Genes Dev 12:1022–1035. doi: 10.1101/gad.12.7.1022. [DOI] [PMC free article] [PubMed] [Google Scholar]
- 15.Konovalova A, Lobach S, Sogaard-Andersen L. 2012. A RelA-dependent two-tiered regulated proteolysis cascade controls synthesis of a contact-dependent intercellular signal in Myxococcus xanthus. Mol Microbiol 84:260–275. doi: 10.1111/j.1365-2958.2012.08020.x. [DOI] [PubMed] [Google Scholar]
- 16.Konovalova A, Wegener-Feldbrugge S, Sogaard-Andersen L. 2012. Two intercellular signals required for fruiting body formation in Myxococcus xanthus act sequentially but non-hierarchically. Mol Microbiol 86:65–81. doi: 10.1111/j.1365-2958.2012.08173.x. [DOI] [PubMed] [Google Scholar]
- 17.Kim SK, Kaiser D. 1990. C-factor: a cell-cell signaling protein required for fruiting body morphogenesis of M. xanthus. Cell 61:19–26. doi: 10.1016/0092-8674(90)90211-V. [DOI] [PubMed] [Google Scholar]
- 18.Lobedanz S, Sogaard-Andersen L. 2003. Identification of the C-signal, a contact-dependent morphogen coordinating multiple developmental responses in Myxococcus xanthus. Genes Dev 17:2151–2161. doi: 10.1101/gad.274203. [DOI] [PMC free article] [PubMed] [Google Scholar]
- 19.Boynton TO, Shimkets LJ. 2015. Myxococcus CsgA, Drosophila Sniffer, and human HSD17B10 are cardiolipin phospholipases. Genes Dev 29:1903–1914. doi: 10.1101/gad.268482.115. [DOI] [PMC free article] [PubMed] [Google Scholar]
- 20.Ellehauge E, Norregaard-Madsen M, Sogaard-Andersen L. 1998. The FruA signal transduction protein provides a checkpoint for the temporal co-ordination of intercellular signals in Myxococcus xanthus development. Mol Microbiol 30:807–817. doi: 10.1046/j.1365-2958.1998.01113.x. [DOI] [PubMed] [Google Scholar]
- 21.Ogawa M, Fujitani S, Mao X, Inouye S, Komano T. 1996. FruA, a putative transcription factor essential for the development of Myxococcus xanthus. Mol Microbiol 22:757–767. doi: 10.1046/j.1365-2958.1996.d01-1725.x. [DOI] [PubMed] [Google Scholar]
- 22.Sun H, Shi W. 2001. Genetic studies of mrp, a locus essential for cellular aggregation and sporulation of Myxococcus xanthus. J Bacteriol 183:4786–4795. doi: 10.1128/JB.183.16.4786-4795.2001. [DOI] [PMC free article] [PubMed] [Google Scholar]
- 23.Sun H, Shi W. 2001. Analyses of mrp genes during Myxococcus xanthus development. J Bacteriol 183:6733–6739. doi: 10.1128/JB.183.23.6733-6739.2001. [DOI] [PMC free article] [PubMed] [Google Scholar]
- 24.Robinson M, Son B, Kroos D, Kroos L. 2014. Transcription factor MrpC binds to promoter regions of many developmentally-regulated genes in Myxococcus xanthus. BMC Genomics 15:1123. doi: 10.1186/1471-2164-15-1123. [DOI] [PMC free article] [PubMed] [Google Scholar]
- 25.Ueki T, Inouye S. 2003. Identification of an activator protein required for the induction of fruA, a gene essential for fruiting body development in Myxococcus xanthus. Proc Natl Acad Sci U S A 100:8782–8787. doi: 10.1073/pnas.1533026100. [DOI] [PMC free article] [PubMed] [Google Scholar]
- 26.Campbell A, Viswanathan P, Barrett T, Son B, Saha S, Kroos L. 2015. Combinatorial regulation of the dev operon by MrpC2 and FruA during Myxococcus xanthus development. J Bacteriol 197:240–251. doi: 10.1128/JB.02310-14. [DOI] [PMC free article] [PubMed] [Google Scholar]
- 27.Lee J, Son B, Viswanathan P, Luethy P, Kroos L. 2011. Combinatorial regulation of fmgD by MrpC2 and FruA during Myxococcus xanthus development. J Bacteriol 193:1681–1689. doi: 10.1128/JB.01541-10. [DOI] [PMC free article] [PubMed] [Google Scholar]
- 28.Mittal S, Kroos L. 2009. A combination of unusual transcription factors binds cooperatively to control Myxococcus xanthus developmental gene expression. Proc Natl Acad Sci U S A 106:1965–1970. doi: 10.1073/pnas.0808516106. [DOI] [PMC free article] [PubMed] [Google Scholar]
- 29.Mittal S, Kroos L. 2009. Combinatorial regulation by a novel arrangement of FruA and MrpC2 transcription factors during Myxococcus xanthus development. J Bacteriol 191:2753–2763. doi: 10.1128/JB.01818-08. [DOI] [PMC free article] [PubMed] [Google Scholar]
- 30.Son B, Liu Y, Kroos L. 2011. Combinatorial regulation by MrpC2 and FruA involves three sites in the fmgE promoter region during Myxococcus xanthus development. J Bacteriol 193:2756–2766. doi: 10.1128/JB.00205-11. [DOI] [PMC free article] [PubMed] [Google Scholar]
- 31.Rajagopalan R, Kroos L. 2017. The dev operon regulates the timing of sporulation during Myxococcus xanthus development. J Bacteriol 199:e0078816. doi: 10.1128/JB.00788-16. [DOI] [PMC free article] [PubMed] [Google Scholar]
- 32.Thöny-Meyer L, Kaiser D. 1993. devRS, an autoregulated and essential genetic locus for fruiting body development in Myxococcus xanthus. J Bacteriol 175:7450–7462. doi: 10.1128/jb.175.22.7450-7462.1993. [DOI] [PMC free article] [PubMed] [Google Scholar]
- 33.Viswanathan P, Murphy K, Julien B, Garza AG, Kroos L. 2007. Regulation of dev, an operon that includes genes essential for Myxococcus xanthus development and CRISPR-associated genes and repeats. J Bacteriol 189:3738–3750. doi: 10.1128/JB.00187-07. [DOI] [PMC free article] [PubMed] [Google Scholar]
- 34.Rajagopalan R, Wielgoss S, Lippert G, Velicer GJ, Kroos L. 2015. devI is an evolutionarily young negative regulator of Myxococcus xanthus development. J Bacteriol 197:1249–1262. doi: 10.1128/JB.02542-14. [DOI] [PMC free article] [PubMed] [Google Scholar]
- 35.Rajagopalan R, Kroos L. 2014. Nutrient-regulated proteolysis of MrpC halts expression of genes important for commitment to sporulation during Myxococcus xanthus development. J Bacteriol 196:2736–2747. doi: 10.1128/JB.01692-14. [DOI] [PMC free article] [PubMed] [Google Scholar]
- 36.Kim SK, Kaiser D. 1990. Cell motility is required for the transmission of C-factor, an intercellular signal that coordinates fruiting body morphogenesis of Myxococcus xanthus. Genes Dev 4:896–905. doi: 10.1101/gad.4.6.896. [DOI] [PubMed] [Google Scholar]
- 37.Kim SK, Kaiser D. 1990. Cell alignment required in differentiation of Myxococcus xanthus. Science 249:926–928. doi: 10.1126/science.2118274. [DOI] [PubMed] [Google Scholar]
- 38.Kroos L, Hartzell P, Stephens K, Kaiser D. 1988. A link between cell movement and gene expression argues that motility is required for cell-cell signaling during fruiting body development. Genes Dev 2:1677–1685. doi: 10.1101/gad.2.12a.1677. [DOI] [PubMed] [Google Scholar]
- 39.O'Connor KA, Zusman DR. 1989. Patterns of cellular interactions during fruiting-body formation in Myxococcus xanthus. J Bacteriol 171:6013–6042. doi: 10.1128/jb.171.11.6013-6024.1989. [DOI] [PMC free article] [PubMed] [Google Scholar]
- 40.Sager B, Kaiser D. 1993. Two cell-density domains within the Myxococcus xanthus fruiting body. Proc Natl Acad Sci U S A 90:3690–3694. [DOI] [PMC free article] [PubMed] [Google Scholar]
- 41.Shi W, Ngok FK, Zusman DR. 1996. Cell density regulates cellular reversal frequency in Myxococcus xanthus. Proc Natl Acad Sci U S A 93:4142–4146. [DOI] [PMC free article] [PubMed] [Google Scholar]
- 42.Søgaard-Andersen L, Kaiser D. 1996. C factor, a cell-surface-associated intercellular signaling protein, stimulates the cytoplasmic Frz signal transduction system in Myxococcus xanthus. Proc Natl Acad Sci U S A 93:2675–2679. [DOI] [PMC free article] [PubMed] [Google Scholar]
- 43.Søgaard-Andersen L, Slack F, Kimsey H, Kaiser D. 1996. Intercellular C-signaling in Myxococcus xanthus involves a branched signal transduction pathway. Genes Dev 10:740–754. doi: 10.1101/gad.10.6.740. [DOI] [PubMed] [Google Scholar]
- 44.Blackhart BD, Zusman DR. 1985. “Frizzy” genes of Myxococcus xanthus are involved in control of frequency of reversal of gliding motility. Proc Natl Acad Sci U S A 82:8767–8770. [DOI] [PMC free article] [PubMed] [Google Scholar]
- 45.Jelsbak L, Sogaard-Andersen L. 1999. The cell surface-associated intercellular C-signal induces behavioral changes in individual Myxococcus xanthus cells during fruiting body morphogenesis. Proc Natl Acad Sci U S A 96:5031–5036. [DOI] [PMC free article] [PubMed] [Google Scholar]
- 46.Jelsbak L, Sogaard-Andersen L. 2002. Pattern formation by a cell surface-associated morphogen in Myxococcus xanthus. Proc Natl Acad Sci U S A 99:2032–2037. doi: 10.1073/pnas.042535699. [DOI] [PMC free article] [PubMed] [Google Scholar]
- 47.Kuner JM, Kaiser D. 1982. Fruiting body morphogenesis in submerged cultures of Myxococcus xanthus. J Bacteriol 151:458–461. [DOI] [PMC free article] [PubMed] [Google Scholar]
- 48.Müller FD, Schink CW, Hoiczyk E, Cserti E, Higgs PI. 2012. Spore formation in Myxococcus xanthus is tied to cytoskeleton functions and polysaccharide spore coat deposition. Mol Microbiol 83:486–505. doi: 10.1111/j.1365-2958.2011.07944.x. [DOI] [PMC free article] [PubMed] [Google Scholar]
- 49.Wartel M, Ducret A, Thutupalli S, Czerwinski F, Le Gall AV, Mauriello EM, Bergam P, Brun YV, Shaevitz J, Mignot T. 2013. A versatile class of cell surface directional motors gives rise to gliding motility and sporulation in Myxococcus xanthus. PLoS Biol. 11:e1001728. doi: 10.1371/journal.pbio.1001728. [DOI] [PMC free article] [PubMed] [Google Scholar]
- 50.Licking E, Gorski L, Kaiser D. 2000. A common step for changing cell shape in fruiting body and starvation-independent sporulation of Myxococcus xanthus. J Bacteriol 182:3553–3558. doi: 10.1128/JB.182.12.3553-3558.2000. [DOI] [PMC free article] [PubMed] [Google Scholar]
- 51.Müller FD, Treuner-Lange A, Heider J, Huntley SM, Higgs PI. 2010. Global transcriptome analysis of spore formation in Myxococcus xanthus reveals a locus necessary for cell differentiation. BMC Genomics 11:264. doi: 10.1186/1471-2164-11-264. [DOI] [PMC free article] [PubMed] [Google Scholar]
- 52.Ueki T, Inouye S. 2005. Identification of a gene involved in polysaccharide export as a transcription target of FruA, an essential factor for Myxococcus xanthus development. J Biol Chem 280:32279–32284. doi: 10.1074/jbc.M507191200. [DOI] [PubMed] [Google Scholar]
- 53.Ray JC, Tabor JJ, Igoshin OA. 2011. Non-transcriptional regulatory processes shape transcriptional network dynamics. Nat Rev Microbiol 9:817–828. doi: 10.1038/nrmicro2667. [DOI] [PMC free article] [PubMed] [Google Scholar]
- 54.Bullock HA, Shen H, Boynton TO, Shimkets LJ. 2018. Fatty acid oxidation is required for Myxococcus xanthus development. J Bacteriol 200:e00572-17. doi: 10.1128/JB.00572-17. [DOI] [PMC free article] [PubMed] [Google Scholar]
- 55.Giglio KM, Zhu C, Klunder C, Kummer S, Garza AG. 2015. The enhancer binding protein Nla6 regulates developmental genes that are important for Myxococcus xanthus sporulation. J Bacteriol 197:1276–1287. doi: 10.1128/JB.02408-14. [DOI] [PMC free article] [PubMed] [Google Scholar]
- 56.Kim SK, Kaiser D. 1991. C-factor has distinct aggregation and sporulation thresholds during Myxococcus development. J Bacteriol 173:1722–1728. doi: 10.1128/jb.173.5.1722-1728.1991. [DOI] [PMC free article] [PubMed] [Google Scholar]
- 57.Kruse T, Lobedanz S, Berthelsen NM, Sogaard-Andersen L. 2001. C-signal: a cell surface-associated morphogen that induces and co-ordinates multicellular fruiting body morphogenesis and sporulation in Myxococcus xanthus. Mol Microbiol 40:156–168. doi: 10.1046/j.1365-2958.2001.02365.x. [DOI] [PubMed] [Google Scholar]
- 58.Li S-F, Lee B, Shimkets LJ. 1992. csgA expression entrains Myxococcus xanthus development. Genes Dev 6:401–410. doi: 10.1101/gad.6.3.401. [DOI] [PubMed] [Google Scholar]
- 59.Dubnau D, Losick R. 2006. Bistability in bacteria. Mol Microbiol 61:564–572. doi: 10.1111/j.1365-2958.2006.05249.x. [DOI] [PubMed] [Google Scholar]
- 60.Smits WK, Kuipers OP, Veening JW. 2006. Phenotypic variation in bacteria: the role of feedback regulation. Nat Rev Microbiol 4:259–271. doi: 10.1038/nrmicro1381. [DOI] [PubMed] [Google Scholar]
- 61.Kroos L, Kaiser D. 1987. Expression of many developmentally regulated genes in Myxococcus depends on a sequence of cell interactions. Genes Dev 1:840–854. doi: 10.1101/gad.1.8.840. [DOI] [PubMed] [Google Scholar]
- 62.McLaughlin PT, Bhardwaj V, Feeley BE, Higgs PI. 2018. MrpC, a CRP/Fnr homolog, functions as a negative autoregulator during the Myxococcus xanthus multicellular developmental program. Mol Microbiol 109:245–261. doi: 10.1111/mmi.13982. [DOI] [PubMed] [Google Scholar]
- 63.Nariya H, Inouye S. 2005. Identification of a protein Ser/Thr kinase cascade that regulates essential transcriptional activators in Myxococcus xanthus development. Mol Microbiol 58:367–379. doi: 10.1111/j.1365-2958.2005.04826.x. [DOI] [PubMed] [Google Scholar]
- 64.Nariya H, Inouye S. 2006. A protein Ser/Thr kinase cascade negatively regulates the DNA-binding activity of MrpC, a smaller form of which may be necessary for the Myxococcus xanthus development. Mol Microbiol 60:1205–1217. doi: 10.1111/j.1365-2958.2006.05178.x. [DOI] [PubMed] [Google Scholar]
- 65.Higgs PI, Jagadeesan S, Mann P, Zusman DR. 2008. EspA, an orphan hybrid histidine protein kinase, regulates the timing of expression of key developmental proteins of Myxococcus xanthus. J Bacteriol 190:4416–4426. doi: 10.1128/JB.00265-08. [DOI] [PMC free article] [PubMed] [Google Scholar]
- 66.Schramm A, Lee B, Higgs PI. 2012. Intra- and inter-protein phosphorylation between two hybrid histidine kinases controls Myxococcus xanthus developmental progression. J Biol Chem 287:25060–25072. doi: 10.1074/jbc.M112.387241. [DOI] [PMC free article] [PubMed] [Google Scholar]
- 67.Iniesta AA, Garcia-Heras F, Abellon-Ruiz J, Gallego-Garcia A, Elias-Arnanz M. 2012. Two systems for conditional gene expression in Myxococcus xanthus inducible by isopropyl-β-d-thiogalactopyranoside or vanillate. J Bacteriol 194:5875–5885. doi: 10.1128/JB.01110-12. [DOI] [PMC free article] [PubMed] [Google Scholar]
- 68.Xie C, Zhang H, Shimkets LJ, Igoshin OA. 2011. Statistical image analysis reveals features affecting fates of Myxococcus xanthus developmental aggregates. Proc Natl Acad Sci U S A 108:5915–5920. doi: 10.1073/pnas.1018383108. [DOI] [PMC free article] [PubMed] [Google Scholar]
- 69.Gibson DG, Young L, Chuang RY, Venter JC, Hutchison CA III, Smith HO. 2009. Enzymatic assembly of DNA molecules up to several hundred kilobases. Nat Methods 6:343–345. doi: 10.1038/nmeth.1318. [DOI] [PubMed] [Google Scholar]
- 70.Kashefi K, Hartzell P. 1995. Genetic suppression and phenotypic masking of a Myxococcus xanthus frzF− defect. Mol Microbiol 15:483–494. doi: 10.1111/j.1365-2958.1995.tb02262.x. [DOI] [PubMed] [Google Scholar]
- 71.Bradford M. 1976. A rapid and sensitive method for the quantitation of microgram quantities of protein utilizing the principle of protein-dye binding. Anal Biochem 72:248–254. doi: 10.1016/0003-2697(76)90527-3. [DOI] [PubMed] [Google Scholar]
- 72.Yoder-Himes D, Kroos L. 2006. Regulation of the Myxococcus xanthus C-signal-dependent Ω4400 promoter by the essential developmental protein FruA. J Bacteriol 188:5167–5176. doi: 10.1128/JB.00318-06. [DOI] [PMC free article] [PubMed] [Google Scholar]
- 73.Kroos L, Kuspa A, Kaiser D. 1986. A global analysis of developmentally regulated genes in Myxococcus xanthus. Dev Biol 117:252–266. doi: 10.1016/0012-1606(86)90368-4. [DOI] [PubMed] [Google Scholar]
Associated Data
This section collects any data citations, data availability statements, or supplementary materials included in this article.