Key Points
WT macrophages fixed hemolysis/microcytic anemia, improved kidney iron deposition, and restored iron homeostasis in Hmox1-deficient mice.
WT macrophages engrafted and proliferated in the liver to protect the Hmox1-deficient mice for at least 22 weeks.
Abstract
Heme oxygenase 1 (HMOX1), the inducible enzyme that catabolizes the degradation of heme into biliverdin, iron, and carbon monoxide, plays an essential role in the clearance of senescent and damaged red blood cells, systemic iron homeostasis, erythropoiesis, vascular hemostasis, and oxidative and inflammatory stress responses. In humans, HMOX1 deficiency causes a rare and lethal disease, characterized by severe anemia, intravascular hemolysis, as well as vascular and tissue damage. Hmox1 knockout (KO) mice recapitulated the phenotypes of HMOX1-deficiency patients and could be rescued by bone marrow (BM) transplantation that engrafted donor’s hematopoietic stem cells into the recipient animals after myeloablation. To find better therapy and elucidate the contribution of macrophages to the pathogenesis of HMOX1-deficiency disease, we infused wild-type (WT) macrophages into Hmox1 KO mice. Results showed that WT macrophages engrafted and proliferated in the livers of Hmox1 KO mice, which corrected the microcytic anemia, rescued the intravascular hemolysis, restored iron homeostasis, eliminated kidney iron overload and tissue damage, and provided long-term protection. These results showed that a single macrophage infusion delivered a long-term curative effect in Hmox1 KO mice, obviating the need for BM transplantation, and suggested that the HMOX1 disease stems mainly from the loss of viable reticuloendothelial macrophages. Our work provides new insights into the etiology of HMOX1 deficiency and demonstrates the potential of infusion of WT macrophages to prevent disease in patients with HMOX1 deficiency and potentially other macrophage-related diseases.
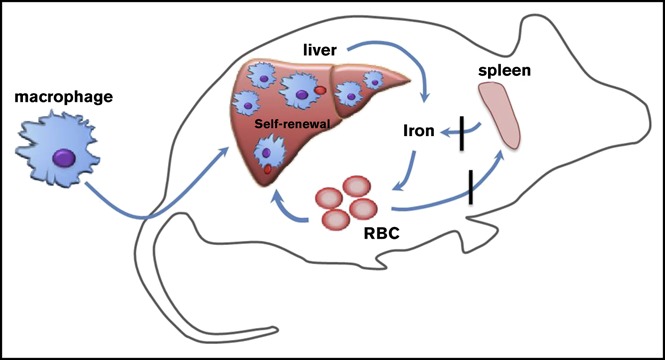
Visual Abstract
Introduction
Iron is an essential element for human health. One of its major roles is to function as a metal ion in heme, an important prosthetic group for many proteins involved in oxygen transport, energy generation, drug detoxification, and signal transduction.1,2 Because free heme readily induces oxidative stress to damage cells and tissues, heme levels are tightly controlled by 2 heme oxygenases (HMOX1 and HMOX2). HMOXs metabolize free heme into iron, as well as biliverdin and carbon monoxide, 2 molecules that play important roles in vivo as antioxidant and signaling molecules. HMOX2 is constitutively expressed under homeostatic conditions. By contrast, HMOX1 is an inducible enzyme that is highly expressed in response to heme accumulation and stress conditions including oxidative stress, exposure to heavy metals and endotoxins, heat shock, and inflammation.3 HMOX1 is normally highly expressed in reticuloendothelial macrophages, which include splenic macrophages, Kupffer cells, and bone marrow (BM) macrophages, to degrade heme from phagocytosed red blood cells (RBCs) and recycle iron for RBC production. Considering that 2 million to 3 million RBCs are recycled in reticuloendothelial macrophages per second and iron recycled in the process accounts for 90% of daily iron consumption, HMOX1 plays a central role in normal RBC turnover and systemic iron homeostasis.4,5
The essential role of HMOX1 is underscored by the HMOX1-deficiency disease of humans6-8 and in an Hmox1 knockout (KO) mouse model.9,10 HMOX1-deficiency patients suffered from growth retardation, severe anemia, intravascular hemolysis, hepatic and renal iron overload, endothelial and vascular injury, vulnerability to stress injury, intracranial hemorrhage, and early death.7,11 Hmox1 KO mice recapitulated the symptoms of HMOX1 patients, showing partial embryonic lethality, as only 10% to 20% of expected Hmox1−/− mice from heterozygous matings were viable at birth.12 The surviving animals displayed microcytic anemia, hemolysis, tissue iron overload, serum iron deficiency, and splenic pathology ranging from splenomegaly to fibrosis.9,12 Hmox1−/− macrophages were able to phagocytose RBCs, but were unable to metabolize heme, and resultant stresses caused by heme accumulation led to cellular necrosis within hours, confirming the essential role of Hmox1 in erythrophagocytic macrophages.9 Additionally, numbers of F4/80+ macrophages diminished in the spleen, liver, and BM of Hmox1 KO mice and were also absent in the livers of the HMOX1 patients, suggesting that HMOX1 diseases are likely due to macrophage deficiency caused by their inability to digest large boluses of heme and recycle iron from phagocytosed RBCs. Young Hmox1 KO mice also displayed a defect in forming erythropoietic islands in BM, suggesting a potential role of Hmox1 in terminal erythropoiesis.13 Transplantation of wild-type (WT) BM to Hmox1 KO mice reconstituted the reticuloendothelial macrophages in the liver and rescued the anemia, hemolysis, serum iron deficiency, and tissue iron overload problems, suggesting that BM transplantation could represent a promising therapy to treat the disease.10 Indeed, CD34+ hematopoietic stem cell (HSC) transplantation recently was successfully performed on a patient, which corrected the hemolysis and proteinuria and normalized blood biochemistry.14
Recently, lineage-tracing studies have suggested that resident macrophages can self-renew and hematopoietic progenitors derived from BM are not needed. During hemolytic crises, Ly-6Chigh monocytes in the peripheral blood phagocytosed damaged RBCs, and accumulated in the liver, where they subsequently differentiated into F4/80high/ferroportin (FPN)-expressing Kupffer-like cells.15 Although the majority of these monocytic cells declined 3 days after the hemolytic crisis, they displayed the potential to become long-lived self-renewing cells if the embryo-derived resident Kupffer cells are ablated prior to the hemolytic crisis to leave the monocyte-Kupffer cell niche available for these engrafted cells.16 Because reticuloendothelial macrophages are absent in Hmox1 KO mice and HMOX1 patients, we speculated that exogenously grown macrophages could engraft in the liver to phagocytose senescent RBCs, recycle iron, rescue the hemolysis and microcytic anemia, and prevent tissue damage. Macrophage transplantation could circumvent the toxicities associated with myeloablation, providing a simpler and less toxic therapy. In contrast to the transplantation of BM that includes HSCs for all lineages, macrophage transplantation provides a chance to discern the contribution of macrophages relative to other hematopoietic cells in the pathogenesis of the HMOX1 disease.
Here, we infused BM-derived WT macrophages into Hmox1 KO mice. Results showed that macrophage infusion corrected the microcytic anemia, hemolysis, systemic iron dysregulation, tissue iron overload, and tissue damage. Most surprisingly, we found that these macrophages resided and self-renewed in the liver. These results suggested that a single infusion of macrophages could confer long-term protection from developing HMOX1-deficiency disease.
Methods
Animals
All the animal handling procedures used in this study were approved by the Eunice Kennedy Shriver National Institute of Child Health and Human Development (NICHD) Animal Care and Use Committee (protocol# 15-038), and met National Institutes of Health (NIH) guidelines for humane care of animals. C57BL/6 × FVB HO-1+/− (predominantly C57BL/6) mice10 were generously donated by Anupam Agarwal from the University of Alabama, Birmingham. Age- and sex-matched Hmox1+/+ and Hmox1−/− mice obtained by crossing Hmox1+/− × Hmox1+/− mice were used for the experiments. B6 (CAG-GFP) mice, generously provided by James Pickel (National Institute of Mental Health, NIH), were used as donor mice for BM-derived macrophage (BMDM) culture. Of note, the green fluorescent protein (GFP) fluorescence was bleached due to fixation and paraffinization, and thus it would not interfere with the antibodies for the green channel in immunohistochemistry; we had to use Hmox1 antibody to label WT cells in the experiments.
Macrophage infusion
For macrophage infusion experiments, BMDMs (20 million cells per mouse) were infused into the recipient mice via their tail veins. In a typical experiment, 4 groups of animals (2- to 3-months old, 3-6 mice each) were included: in transplantation groups, Hmox1+/+ or Hmox1−/− mice received macrophage injections, and in phosphate-buffered saline (PBS) control groups, Hmox1+/+ or Hmox1−/− mice were injected with same volume of PBS. Sirolimus (3 mg/kg; LC Laboratories) was used as a mild immunosuppressant by daily intraperitoneal injection from 1 day before the macrophage infusion until 2 weeks after infusion for all 4 groups.
Supplemental methods
See supplemental Methods for BMDM culture, blood analysis, iron measurement, western blot analysis, 5-bromo-2′-deoxyuridine (BrdU) incorporation, immunostaining, Perls’ staining, quantitative reverse transcription polymerase chain reaction (qRT-PCR), and flow cytometry analysis.
Statistical analysis
All data are expressed as the mean ± standard deviation (SD). Comparisons between 2 groups were done using the unpaired Student t test (2-tailed). Analyses of multiple groups were performed using 2-way analysis of variance (ANOVA) followed by the Tukey multiple comparisons test. All tests were performed with GraphPad Prism7. The data were considered significant when P < .05 (*P < .05, **P < .01, ***P < .001, ****P < .0001).
Results
Macrophage infusion reversed the microcytic anemia of Hmox1 KO mice
BM cells from WT mice were cultured in medium with macrophage colony-stimulating factor (M-CSF) for 6 days to differentiate the cells into macrophages. Prior to cell infusion, flow cytometry analysis showed that F4/80highCD11bhigh cells accounted for 98% of the cells (supplemental Figure 1). These cells also highly expressed CD115, the receptor for M-CSF, Ly6C/G, a marker for macrophage and dendritic cell precursors, but expressed MHC II, a marker for tissue macrophage in relative low levels. Interestingly, Clec4f, a marker for Kupffer cells, was also highly expressed on these cells (supplemental Figure 1).
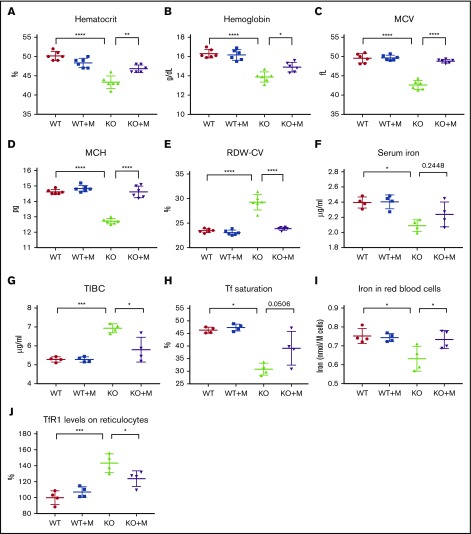
On the day of infusion, a total of 2 × 10⁷ cells were infused into the recipient animals through the tail vein, and the blood indices were analyzed 12 weeks later. Results showed that macrophage infusion significantly increased the hematocrits and hemoglobin contents of Hmox1 KO mice (Figure 1A-B), and the differences in these blood parameters between WT and Hmox1 KO mice diminished, suggesting that macrophage infusion corrected the anemia of Hmox1 KO mice. Macrophage infusion did not change RBC numbers or reticulocyte counts (supplemental Figure 2), but significantly increased the mean corpuscular volume (MCV) and mean corpuscular hemoglobin (MCH) (Figure 1C-D), suggesting that macrophage infusion probably corrects the microcytic anemia by increasing iron availability for RBC production. Consistently, red cell distribution width (RDW-CV) of KO mice was also normalized after macrophage infusion (Figure 1E). Accordingly, we checked serum iron levels and found that serum iron slightly increased after macrophage infusion (Figure 1F). Because the anemia was corrected and associated mild hypoxia anemia likely improved, total iron-binding capacity (TIBC) decreased significantly in macrophage-infused Hmox1 KO mice (Figure 1G), and consequently, transferrin (Tf) saturations increased (Figure 1H; P = .0506). To confirm these results, we measured total iron in RBCs with inductively coupled plasma mass spectrometry and found that the total iron contents per cell increased in the RBCs of macrophage-infused Hmox1 KO mice to the levels of WT RBCs (Figure 1I). In addition, Tf receptor 1 (TfR1) levels on the surface of reticulocytes were elevated in the Hmox1 KO group, but were significantly decreased by macrophage infusion (Figure 1J). Because TfR1 messenger RNA (mRNA) contains iron-responsive elements in its 3′-untranslated region and TfR1 expression inversely correlates with intracellular iron levels,17 this result indicated that iron levels in erythroid cells increased after infusion of WT macrophages. Altogether, these results indicated that macrophage infusion increased iron availability for RBC production and rescued the microcytic anemia of Hmox1 KO mice.
Figure 1.
WT macrophage infusion increased iron levels and rescued microcytic anemia of Hmox1 KO mice. (A) Hematocrits, (B) hemoglobin, (C) MCV, (D) MCH, and (E) RDW-CV of WT and Hmox1−/− (KO) mice without or with macrophage infusion (WT+M and KO+M). (F) Serum iron, (G) TIBC, and (H) Tf saturation of WT and Hmox1 KO mice before and after infusion with macrophages for 12 weeks. (I) Total iron contents per million RBCs of WT and Hmox1 KO mice without or with macrophage infusion for 12 weeks. Iron contents were measured with inductively coupled plasma mass spectrometry. (J) TfR1 levels on reticulocytes of peripheral blood of WT and Hmox1 KO mice without or with macrophage infusion for 12 weeks. TfR1 levels were measured with flow cytometry, then the fluorescence intensity was normalized to WT control group. Mean ± SD; statistical analyses were performed using 2-way ANOVA (multiple comparisons). The graphs were created with GraphPad Prism software. *P < .05, **P < .01, ***P < .001, ****P < .0001.
Macrophage infusion rescued intravascular hemolysis of Hmox1 KO mice
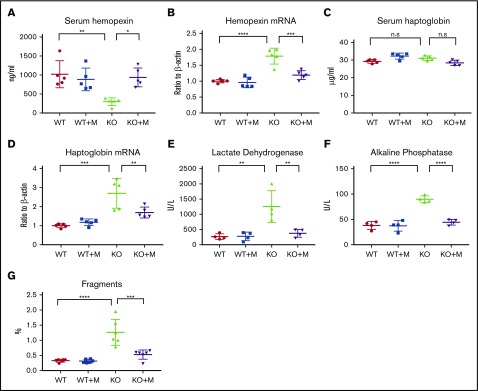
Next, we checked the intravascular hemolysis of Hmox1 KO mice, the major problem of Hmox1-deficient animals.7 Free hemoglobin and heme are highly toxic to the vascular endothelial system. Under physiological conditions, free hemoglobin is sequestered by haptoglobin to form hemoglobin-haptoglobin complexes, which are then captured by haptoglobin receptor/CD163-expressing reticuloendothelial macrophages, and cleared from the blood circulation by receptor-mediated internalization.18 Free heme can be bound by hemopexin, and the heme-hemopexin complex is cleared from the blood circulation via receptor-mediated clearance system in hepatocytes and renal cells.19 Because of the deficiency of the reticuloendothelial macrophages, the free hemoglobin/haptoglobin clearance system is defective in Hmox1 KO mice. The heme/hemopexin clearance system is intact, but the vast amount of free heme overloads the system, causing serum hemopexin deficiency (Figure 2A) and increased hemopexin mRNA expression in liver (Figure 2B), as well as iron overload in hemopexin-clearing cells including renal cells and liver hepatocytes (see next section). Macrophage infusions increased serum hemopexin of Hmox1 KO mice to the levels of WT mice (Figure 2A), and hemopexin mRNA levels (Figure 2B) in liver dramatically decreased, indicating that the pressure to clear free heme was diminished. Though serum haptoglobin levels did not change (Figure 2C), haptoglobin mRNA levels (Figure 2D) significantly decreased in the liver of Hmox1 KO mice after macrophage infusion, suggesting that free hemoglobin was also reduced. Levels of serum lactate dehydrogenase (LDH) and alkaline phosphatase (ALP),20,21 2 known indicators of intravascular hemolysis and tissue damage, doubled or tripled in Hmox1 KO mice, but enzyme levels decreased to the levels of WT mice after treatment (Figure 2E-F). We also checked the serum activity of alanine transaminase and alanine aminotransferase, 2 enzymes associated with liver damage, but did not find significant difference between WT and Hmox1 KO mice (supplemental Figure 3A-B), suggesting that increased LHD and ALP activity did not result from hepatocytic damage. Additionally, we analyzed the RBC integrity by plotting the RBC profile with FlowJo and found that Hmox1 KO mice had more RBC fragments than WT mice, which were reduced by macrophage infusion (Figure 2G; supplemental Figure 3C-E). Collectively, these results indicated that infusion of macrophages prevented the intravascular hemolysis of the Hmox1 KO mice.
Figure 2.
Macrophage infusion rescued intravascular hemolysis of Hmox1 KO mice. (A) Serum hemopexin, (B) liver hemopexin mRNA levels, (C) serum haptoglobin, (D) liver haptoglobin mRNA levels, (E) serum LDH and (F) ALP activity of WT and Hmox1 KO mice before and after macrophage infusion for 12 weeks. (G) RBC fragments in the WT and Hmox1 KO group with or without macrophage infusion. The data were obtained by hematology analyzer and analyzed with FlowJo software. Mean ± SD; statistical analyses were performed using 2-way ANOVA (multiple comparisons). The graphs were created with GraphPad Prism software. *P < .05, **P < .01, ***P < .001, ****P < .0001. n.s, not significant.
Macrophage infusion rescued the kidney iron overload of Hmox1 KO mice
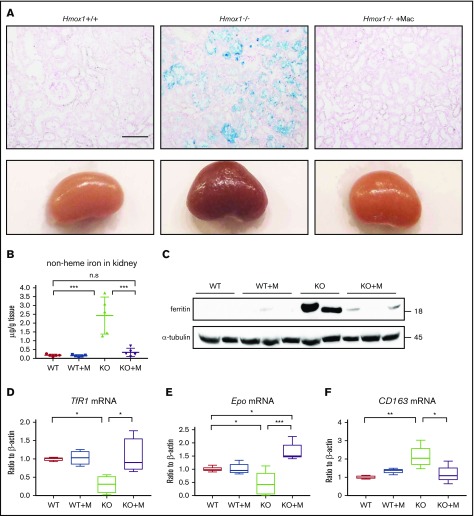
Hemolysis of Hmox1 KO mice led to highly increased absorption of free hemoglobin and heme in the kidneys and subsequently to kidney iron overload, analogous to other diseases characterized by increased intravascular hemolysis, such as sickle cell disease and malaria. Accordingly, kidneys of Hmox1 KO mice were darker than those of WT mice, and Perls’ Prussian Blue staining showed iron accumulation in the renal proximal tubules of Hmox1 KO mice (Figure 3A). Infusion of macrophages for 12 weeks dramatically reduced the kidney discoloration and iron accumulation, indicating that kidney iron overload was reversed. Total nonheme iron levels, which were increased by 10-fold in Hmox1 KO mice, diminished to WT levels after macrophage infusion (Figure 3B), and the levels of the iron storage protein,22 ferritin, which were significantly increased in the kidney lysates of Hmox1 KO mice, dramatically decreased after macrophage infusion (Figure 3C). Accordingly, TfR1 mRNA levels increased almost to the WT levels after macrophage infusion (Figure 3D). Collectively, these results indicated that infusion of macrophages reversed the kidney iron overload of Hmox1 KO mice.
Figure 3.
Macrophage infusion prevented pathological accumulation of iron in kidneys. (A) Kidneys (bottom panel) and Perls’ Prussian Blue iron staining of kidney sections (top panel) of WT, Hmox1 KO mice without or with macrophage infusion. Scale bar, 100 μm. (B) Nonheme iron in kidneys of WT and Hmox1 KO mice without or with macrophage infusion. (C) Western blot analysis of ferritin levels in kidneys of WT and Hmox1 KO mice without or with macrophage (Mac) infusion. qRT-PCR analyses of (D) TfR1 (n = 4), (E) erythropoietin (Epo) (n = 5), and (F) CD163 mRNA (n = 4) levels in the kidneys of WT and Hmox1 KO mice without or with macrophage infusion. All animals were infused with macrophages or PBS for 12 weeks. Mean ± SD; statistical analyses were performed using 2-way ANOVA (multiple comparisons). The graphs were created with GraphPad Prism software. *P < .05, **P < .01, ***P < .001.
Erythropoietin (EPO), the hormone that regulates RBC production, is generated in kidneys by peritubular interstitial fibroblasts in response to anemia and hypoxia. EPO levels are upregulated by hypoxia and anemia and potentially downregulated by iron overload, via the hypoxia-inducible factor 2 α (HIF2α) and proxyl hydroxylase 2 (PHD2) pathway.23 Although the anemia of Hmox1 KO mice (Figure 1) was expected to increase the expression of EPO, EPO mRNA levels were slightly but significantly decreased (Figure 3E) and the serum EPO levels did not increase (supplemental Figure 4), suggesting that EPO dysregulation possibly contributes to the anemia of the Hmox1 KO mice. Notably, macrophage infusion dramatically reduced kidney iron overload and significantly increased EPO mRNA levels (Figure 3E). However, the serum EPO levels did not change either (supplemental Figure 4), suggesting that EPO regulation in Hmox1 KO mice warrants further investigation. The mRNA levels of the haptoglobin receptor, CD163,18 which were significantly increased in the kidneys of Hmox1 KO mice, were decreased by macrophage infusion (Figure 3F), indicating that infusion of macrophages relieved the pressure for kidneys to recycle free hemoglobin. Collectively, these results indicated that macrophage infusions prevented intravascular hemolysis and rescued renal iron overload.
Macrophage infusion improved erythropoiesis despite the absence of cells with detectable Hmox1 activity in the BM and spleen
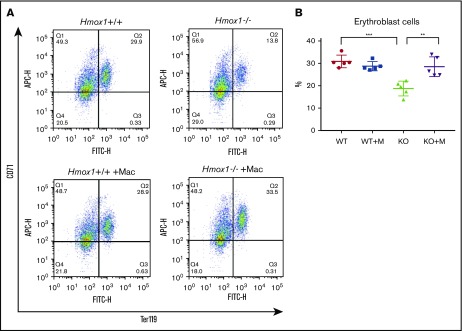
Because BM is the major erythropoietic tissue to generate RBCs, we analyzed erythropoiesis in BM.24 Analyses of the BM cell population with flow cytometry showed that CD71highTer119high erythroblast progenitors of RBCs were significantly decreased in Hmox1 KO mice, but increased after macrophage infusion (Figure 4), suggesting that the macrophage infusion rescues medullary erythropoiesis. Erythropoietic islands are specialized niches within BM in which the central macrophages are thought to provide growth factors and iron, and to facilitate the enucleation of terminal differentiation, playing an important role in erythropoiesis.25 It has been shown that Hmox1 KO macrophages are defective in forming the erythropoietic islands, contributing to the anemia of Hmox1 KO mice.13 To identify macrophages, we checked Hmox1 expression in the BMs with immunofluorescence. Although Hmox1-expressing cells were abundant in WT BM, we could not find any Hmox1+ cells in the BMs of Hmox1 KO mice, even after macrophage infusion (supplemental Figure 5A). In addition, we were unable to detect Hmox1 mRNA in the Hmox1 KO BM cells after macrophage infusions either (supplemental Figure 5B), suggesting that the rescue of the anemia of Hmox1 KO mice is not due to reconstitution of BM erythropoietic islands by stem cells contaminated in the infused cells, or to reconstitution of the erythropoietic island by infused macrophages. We also checked Hmox1 mRNA levels in the spleen (supplemental Figure 5C) and kidney (supplemental Figure 5D), but did not find abundant Hmox1 expression, indicating that infused macrophages did not engraft in BM, spleen, or kidney to rescue the mice.
Figure 4.
Macrophage infusion improved medullar erythropoiesis. (A) Representative plots of flow cytometric analysis of the erythroblast populations in the BM of WT and Hmox1 KO mice without or with macrophage infusion using FITC-CD71 and APC-Ter119 antibodies. The animals were transcardially perfused with PBS before harvesting the BM cells and analysis of the cell populations. (B) The percentages of CD71high/Ter119high erythroblast cells from flow cytometric analysis. All samples were collected at 12 weeks after macrophage infusion. Statistical analyses were performed using 2-way ANOVA (multiple comparisons). The graph was prepared with GraphPad Prism software. **P < .01, ***P < .001. APC-H, allophycocyanin-height; FITC-H, fluorescein isothiocyanate–height.
Macrophage infusion restored the Kupffer cell population in the liver
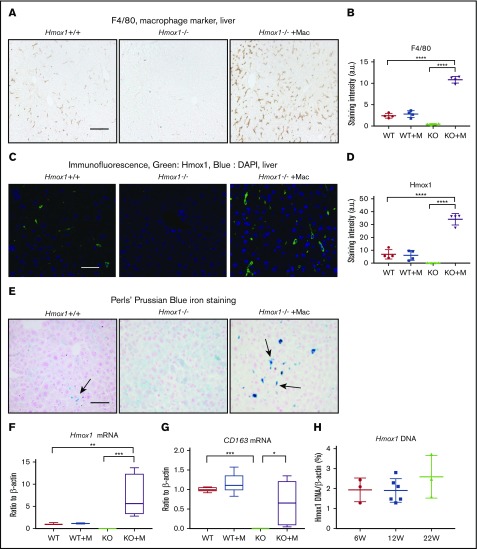
Because the liver plays an essential role in iron homeostasis and hosts the monocyte-derived macrophages in emergency hemolytic crises,15 we checked the F4/80+ macrophages, the Hmox1 expression, and the iron status in the liver. Consistent with previous findings,9 F4/80+ macrophages (Figure 5A) and Hmox1 fluorescence signal (Figure 5B) were absent in the livers of Hmox1 KO mice, confirming that Hmox1 deficiency and resultant heme accumulation/toxicity eliminated all resident macrophages. By contrast, macrophage-infused Hmox1 KO mice showed significantly increased numbers of F4/80+ macrophages, which were fourfold higher than that in WT mice (Figure 5A-D), and Hmox1 fluorescence increased, indicating that infused macrophages engrafted in the liver to rescue Hmox1 KO mice. Besides F4/80, we also checked the expression of Clec4f, another Kupffer cell marker, and found that it was absent in the liver lysates of KO mice but dramatically increased after macrophage infusion (supplemental Figure 6A). These results suggested that infused macrophages settled as Kupffer-like cells in the liver to rescue the Hmox1 KO mice.
Figure 5.
Macrophage infusion restored the Kupffer cell population and iron homeostasis in the liver of Hmox1 KO mice. (A) Immunohistochemistry with the macrophage marker F4/80 detected Kupffer cells in the livers of WT (left) but not Hmox1−/− mice (middle). Macrophage infusion completely restored the macrophage populations in Hmox1−/− mice (right). Scale bar, 100 μm. (B) Quantification of F4/80 staining intensity for each group. No difference in staining was observed between the WT and macrophage-infused WT group, whereas the macrophage-infused KO group showed fivefold higher staining than that of the WT group (4 mice for each group). (C) Hmox1 immunofluorescence was observed in the liver of WT mice (left), but not in KO mice (middle). Macrophage infusion dramatically increased Hmox1 signal (right). Scale bar, 25 μm. (D) Quantification of Hmox1 staining intensity for each group. No difference was observed between the WT and macrophage-infused WT group. The macrophage-infused KO group showed threefold higher Hmox1 levels than the WT group (4 mice for each group). (E) Perls’ Prussian Blue iron staining of paraffin-embedded liver sections. Iron-positive Kupffer cells (indicated by arrows) were observed in WT mice (left), but not in KO mice (middle panel). Macrophage infusion dramatically increased the iron-positive Kupffer cells in KO mice (right panel). Of note, the hepatocytes were positive for iron staining in Hmox1 KO mice but not in WT or macrophage-infused Hmox1 KO mice. Scale bar, 100 μm. (F) Hmox1 and (G) CD163 mRNA levels in the liver of WT and KO mice without or with macrophage infusion (n = 6). (H) The percentage of WT cells in the liver of macrophage-infused KO mice was assessed by quantification of the WT Hmox1 genomic DNA in genomic DNA of actin. Primers that target exon 3 of the Hmox1 gene, which was deleted in Hmox1 KO mice, were used for the quantification. Samples were harvested 6 weeks (W; n = 3), 12 weeks (n = 6), and 22 weeks (n = 3) after macrophage infusion. All samples except panel H were harvested 12 weeks after macrophage infusion. (B,D) The intensity was analyzed using ImageJ. (B,D,F-H) Error bars represent the SD. Statistical analyses were performed using 2-way ANOVA (multiple comparisons). The graphs were done with GraphPad Prism software. *P < .05, **P < .01, ***P < .001, ****P < .0001. a.u., arbitrary unit; DAPI, 4′,6-diamidino-2-phenylindole.
The infusion of macrophages also dramatically changed the iron distribution pattern in the livers (Figure 5E). Because of the deficiency of the erythrophagocytosing macrophages, iron-loaded Kupffer cells (Figure 5E left panel, arrow) were absent in the livers of Hmox1 KO mice; however, hepatocytes accumulated large amounts of iron, presumably by recycling free heme through the heme/hemopexin recycling system (Figure 5E middle panel). Infusion of macrophages significantly increased the iron-loaded macrophages/Kupffer-like cells (Figure 5E right panel), whereas the iron staining in the hepatocytes disappeared, confirming that infused macrophages engrafted in the liver, differentiated into Kupffer cells, recycled senescent RBCs, restored the iron homeostasis, thereby rescued the Hmox1 KO mice. In accordance with these results, Hmox1 and CD163 mRNA levels, which were absent in Hmox1 mice, were dramatically increased in the livers of macrophage-infused Hmox1 mice (Figure 5F-G). Although no differences were observed between WT control and macrophage-infused WT groups (Figure 5B,D), numbers of F4/80+ macrophages (Figure 5A-B), Hmox1-staining levels (Figure 5C-D), Hmox1 mRNA levels (Figure 5F), and iron-positive macrophages/Kupffer cell numbers (Figure 5E) were significantly higher in the livers of macrophage-infused Hmox1 KO group than in the WT group. These results suggest that engrafted macrophages take over the workload of recycling senescent RBCs for the entire reticuloendothelial macrophage system that generally includes macrophages that reside in the liver, spleen, and BM by expanding their numbers.
Next, we measured the total nonheme iron contents of liver, but did not find a significant difference between different groups (supplemental Figure 6B), indicating that iron merely redistributed between hepatocytes and macrophages but did not change its total tissue contents (Figure 5E). Hepcidin regulates the activity of iron exporter ferroportin to maintain systemic iron homeostasis, in response to iron levels, erythropoiesis, and inflammation.26 Although liver hepcidin mRNA levels (supplemental Figure 6C) did not change, we found that serum hepcidin significantly increased in the Hmox1 KO group and then normalized after macrophage infusion (supplemental Figure 6D). To confirm the results, we checked FPN protein levels in the livers, but we did not observe significant changes (supplemental Figure 6E). Recently, we found that FPN was highly abundant in mature RBCs and its levels also inversely associated with hepcidin expression,27 hence we checked its levels with immunoblots and the results indicated that FPN levels slightly decreased in the Hmox1 KO group, but the differences were not significant (supplemental Figure 6F). We also checked serum interleukin 6 levels and BM erythroferrone mRNA expression (supplemental Figure 6G-H), which mediate the signals of inflammation and erythropoiesis to regulate hepcidin levels, respectively, but the results did not show significant difference either.
Repopulated macrophages can proliferate in the liver
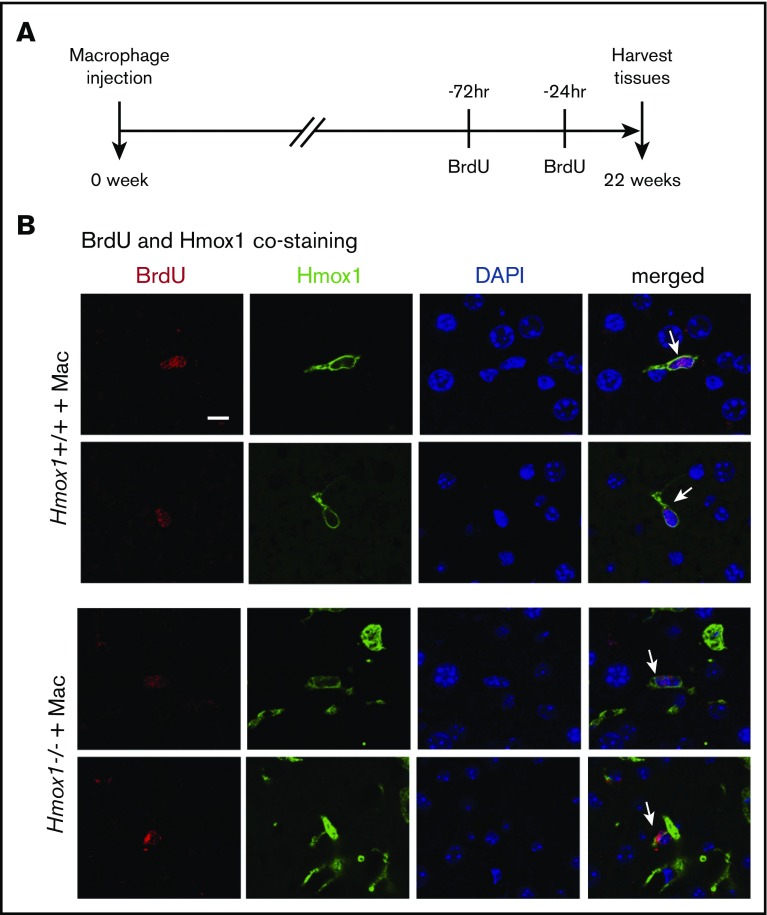
To investigate how long 1 dose of macrophage infusion could prevent disease progression in Hmox1 KO mice and to estimate the percentage of infused WT macrophages in liver cells, we checked the copy numbers of Hmox1 genomic DNA by normalizing to the actin DNA, and the results indicated that WT macrophages accounted for 2% of total liver cells in Hmox1−/− recipients of macrophage infusion (Figure 5H). Most interestingly, the percentage of WT macrophages remained constant for 22 weeks after macrophage infusion, suggesting that these engrafted macrophages probably acquired self-renewal abilities comparable to those of embryo-derived Kupffer cells.16,28 To check whether WT macrophages were self-renewing, we peritoneally injected 2 doses of BrdU (100 mg/kg) to the mice in a 48-hour interval to label all replicating cells during this time window (Figure 6A), and we harvested the tissues and checked for cells that were positive for both BrdU and Hmox1 (Figure 6B). As shown in Figure 6B, in both WT and macrophage-infused Hmox1 KO groups, we found replicating cells that were positive for Hmox1 and BrdU, indicating that engrafted macrophages could replicate as embryo-derived macrophages of WT control mice. The division of these engrafted macrophages allows transfused Hmox1 KO animals to steadily maintain consistent numbers of WT macrophages for prolonged periods of time, to assure red cell quality control and iron recycling despite dysfunctional splenic red pulp.
Figure 6.
Infused macrophages repopulate and proliferate in the liver. (A) Scheme of BrdU injection. Two doses of BrdU (100 mg/kg) were injected intraperitoneally at 72 and 24 hours, respectively, before tissue harvest (22 weeks after macrophage infusion) to label proliferating cells. (B) The immunofluorescence of Hmox1 and BrdU was detected in the livers of WT (top panel) and Hmox1 KO (bottom panel) mice infused with macrophages. DAPI for nucleus was used as the counterstaining. White arrows indicate Kupffer cells that costained with BrdU, Hmox1, and DAPI. Two representative BrdU-labeled macrophages were shown. Scale bar, 10 μm.
Discussion
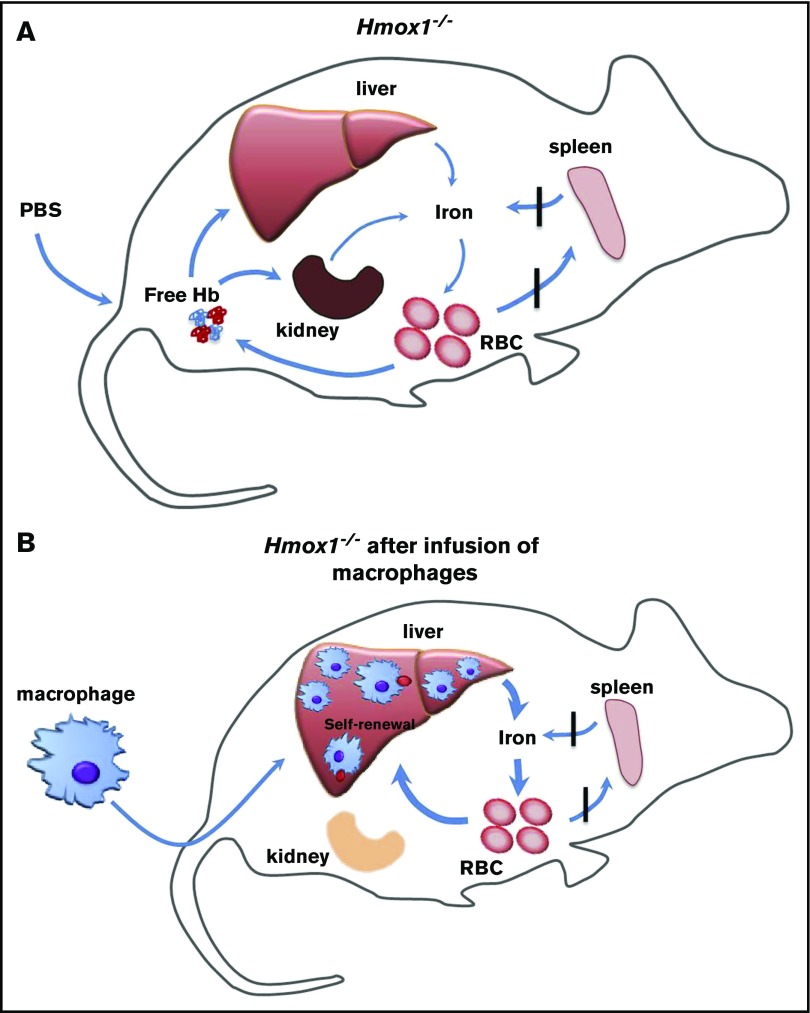
Our findings have shown that infusion of WT macrophages increased serum iron, improved microcytic anemia, eliminated the intracellular hemolysis, rescued the kidney iron overload, and provided long-term protection to Hmox1 KO mice (Figure 7). The infused macrophages engrafted in the liver and self-renewed to maintain high numbers for 22 weeks, the longest time point at which we checked. It is possible that these macrophages could provide lifelong protection comparable to embryo-derived Kupffer cells,16 which warrants further investigation. Under basal conditions, blood monocyte-derived macrophages remain relatively low in the liver, and most resident macrophages are Kupffer cells that initially derived from the embryo, but maintain constant levels through self-renewal. In emergency hemolytic crises, Ly-6cHigh monocytes derived from the BM could phagocytose circulating injured RBCs, engraft in the liver, and differentiate into Kupffer-like cells for several days, after which they are replaced by normal Kupffer cells as the hemolysis resolves.15 Repression of heme recycling by heme oxygenase inhibitor promoted the engraftment of monocytes to the liver, indicating that recruitment of marrow-derived monocytes is an on-demand erythrocyte disposal mechanism. Kupffer cells die in Hmox1 KO mice, autonomously opening the niches and microenvironment in which blood-derived macrophages can reside and proliferate as we showed here (Figures 5 and 6).15 We found few donor macrophages in other tissues than the liver, which is consistent with previous literature,15,16 suggesting that the microenvironment of the liver provides the optimal condition for engraftment of infused macrophages, but the mechanism behind it warrants further investigation.
Figure 7.
Infused WT macrophages reside and proliferate in the liver of Hmox1−/−mice to recycle senescent RBCs and rescue the Hmox1-deficient disease. (A) A model which illustrates that Hmox1−/− mice, which lack erythrophagocytic macrophages, are unable to recycle iron from senescent RBCs that then rupture in the blood vessels, leading to intravascular hemolysis, microcytic anemia, and iron overload in kidneys. (B) Infused WT macrophages engraft and proliferate in the liver, recycle senescent RBCs, restore systemic iron homeostasis, preventing intravascular hemolysis and tissue damage.
Although we have shown previously that BM transplantation could rescue Hmox1 KO mice,10 and thereafter CD34+ HSCs were successfully used to treat a HMOX1 patient,14 macrophage infusion, if proven efficient in patient treatment, may have its advantages comparing to BM transplantation. First, macrophage infusion does not require the myeloablation step and avoids the stresses that the patients have to experience for HSC transplantation. Second, it decreases the risk of graft-versus-host disease, which is a high risk in individuals with mosaic immune system resulted from semiablative BM transplantation. Third, peripheral blood monocytes are likely to be as efficient in repopulating the recipient’s liver as the BMDMs we used in our research, and can be easily isolated from the buffy coat of peripheral blood, therefore eliminating the necessity for invasive procedure of obtaining BM material from the donor.
Our findings also provide a chance to understand the pathophysiology of HMOX1 disease. HMOX1 plays many essential functions besides recycling senescent RBCs. In the BM, the central macrophages of the erythropoietic island provide growth factors and iron, facilitate the differentiation of surrounding erythroblast cells, nursing the erythroid cells to reticulocytes and mature RBCs. These nurse macrophages had been thought to play a role in the anemia of the HMOX1 disease. Macrophage infusion rescued the microcytic anemia without reconstitution of erythropoietic islands, arguing that, although the central macrophages probably provide the optimal niches for RBC production, their absence does not appear to contribute significantly to the pathogenesis of HMOX1 diseases. Our results suggest that anemia of HMOX1 disease mainly stems from the deficiency of iron. We also checked the expression of hepcidin, nonheme iron, and FPN expression in liver and RBCs but did not find statistically significant changes (supplemental Figure 6B-E). Furthermore, we did not find appreciable increases of EPO and erythroferrone, regardless of the anemia of Hmox1 KO mice; their regulations in Hmox1 KO mice warrant further investigation. Our work demonstrates the high potential of macrophage infusion as a therapy for human HMOX1-deficiency diseases. These macrophages engraft in the liver, differentiate into Kupffer cells, and self-renew, potentially protecting the recipient for lifetime. Here, we used BMDMs rather than peripheral monocyte/macrophages derived from buffy coats, but our results suggest that the outcomes will be as good as using monocytes from buffy coats, and matches and rescues will be even more easily achieved in future studies.
Supplementary Material
The full-text version of this article contains a data supplement.
Acknowledgments
The authors thank their colleagues in the Rouault laboratory for insightful discussions, Nunziata Maio (NICHD, NIH) for the Figure 7 illustration, Vincent Schram (NICHD, NIH) for confocal microscope imaging, James Pickel (National Institute of Mental Health, NIH) and Anupam Agarwal (University of Alabama, Birmingham) for the mice, and Jorge Chavez (Office of the Director, Office of Research Services, NIH) for performing serum chemistries.
This work was supported by the NIH, NICHD Intramural Program.
Authorship
Contribution: K.S.K. designed the project, performed most experiments, analyzed the data, and wrote the paper; D.-L.Z. performed experiments and wrote the paper; G. K. and M.C.G. performed experiments and reviewed the paper; H.O. helped with mouse experiments; M.A.E. analyzed data for blood work; and T.A.R. designed and supervised the project and wrote the paper.
Conflict-of-interest disclosure: The authors declare no competing financial interests.
Correspondence: Tracey A. Rouault, Section on Human Iron Metabolism, Metals Biology and Molecular Medicine Group, Eunice Kennedy Shriver National Institute of Child Health and Human Development, National Institutes of Health, Building 35A, Room 2D824, Bethesda, MD 20892; e-mail: rouault@mail.nih.gov.
References
- 1.Anderson GJ, Frazer DM. Current understanding of iron homeostasis. Am J Clin Nutr. 2017;106(suppl 6):1559S-1566S. [DOI] [PMC free article] [PubMed] [Google Scholar]
- 2.MacKenzie EL, Iwasaki K, Tsuji Y. Intracellular iron transport and storage: from molecular mechanisms to health implications. Antioxid Redox Signal. 2008;10(6):997-1030. [DOI] [PMC free article] [PubMed] [Google Scholar]
- 3.Maines MD. The heme oxygenase system: a regulator of second messenger gases. Annu Rev Pharmacol Toxicol. 1997;37(1):517-554. [DOI] [PubMed] [Google Scholar]
- 4.Knutson M, Wessling-Resnick M. Iron metabolism in the reticuloendothelial system. Crit Rev Biochem Mol Biol. 2003;38(1):61-88. [DOI] [PubMed] [Google Scholar]
- 5.Fraser ST, Midwinter RG, Berger BS, Stocker R. Heme oxygenase-1: a critical link between iron metabolism, erythropoiesis, and development. Adv Hematol. 2011;2011:473709. [DOI] [PMC free article] [PubMed] [Google Scholar]
- 6.Kawashima A, Oda Y, Yachie A, Koizumi S, Nakanishi I. Heme oxygenase-1 deficiency: the first autopsy case. Hum Pathol. 2002;33(1):125-130. [DOI] [PubMed] [Google Scholar]
- 7.Yachie A, Niida Y, Wada T, et al. . Oxidative stress causes enhanced endothelial cell injury in human heme oxygenase-1 deficiency. J Clin Invest. 1999;103(1):129-135. [DOI] [PMC free article] [PubMed] [Google Scholar]
- 8.Radhakrishnan N, Yadav SP, Sachdeva A, et al. . Human heme oxygenase-1 deficiency presenting with hemolysis, nephritis, and asplenia. J Pediatr Hematol Oncol. 2011;33(1):74-78. [DOI] [PubMed] [Google Scholar]
- 9.Kovtunovych G, Eckhaus MA, Ghosh MC, Ollivierre-Wilson H, Rouault TA. Dysfunction of the heme recycling system in heme oxygenase 1-deficient mice: effects on macrophage viability and tissue iron distribution. Blood. 2010;116(26):6054-6062. [DOI] [PMC free article] [PubMed] [Google Scholar]
- 10.Kovtunovych G, Ghosh MC, Ollivierre W, et al. . Wild-type macrophages reverse disease in heme oxygenase 1-deficient mice. Blood. 2014;124(9):1522-1530. [DOI] [PMC free article] [PubMed] [Google Scholar]
- 11.Yet SF, Perrella MA, Layne MD, et al. . Hypoxia induces severe right ventricular dilatation and infarction in heme oxygenase-1 null mice. J Clin Invest. 1999;103(8):R23-R29. [DOI] [PMC free article] [PubMed] [Google Scholar]
- 12.Poss KD, Tonegawa S. Heme oxygenase 1 is required for mammalian iron reutilization. Proc Natl Acad Sci USA. 1997;94(20):10919-10924. [DOI] [PMC free article] [PubMed] [Google Scholar]
- 13.Fraser ST, Midwinter RG, Coupland LA, et al. . Heme oxygenase-1 deficiency alters erythroblastic island formation, steady-state erythropoiesis and red blood cell lifespan in mice. Haematologica. 2015;100(5):601-610. [DOI] [PMC free article] [PubMed] [Google Scholar]
- 14.Yadav SP, Thakkar D, Kohli S, Nivargi S, Rastogi N. Human heme-oxygenase-1 deficiency treated successfully by matched sibling donor allogeneic stem cell transplant. Biol Blood Marrow Transplant. 2018;24(suppl 3):S443. [Google Scholar]
- 15.Theurl I, Hilgendorf I, Nairz M, et al. . On-demand erythrocyte disposal and iron recycling requires transient macrophages in the liver. Nat Med. 2016;22(8):945-951. [DOI] [PMC free article] [PubMed] [Google Scholar]
- 16.Scott CL, Zheng F, De Baetselier P, et al. . Bone marrow-derived monocytes give rise to self-renewing and fully differentiated Kupffer cells. Nat Commun. 2016;7:10321. [DOI] [PMC free article] [PubMed] [Google Scholar]
- 17.Owen D, Kühn LC. Noncoding 3′ sequences of the transferrin receptor gene are required for mRNA regulation by iron. EMBO J. 1987;6(5):1287-1293. [DOI] [PMC free article] [PubMed] [Google Scholar]
- 18.Fabriek BO, Dijkstra CD, van den Berg TK. The macrophage scavenger receptor CD163. Immunobiology. 2005;210(2-4):153-160. [DOI] [PubMed] [Google Scholar]
- 19.Tolosano E, Altruda F. Hemopexin: structure, function, and regulation. DNA Cell Biol. 2002;21(4):297-306. [DOI] [PubMed] [Google Scholar]
- 20.Kato GJ, McGowan V, Machado RF, et al. . Lactate dehydrogenase as a biomarker of hemolysis-associated nitric oxide resistance, priapism, leg ulceration, pulmonary hypertension, and death in patients with sickle cell disease. Blood. 2006;107(6):2279-2285. [DOI] [PMC free article] [PubMed] [Google Scholar]
- 21.Murakami J, Shimizu Y. Hepatic manifestations in hematological disorders. Int J Hepatol. 2013;2013:484903. [DOI] [PMC free article] [PubMed] [Google Scholar]
- 22.Gozzelino R, Soares MP. Coupling heme and iron metabolism via ferritin H chain. Antioxid Redox Signal. 2014;20(11):1754-1769. [DOI] [PMC free article] [PubMed] [Google Scholar]
- 23.Bruegge K, Jelkmann W, Metzen E. Hydroxylation of hypoxia-inducible transcription factors and chemical compounds targeting the HIF-alpha hydroxylases. Curr Med Chem. 2007;14(17):1853-1862. [DOI] [PubMed] [Google Scholar]
- 24.Dzierzak E, Philipsen S. Erythropoiesis: development and differentiation. Cold Spring Harb Perspect Med. 2013;3(4):a011601. [DOI] [PMC free article] [PubMed] [Google Scholar]
- 25.Manwani D, Bieker JJ. The erythroblastic island. Curr Top Dev Biol. 2008;82:23-53. [DOI] [PMC free article] [PubMed] [Google Scholar]
- 26.Ganz T, Nemeth E. Hepcidin and iron homeostasis. Biochim Biophys Acta. 2012;1823(9):1434-1443. [DOI] [PMC free article] [PubMed] [Google Scholar]
- 27.Zhang DL, Wu J, Shah BN, et al. . Erythrocytic ferroportin reduces intracellular iron accumulation, hemolysis, and malaria risk. Science. 2018;359(6383):1520-1523. [DOI] [PMC free article] [PubMed] [Google Scholar]
- 28.Nguyen-Lefebvre AT, Horuzsko A. Kupffer cell metabolism and function. J Enzymol Metab. 2015;1(1):101. [PMC free article] [PubMed] [Google Scholar]
Associated Data
This section collects any data citations, data availability statements, or supplementary materials included in this article.


