Abstract.
Near-infrared spectroscopy (NIRS) offers the potential to characterize resting-state functional connectivity (RSFC) in populations that are not easily assessed otherwise, such as young infants. In addition to the advantages of NIRS, one should also consider that the RS-NIRS signal requires specific data preprocessing and analysis. In particular, the RS-NIRS signal shows a colored frequency spectrum, which can be observed as temporal autocorrelation, thereby introducing spurious correlations. To address this issue, prewhitening of the RS-NIRS signal has been recently proposed as a necessary step to remove the signal temporal autocorrelation and therefore reduce false-discovery rates. However, the impact of this step on the analysis of experimental RS-NIRS data has not been thoroughly assessed prior to the present study. Here, the results of a standard preprocessing pipeline in a RS-NIRS dataset acquired in infants are compared with the results after incorporating two different prewhitening algorithms. Our results with a standard preprocessing replicated previous studies. Prewhitening altered RSFC patterns and disrupted the antiphase relationship between oxyhemoglobin and deoxyhemoglobin. We conclude that a better understanding of the effect of prewhitening on RS-NIRS data is still needed before directly considering its incorporation to the standard preprocessing pipeline.
Keywords: functional near-infrared spectroscopy, resting state, statistical analysis, signal autocorrelation, prewhitening
1. Introduction
One way to describe the functional organization of the human brain is to measure resting-state functional connectivity (RSFC) reflecting time synchronized fluctuations in cerebral hemodynamics in the absence of task.1,2 Spatially distant brain regions showing synchronized hemodynamic activity in these slow spontaneous fluctuations constitute distinct functional patterns of brain activity, also referred to as brain networks.3,4 The relationship between spontaneous brain activity and task-related function has been observed with paradigms involving different neuroanatomical systems, demonstrating that areas responsible for similar functions also show a correlated activity at rest5 and that the response in individual functional areas is correspondingly modulated by the activity of functional resting-state networks.6 Moreover, similar patterns of RSFC have been consistently observed across individuals, in both adult7 and infant populations.8,9
RSFC has been mostly investigated with functional magnetic resonance imaging (fMRI) techniques, mainly based not only on the blood oxygenation level dependent (BOLD) contrast but also on measurements of cerebral blood flow with arterial spin labeling,10,11 or cerebral blood volume with vascular space occupancy imaging.12,13 The existence of functional brain networks that coexist during RS has also been revealed in direct measurements of neuronal activity with electro- and magnetoelectroencephalography (EEG and MEG),14,15 suggesting that these signals cannot be attributed only to physiological processes or artifactual components observed in vascular-related functional imaging techniques.
Apart from fMRI and electrophysiological recordings, near-infrared spectroscopy (NIRS) also offers the potential to examine RSFC by measuring concentration changes of oxyhemoglobin () and deoxyhemoglobin (HbR) in the vasculature of the cortical tissue below measurement channels.16,17 NIRS has been effectively employed to characterize RSFC in adults18 and infants,19–21 and to assess differences in RSFC patterns between experimental groups.22 The most common NIRS RSFC analysis involves evaluating the temporal relationship between time series of the preprocessed data per channel, for example, through relatedness measures, such as the Pearson’s correlation. Individual and/or group inferences are made based on comparing the strengths, directions, and the spatial configurations of the obtained correlation values between groups.
In the current paper, we focus on the specific methodological challenges that could arise during the analyses of RS-NIRS data. The hemodynamic changes elicited by neuronal activity recorded in the NIRS signal contains multiple non-neuronal fluctuations, such as instrumental noise and trends, subject-specific components (e.g., motion-related effects), and hemodynamic fluctuations originated in the cerebral and extracerebral compartments. These fluctuations are related to changes in blood pressure (0.1 Hz), respiration (0.3 to 0.6 Hz), and cardiac pulsation (1 to 2 Hz) and are consistently present at specific frequencies and across measurement channels.23 The existence of these non-neuronal components introduces spurious common variance across time series, and therefore could falsely increase FC between signals. Furthermore, changes in and HbR signals are also affected by the filtering effect of the actual hemodynamic response function (HRF) that acts as a low pass filter with cutoff frequency approximately around 0.1 to 0.2 Hz. Consequently, the NIRS signal has a colored spectrum (i.e., it is not a white process with equal energy across all its frequencies), and it exhibits nonzero temporal autocorrelation. This fact is relevant when RSFC is examined based on pairwise correlation measures. As first noted by Granger and Newbold,24 the correlation between two random signals will artificially increase if these signals exhibit nonzero autocorrelation. Therefore, the intrinsic autocorrelation in the NIRS data may artificially inflate correlation values, increase the false-positive rate under the null hypothesis of no correlation between channels, and potentially compromise the validity of data analyses outcomes.25–28
The impact of autocorrelation in the validity of statistical estimation has been widely discussed in the analysis of task-related activity in fMRI data29–31 but only recently in the NIRS literature.25,27,32,33 The most common way to account for signal autocorrelations (also referred to as serial correlations) is to prewhiten the signal so that the residuals of a linear regression model, which describe the hypothesized task-related activity, become uncorrelated (i.e., white).25,29–32 The use of prewhitening in the analysis of RS data is less common and only few studies have suggested prewhitening of the signal itself, either in fMRI data,34,35 or NIRS data.26 By prewhitening RS data, it is expected that the signals become white, exhibiting less temporal autocorrelation, thus reducing false-positive rates. Yet, this approach also presents some caveats. We might assume that the colored frequency spectrum of the RS-NIRS signal is partially originated by physiological noise or induced by the blurring of the hemodynamics, which act as a low pass filter. However, spontaneous neural oscillations as measured with electrophysiological techniques also exhibit a colored frequency profile, typically characterized as a spectrum.36–38 In this scenario, convolving a neural signal with frequency profile with the HRF and adding physiological noise, as is the case in RS-NIRS signals, would still leave a signal that has a profile in the limited band of the HRF. Therefore, it might not be a reasonable null hypothesis to expect RS-NIRS signals to be white, as this would imply that the information related to the HRF has been partially or completely removed, which would complicate the neurophysiological interpretation of the signal that is left after applying prewhitening.
Because prewhitening has been only recently proposed as an important step in the RS-NIRS preprocessing pipeline,26 a careful examination of its effect on the physiological properties of the RS-NIRS signal for FC analyses is necessary. Therefore, the purpose of the current work is to evaluate the effect of prewhitening during the analyses of real RS-NIRS data. For this purpose, we replicated two previous NIRS studies that measured RS activity in infants, by following similar data acquisition, data preprocessing, and analyses procedures.19,21 Also, the results obtained following a standard preprocessing pipeline (as done in the previous studies) are compared with the results after incorporating two common prewhitening approaches in the preprocessing pipeline. The two prewhitening approaches include one based on a nonparametric approach, i.e., assuming no model for the autocorrelation as it is used for fMRI data analyses31 and one based on modeling the signal as a stochastic autoregressive (AR) process.25 By comparing these two algorithms, we also assess whether different prewhitening procedures produce different results. The analyses described above were performed on a data set collected from 4-month-old sleeping infants, obtained in a similar testing procedure to those of Homae et al.19 and to the recent study by Watanabe et al.21 All evaluations were performed for both and HbR.
2. Methods
2.1. Data Acquisition
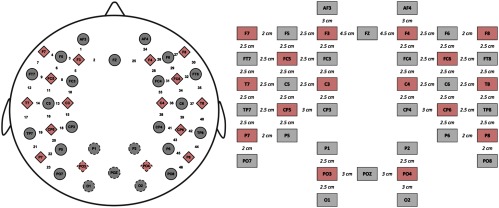
Data from 24 healthy infants were included in this study (age: days, 12 female). Parents were informed about the procedure and then signed a written informed consent before the experiment. This study was approved by the local ethical committee. Spontaneous hemodynamic activity was recorded using NIRS with a NIRScout system (NIRx Medical Technologies, California) at wavelengths 760 and 850 nm. About 16 light emitters and 24 detectors were positioned over frontal, temporal, parietal, and occipital regions of both hemispheres according to the international 10–20 system, using the nasion, inion, and preauricular points as external head landmarks (Fig. 1). Every pair of adjacent light emitters and detectors formed a single measurement channel, which allowed for simultaneous recordings of 52 channels for each hemoglobin oxygenation state at a sampling frequency of 8.93 Hz. A diagram showing the distance between adjacent source–detector pairs used as measurement channels is presented in Fig. 1. The average distance between adjacent source–detector pairs in this study was 2.5 cm. Occipital channels were discarded for all participants for being particularly prone to motion artifacts. Thus, only data from the remaining 14 sources and 19 detectors (46 channels) was considered in the analyses. During data acquisition, participants were in natural sleep on their caregivers’ lap in a sound attenuated room, without another source of illumination than the screen of the recording computer. Parents were asked to remain silent and to minimize movements over the duration of the recordings in order to avoid involuntary cap or optode displacement. Recordings lasted between 11 and 21 min.
Fig. 1.
Diagram of fNIRS optode (sources = red rhombus, detectors = gray circles) and channel (numbers) localization in the cap employed in the current experiment. The right part of the figure shows a diagram with the distances between sources and detectors.
2.2. Experimental Data Preprocessing and Analysis
All data preprocessing and analyses were implemented in MATLAB (R2012b, Mathworks, Massachusetts) using in-house scripts as well as functions available in the Homer2 NIRS package.39
2.3. Data Preprocessing
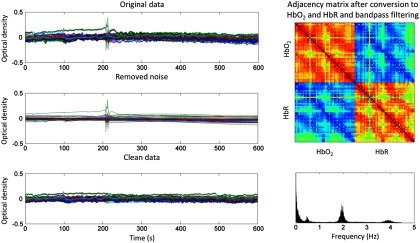
First, light intensity data (raw data) were converted into optical density changes (hmrIntensity2OD in Homer2). Noisy segments typically occurring at the beginning and at the end of each dataset, corresponding to awake activity of the infants (before the infant fell asleep and after the infant woke up), were visually identified and discarded. Although most participants displayed good data quality, some datasets contained motion induced spikes and signal drifts that were corrected using the wavelet-based despiking method described in Patel et al.,40 which was adapted for the NIRS data. This method effectively reduces motion artifacts in the data while keeping time periods free of artifacts unaffected (see Fig. 2).
Fig. 2.
Time-series of a representative example before and after wavelet despike, and removed noise at this step. This wavelet-based method40 is designed to detect and remove transient events caused by outliers in the signal and low-frequency trends. In the top part of the right column of figure, the adjacency matrix of the clean data after conversion to and HbR and bandpass filtering is shown. The plot in the bottom part of the right column shows the power spectrum of the clean data time-series. This figure was created for every participant as part of the data quality assessment routine during preprocessing.
Subsequently, optical density data were converted into and HbR concentration changes (hmrOD2Conc in Homer2), considered as differential path length factors 5.3 (760 nm) and 4.2 (850 nm).41 The signal was bandpass filtered between 0.005 and 1 Hz to remove the contribution of very slow frequency fluctuations, as well as high frequency components (e.g., cardiac pulsation).19 After this step, all datasets were limited to (i.e., 5100 samples) to ensure a homogenous contribution across participants to the statistical analyses. This step was performed by visually inspecting the data in order to select the segment displaying the best data quality. The first 150 samples and the last 5 samples were also removed to avoid the beginning and end effects originated by the prewhitening methods. Thus, the final duration of the time series was (i.e., 4945 samples).
2.4. Prewhitening Methods to Remove Temporal Autocorrelation
Let us consider that the time series of a specific channel follows a normal distribution with zero mean and covariance (i.e., ), where is the covariance matrix of describing the temporal correlation between all the time points. The aim of prewhitening is to find a matrix that filters such that and enforces that . In this work, two prewhitening procedures were implemented: a nonparametric approach based on the estimates of the autocorrelation coefficients of the data and a parametric approach based on an AR model of the data. The two prewhitening methods described below were applied at each individual channel, for and HbR (46 channels × 2 hemoglobin parameters) and for every infant.
2.4.1. Nonparametric approach
In the nonparametric prewhitening approach, the matrix is defined based on the raw autocorrelation coefficients of the signal . First, the raw autocorrelation coefficients of are estimated (xcorr function in MATLAB) and used to define the sample covariance matrix , which is a symmetric Toeplitz matrix. Then, the Cholesky decomposition of is computed such that . By defining , it can be shown that the prewhitened signal follows .
2.4.2. AR fitting approach
Instead of defining the prewhitening in terms of the raw autocorrelation coefficients of the signal, we can alternatively attempt to model the correlation in terms of an AR process. This model assumes that the data at a specific time point, i.e., , can be modeled based on the data from previous sample points and a white random component , which is usually referred to as the innovation term of the signal. Mathematically, an AR model of order of the signal can be defined as , where the coefficients , are the AR coefficients of the model. In this work, the AR coefficients were estimated following the forward–backward least-squares approach described in Barker et al.,25 which is available in Homer2. AR coefficients are calculated for several model orders to find the order that minimizes a previously defined information criterion [e.g., Bayesian information criterion (BIC)]. In our study, we computed the AR coefficients up to an order of 150 coefficients and chose the model order that minimizes the BIC in this range. We observed that the optimal model order varied across channels and datasets with a range between 60 and 110. Subsequently, the channel time series is filtered with the linear filter defined with the AR coefficients of the selected model order, which results in the corresponding estimate of the innovation signal that is used for subsequent analyses.
2.5. Functional Connectivity Analysis
FC analysis methods described in the following section were equivalently applied to data that were preprocessed without prewhitening, as well as to data prewhitened with the AR procedure or the nonparametric procedure, and for both and HbR. As a measure of the FC between channels, pairwise Pearson’s correlation coefficients were computed between the time courses of the , as well as HbR signals, of each channel pair for each subject. These correlation coefficients can be represented as a FC matrix, where the element of the matrix reflects the Pearson’s correlation coefficient between channels and . Individual FC matrices were converted from values to values by Fisher’s -to- transform and averaged across subjects () to obtain group -FC and HbR-FC matrices. Average FC matrices were converted back to values for figure presentation.
A hierarchical clustering approach was also performed at the group level.19 First, and HbR time series of each participant were standardized and concatenated in time resulting in two datasets with 46 channels × (4945 samples × 24 participants). Next, agglomerative hierarchical clustering was carried out (linkage function in MATLAB) using the correlation distance and the Ward method to group channels and clusters based on their degree of similarity. The dendrogram plot of the hierarchical cluster tree was generated for two thresholds representing different levels of similarity. In order to display the same number of clusters (i.e., three or six clusters), different thresholds were considered across methods and conditions.
2.6. Phase Difference Analysis
For each subject dataset, the average phase difference between and HbR signals was calculated on each individual channel to obtain the hemoglobin phase of oxygenation and deoxygenation (hPod).21 Briefly, Hilbert transformation was applied to and HbR signals to calculate their corresponding instantaneous phase signals. These signals were then subtracted to obtain a phase difference signal between and HbR. Next, the temporal average of the phase difference signal was computed for each and HbR channel pair, resulting in a phase difference value (hPod) per channel. Standard and polar histograms were computed for each subject as well as for the entire group, where each subject contributed 46 values (i.e., number of channels). Statistical differences in average hPod values between the methods were investigated by using a Watson–Williams test.42 The same test was also employed in the posthoc pairwise comparisons.
2.7. Simulations
Two sets of simulations were performed to further investigate the effect of prewhitening in signals exhibiting temporal autocorrelation and to facilitate the interpretation of the results with real RS-NIRS data.
2.7.1. False-positive rate in randomly generated time series
To investigate the effect of prewhitening on the Pearson correlation coefficients, two sets of randomly generated time-series of length of 5000 sample points were simulated following a similar procedure, as described in Santosa et al.26 One set of simulated time-series was generated by filtering two random normally distributed signals with a shape filter, in order to make these signals match the frequency spectrum of spontaneous neural oscillations. The second set of simulations was generated with a white frequency spectrum. In addition, two different conditions of correlation were assessed for each set: with no correlation (i.e., the distribution of the correlation coefficients is expected to be centered in zero) and with an induced correlation of , which was generated by multiplying the time-series with an upper triangular matrix obtained by the Cholesky decomposition of the desired correlation matrix (i.e., [1 0.5; 0.5 1]).
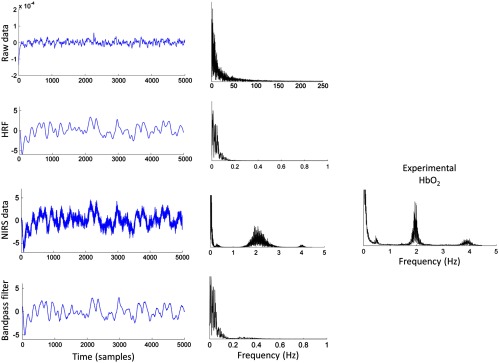
The following processing steps were independently applied in each of the four simulated datasets. First, signals were convolved with an HRF generated using a gamma function with parameters and . Then, each signal was added terms simulating physiological noise (i.e., cardiac pulse and respiration) that were generated as narrow-band filtered noise (0.25 to 0.35 Hz for respiration, 1.95 to 2.05 Hz and 3.95 to 4.05 Hz for cardiac pulse), as well as a white noise component that simulated hardware-related random noise. The amplitude of these components relative to the HRF signals was 1/2 for the cardiac pulse, 1/20 for the respiration, and 1/10,000 for the hardware-related random noise, which yielded signals with similar power spectra to our experimental data (see Fig. 3). Following the same preprocessing pipeline as for the experimental data, signals were bandpass filtered between 0.005 and 1 Hz. Finally, prewhitening was applied independently to each signal by the two procedures described above (i.e., nonparametric approach and AR fitting approach). In each repetition (), Pearson’s correlation for each pair of simulated signals was computed after every preprocessing step to evaluate the effect of each of these steps in the distribution of correlation coefficients.
Fig. 3.
Example of a simulated signal and its power spectrum at each processing step, and power spectrum of for a representative example of our experimental data.
2.7.2. Effect of prewhitening on simulated RSFC patterns
To further investigate the effect of prewhitening on the analysis of RSFC, 20 datasets with “RSFC patterns” similar to those observed in real experimental data were simulated following the same procedure described above. Each dataset included 40 time-series of 5000 sample points, thus each of these datasets simulated RS data of a participant acquired in a similar testing procedure as our experimental data. The original time-series were random uncorrelated signals with a frequency spectrum, which could be regarded as signals reflecting spontaneous neural processes. Different levels of correlation between these simulated “channels” were induced, producing adjacency matrices showing specific and known correlation patterns. The same correlation structure was imposed in the 20 simulated “participants.” The correlation structure was induced to approximately match the shape of the adjacency matrices observed in our experimental RS-NIRS data. A correlation of was induced between neighboring channels, whereas a correlation of was induced between homotopic channels. Correlations of or were simulated between the remaining pairs of channels. Similarly, these signals were convolved with the HRF, corrupted with physiological noise to create simulated NIRS datasets and then bandpass filtered. The two prewhitening procedures were then applied to these datasets. Changes in the spatial patterns of correlation were investigated by looking at the group level adjacency matrices of the simulated NIRS data, after bandpass filtering and after prewhitening. The same hierarchical clustering approach as described above was also performed, to investigate whether the induced spatial clustering structure was preserved after the different processing steps.
3. Results
3.1. Functional Connectivity Analyses
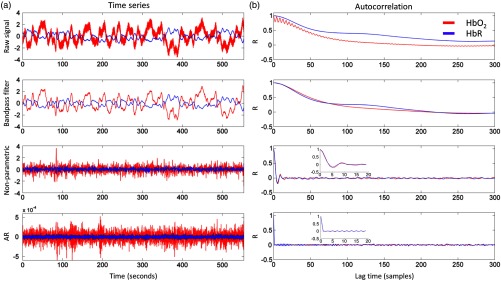
Figure 4 illustrates the effect of the different preprocessing steps and prewhitening methods on the and HbR signals [Fig. 4(a)] and the corresponding initial 300 autocorrelation coefficients [Fig. 4(b)] for a single channel of an exemplar subject. Without bandpass filtering, the HbR signal shows a high autocorrelation value even after 300 time lags (), whereas the autocorrelation coefficients of the signal become approximately zero after time lags (). After band-pass filtering (0.005 to 1 Hz), the and HbR signals show similar autocorrelation that decreases to zero after time lags. As shown in the bottom plots of Fig. 4, both nonparametric and AR prewhitening procedures reduce the autocorrelation of the data, even though the autocorrelation coefficients shrink to values closer to zero at shorter lags using the AR approach than the nonparametric approach.
Fig. 4.
(a) The times-series of a single channel for (red) and HbR (blue) at different steps of the preprocessing. (b) The first 300 autocorrelation coefficients.
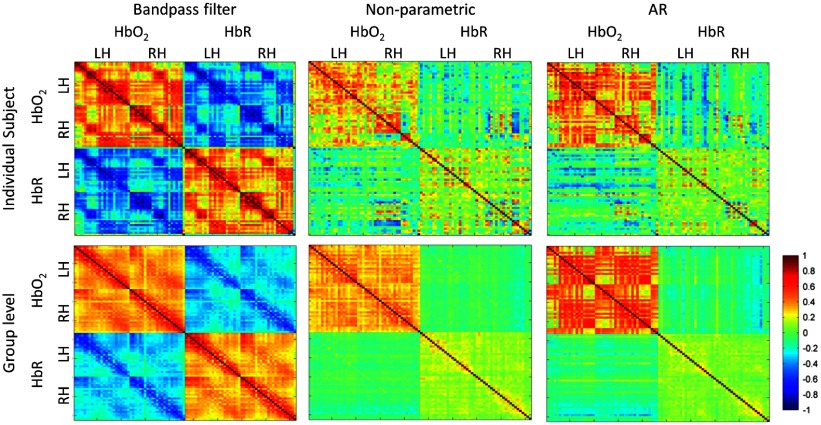
Figure 5 shows the FC matrices for the three preprocessing approaches for an individual subject (first row) and at the group level (second row). It is generally assumed that and HbR signals in NIRS data should exhibit negative correlation.21,43 This assumption is fulfilled both at the individual and at the group level when data has only been preprocessed with band-pass filtering. Moreover, homologous regions of both hemispheres show high correlation values in and HbR, forming clusters and a clear spatial distribution around the main diagonals. In contrast, incorporating any of the two prewhitening procedures as part of the preprocessing makes the negative correlation between and HbR disappear, and the correlation between homologous regions is only evident in , with a different spatial distribution in each of the methods.
Fig. 5.
FC matrices for an individual subject (first row) and at the group level (second row) for the three types of preprocessing. In each plot, the FC matrix for and HbR is shown in the top-left part and bottom-right part, respectively (RH: channels in right hemisphere, LH: channels in left hemisphere). The FC matrix representing the correlation between and HbR is shown in the top-right. Note that the plots are symmetric with respect to the main diagonal.
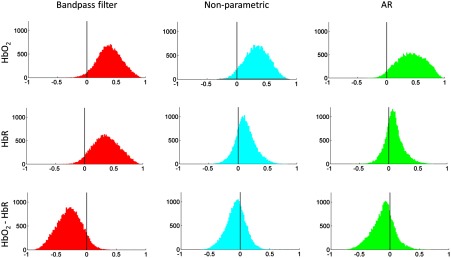
We further investigated changes in correlation values due to the effect of prewhitening across , HbR, and between and HbR (Fig. 6). For that, correlation coefficients were transformed to scores by Fischer’s z transformation. For each condition (i.e., , HbR, and ), the individual scores were evaluated as random effects and ANOVA was performed with preprocessing method as a factor (3 groups of 24 infants in total). Posthoc pairwise multiple comparison tests were performed following the Tukey’s honestly significant difference criterion (Table 1). For , we observed a significant difference between the three methods (, ). Multiple comparison test showed that correlation values in for the AR method were larger than those of the nonparametric approach (). For HbR, we also found a significant difference between the methods (, ). Posthoc tests revealed that scores were larger for the bandpass filter method than those of the nonparametric approach () and the AR approach (). For the condition, a significant difference between the methods was also observed (, ). Pairwise posthoc tests demonstrated that scores in the bandpass filter condition were smaller (i.e., larger negative correlation values) than those of the nonparametric approach () and those of the AR approach ().
Fig. 6.
Histograms of the group level correlation values for the different preprocessing methods. Each column shows the comparison between preprocessing methods for the different conditions (i.e., , HbR, and ). Each infant contributed with correlation values (upper triangular connectivity matrix) to each histogram.
Table 1.
Mean score differences between preprocessing methods and 95% confidence interval.
| Method | Mean difference | 95% Confidence interval |
|---|---|---|
| Bandpass filter—nonparametric | 0.0662 | to 0.1397 |
| Bandpass filter—AR | to 0.0123 | |
| Nonparametric—AR | to | |
| HbR | ||
| Bandpass filter—nonparametric | 0.2904 | 0.2403 to 0.3405 |
| Bandpass filter—AR | 0.3254 | 0.2754 to 0.3755 |
| Nonparametric—AR | 0.0350 | to 0.0851 |
| Bandpass filter—nonparametric | to | |
| Bandpass filter—AR | to | |
| Nonparametric—AR | 0.0448 | to 0.0912 |
3.2. Hierarchical Clustering Analysis
The results of the hierarchical clustering analysis of the standard preprocessing were consistent with the results previously reported in Homae et al.19 A large degree of reproducibility is observed despite differences in data acquisition between studies (46 channels as opposed to 94 channels) and recording duration for each infant (9 min instead of 3 min). Also, we assessed 4-month-old infants, which correspond to an intermediate age between the infants at 3 and 6 months of age tested in the previous study.19
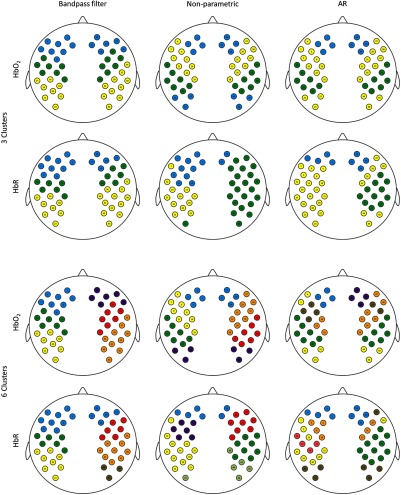
As it can be seen in Fig. 7 for , if only band-pass filtering is applied, clusters are formed between homologous regions of both hemispheres, which split into individual frontal, temporal, and parietal regions on each hemisphere at a lower threshold (i.e., larger degree of similarity). With the nonparametric and AR prewhitening, the clustering between homologous regions is preserved, but each method shows a different spatial pattern. With the nonparametric approach, the most posterior parietal channels in both hemispheres are clustered along with the most frontal channels. The AR prewhitening approach shows a similar distribution to the nonparametric approach, except the anterior–posterior cluster is formed between channels located in the frontotemporal region and the posterior parietal region. For the lower threshold, AR prewhitening results into a larger number of interhemispheric clusters than the nonparametric approach, being the clustering in the later condition more similar to that obtained with band-pass filtering.
Fig. 7.
Hierarchical clustering analysis for and HbR data. Top two rows show results for the higher threshold corresponding to three clusters. The two rows at the bottom of the figure show results for the lower threshold corresponding to six clusters.
As for HbR data, the spatial distribution of clusters with only band-pass filtering at the higher clustering threshold (i.e., few clusters) is comparable to that obtained in and to results presented in a similar study by Homae et al.44 The results at the lower clustering threshold (i.e., more clusters) and with the two prewhitening procedures show a less bilateral spatial distribution, which is restricted to a few channels. A frontal cluster involving both hemispheres is formed in the three approaches, regardless of the thresholds, but the main temporal/parietal clusters appear separated across hemispheres.
3.3. Phase Difference Analysis
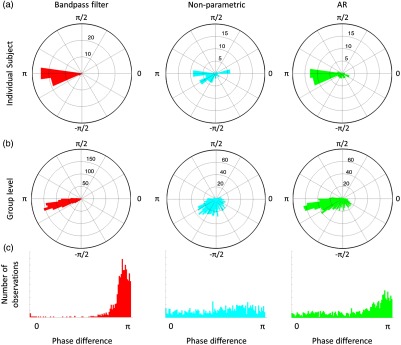
Figure 8 shows the effect of prewhitening in hPod values across channels for a representative subject [Fig. 8(a)] as well as at the group level [Figs. 8(b) and 8(c)]. After band-pass filtering, we observed a pattern of hPod values that follows previous observations for a group of participants with a similar age range as our data.21 In both plots of the standard and polar histograms with only band-pass filtering, it can be seen that most hPod values are close to rad (i.e., 180 deg), which corresponds to an antiphasic pattern between both and HbR signals. However, prewhitening disrupts this pattern. The overall distribution of hPod values after prewhitening becomes more widespread, although the distribution for prewhitening with the AR approach shows a mode closer to (i.e., antiphase) than the nonparametric approach. By using a Watson–Williams test, we observed a statistically significant difference in average hPod values between the methods (, ). Posthoc pairwise comparison tests between the methods revealed that mean hPod values in the bandpass filter method were larger than those of the nonparametric approach () and the AR approach (). Significant differences were also observed between the two prewhitening methods, the AR approach showing larger hPod values than the nonparametric approach (; Tables 2 and 3). Note that values range between 0 and , so higher values correspond to values that are closer to .
Fig. 8.
Polar histogram showing phase difference (hPod) values (a) for an individual subject and (b and c) at the group level for the three types of preprocessing. Histograms in the panel (c) show absolute hPod values.
Table 2.
Group average hPod values and standard deviation for each preprocessing method.
| Method | hPod | Standard deviation |
|---|---|---|
| Bandpass filter | 0.36 | |
| Nonparametric | 0.91 | |
| AR | 0.88 |
Table 3.
Pairwise comparisons on mean hPod difference values between preprocessing methods.
| Method | value | |
|---|---|---|
| Bandpass filter—nonparametric | 144.840 | |
| Bandpass filter—AR | 64.6894 | |
| Nonparametric—AR | 14.1282 | 0.0004 |
3.4. Simulations
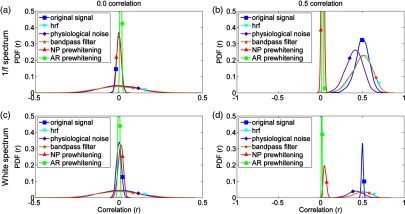
Figure 9 depicts the histograms of Pearson correlation coefficients after each processing step for each simulated dataset, where the signals with spectrum and white spectrum are shown on the top and the bottom, respectively. For the two sets of simulated data without correlation (), the distribution of coefficients becomes wider after convolution with the HRF and bandpass filtering, suggesting that both steps artificially increased correlation values and consequently increased false-positive rates. After prewhitening, correlation coefficients become centered in zero again, following a similar distribution as the original signal with the nonparametric approach, whereas the distribution is narrower with the AR approach. For induced correlation , the distribution of correlation coefficients is wider for the signals with a power spectrum than for the white signals due to their autocorrelation. Similar to the scenarios with , convolving with the HRF widens the distribution of correlations, and bandpass filtering reduces the confounding effects due to physiological noise. Decisively, both prewhitening approaches substantially reduced the correlation between the time-series towards zero. The nonparametric prewhitening resulted in distributions centered in zero for datasets with spectrum in the two correlation conditions. Similar results were obtained for the dataset with white spectrum and . The dataset with a white spectrum and showed a distribution slightly shifted toward positive correlation values. The AR approach showed a similar distribution, with a narrow shape and centered above zero, across datasets and conditions.
Fig. 9.
Distribution of the measured Pearson correlation coefficients for two sets of simulated time-series under different levels of correlation. The distribution of correlation coefficients is plotted for each processing step. (a) Uncorrelated signals with power spectrum. (b) Signals with power spectrum and an induced correlation of . (c) Uncorrelated signals with a white power spectrum. (d) Signals with a white power spectrum and an induced correlation of .
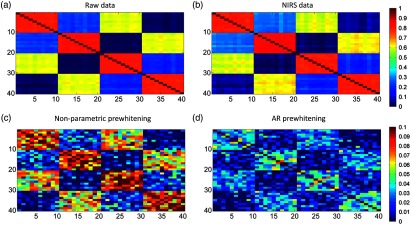
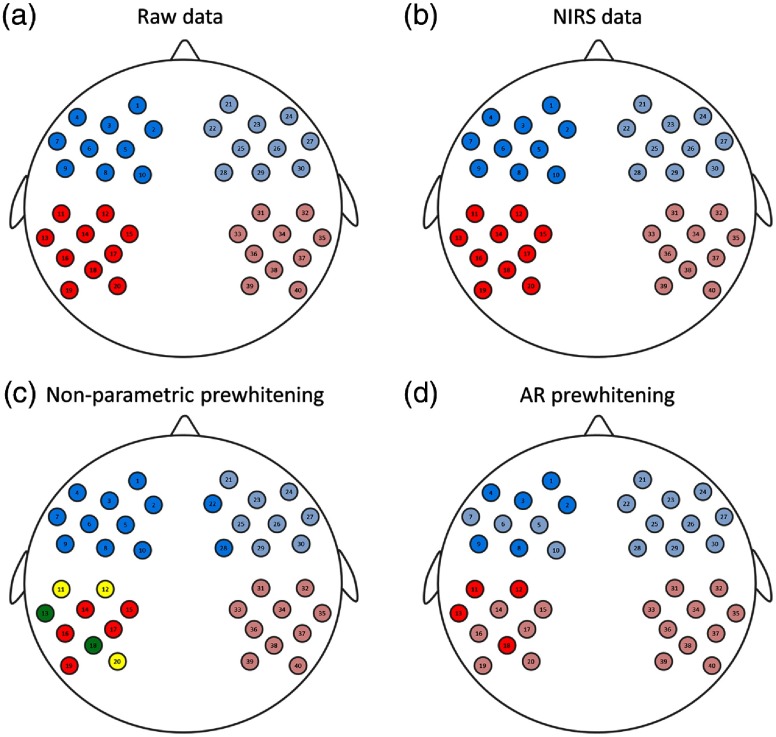
Figure 10 shows the group level adjacency matrices for the four conditions assessed in the second set of simulations. Adjacency matrices for the simulated neural data and for the NIRS data show the expected induced correlation patterns. By contrast, the two prewhitening procedures reduce the correlation between channels toward values close to zero, in agreement with the results shown in Fig. 9. Prewhitening also alters the spatial configuration of the adjacency matrices, although part of the induced correlation structure is preserved (note differences on the scale of the plots). Figure 11 illustrates that the hierarchical clustering analysis for the simulated neural data and for the NIRS data shows the expected spatial clustering configuration with the “anterior” and “posterior” channels clustering together and splitting by “hemisphere” when the threshold is set to display larger degrees of similarity (i.e., dark and light for blue and red colors). After prewhitening, the “anterior” and “posterior” clusters are preserved at the higher threshold, but the clustering configuration is disrupted when clusters between more similar channels are displayed. With nonparametric prewhitening, the spatial configuration changes and clusters that do not belong to the original structure are formed. The AR prewhitening approach also results in diffferent clusters from those of the original configuration.
Fig. 10.
Group level adjacency matrices from simulated data showing specific RSFC patterns resembling real data. (a and b) The results for the simulated neural and the simulated NIRS data. (c and d) The adjacency matrices for the two prewhitening procedures. Note that the scale in each row is different.
Fig. 11.
Results of the hierarchical clustering analysis corresponding to simulated “participants.” (a and b) The results for the simulated neural and NIRS data. (c and d) The results after applying each prewhitening procedure. Each color represents channels that are grouped together forming clusters based on similarity. For the blue and red clusters, dark and light colors indicate that these channels belong to the same cluster if a higher threshold is considered, but split into two clusters at lower thresholds (i.e., larger degree of similarity).
4. Discussion
It has been previously described that the validity of the standard NIRS RSFC data analysis approach is compromised by the presence of physiological and artifactual fluctuations that increase the level of autocorrelation in the data as well as introduce shared variance across different channels, leading to uncontrolled false-positive rates.26 One of the main causes of this issue is the presence of autocorrelation in the RS-NIRS data due to the slow nature of hemodynamic fluctuations in the extracerebral and cerebral compartments.27 To overcome this problem, it has been proposed that autocorrelation should be removed from the data before performing RSFC analyses via prewhitening procedures.26,34,35
Here, using real RS-NIRS data obtained from infants, we assessed the effects of different prewhitening methods, in comparison to a standard analysis method (e.g., one excluding prewhitening). The rationale presented in Santosa et al.26 to recommend the use of prewhitening in RS-NIRS data, which has also been proposed for RS-fMRI studies, 28,34 is based on the fact that temporal autocorrelation inflates relatedness measures, such as Pearson’s correlation. In their work, Santosa et al.26 convolved two random uncorrelated signals with a canonical HRF and added physiological noise (i.e., cardiac pulse and respiration) to make these signals show the properties of real RS-NIRS signals. They demonstrated that this step make signals self-correlated, increasing the correlation between them and producing false-positive rates around 80%. In their work, prewhitening indeed removed temporal autocorrelations, and false-positive rates returned to the expected true value of 5%. Nevertheless, it is also true that real hemodynamic signals are not expected to show a white frequency spectrum. Therefore, prewhitening the NIRS signal and consequently altering the expected power law behavior of RS-NIRS data in the frequency band of the HRF may compromise the interpretation of RSFC results (and its link with previous literature assessing RSFC), as the prewhitened signals will no longer hold the specific properties of spontaneous hemodynamic fluctuations as measured with fMRI and fNIRS (i.e., BOLD or and HbR).
In the current work, we specifically evaluated the effect of the following three preprocessing methods in experimental RS-NIRS data obtained from 4-month-old infants: (1) the “standard” band-pass filtering approach, (2) prewhitening based on a nonparametric algorithm, and (3) prewhitening based on an AR fitting approach 25. We also compared our results to previous studies assessing RS activity in infants using NIRS.19,21 We note that our two prewhitening procedures succeeded in reducing the autocorrelation of the signal. AR prewhitening was implemented following Barker et al.32 and Santosa et al.26 The range of the optimal AR model in our study, which varied from up to at a sampling rate of 8.93 Hz (i.e., a range from 6.7 to 12.3 s) is similar to those observed in Santosa et al.,26 which reported model orders up to at a sampling rate of 4 Hz (i.e., also ). Apart from the sampling rate, the order of the optimal AR model also depends on signal quality and varies across measurement channels.
Our study yielded three relevant findings. First, we were able to replicate the results of two previous infant RS-NIRS studies 19,21 when using the traditional preprocessing pipeline including band-pass filtering but not prewhitening. Second, results after data prewhitening were different from those presented in the original studies. Third, the two different prewhitening methods produced different results. Considering the hierarchical clustering analysis of the signal for both prewhitening methods (Fig. 7), a cluster comprising channels located in frontal and posterior parietal regions emerged that is neither observed in the results without prewhitening nor in the original results.19 Most networks/clusters reported in the infant RS literature8,19,44–46 are formed between bilateral regions (i.e., frontal, temporal, or visual), but there are also reports of a developing frontoparietal network,47 which has been consistently reported in studies with adults. This frontoparietal network disappears when the threshold is defined to reveal clusters showing larger similarity (i.e., a larger number of clusters). Spatial clustering for HbR occurs between channels proximate to each other and less interhemispheric clustering is observed, with similar results across the two prewhitening methods. Our results differ from the results shown in Homae et al.44 for HbR, which were characterized by interhemispheric clustering with almost identical distribution as . To our knowledge, Homae et al.44 is the only study that reported HbR with RS-NIRS infant data to date.
Perhaps, one of the most relevant observations of our analyses is that the negative correlation and antiphase state between and HbR signals was no longer visible after prewhitening (Figs. 5, 6, and 8), although there is a slight tendency toward an antiphase relationship with the AR approach. These results contradict previous observations of the intrinsic physiological relationship between and HbR in the NIRS signal, 16,21,43,48 which we believe is an important discussion point. The signal autocorrelation originates from all its sources, including not only artifactual and non-neurobiological physiological confounds but also “brain-related” hemodynamic activity, as the HRF acts as a low-pass filter.26 Therefore, removing autocorrelation might imply that the HRF of interest is also partially or completely removed, and this might cause the expected negative correlation between and HbR signals to disappear. This opens a question on the neurobiological significance of the remaining signal (i.e., the link between neural processes and the prewhitened signal) and raises concerns about the effects of using prewhitening in RS-NIRS studies. We could assume that signals after prewhitening (i.e., innovations) do not represent and HbR fluctuations, but they reflect the activity-inducing signals underlying them. From that perspective, prewhitening could be understood as a hemodynamic deconvolution procedure, as it has been proposed for fMRI data analysis.49–51 However, this is not the primary goal of prewhitening as it is understood in this work (i.e., removing the signal autocorrelation). In our opinion, and on the light of these results, further investigation on the neurobiological relevance of the prewhitened signal in RS-NIRS data is still required before directly adopting this procedure.
For both prewhitening approaches, we observed a significant reduction in the correlation values obtained in the adjacency matrices of HbR signals but not in those of signals (Figs. 5 and 6). We note that motion induced artifacts, although sparse, might still be present in our experimental RS-NIRS data, and potentially modulate the correlation between channels. However, we visually inspected prewhitened data and observed that time-points presumably showing motion related artifacts co-occurred across and HbR. Therefore, the differences on distribution of correlation values after prewhitening observed across and HbR cannot be attributed to data showing different motion-related effects across components. Alternatively, we infer that these results could be explained by the fact that is more sensitive to physiological fluctuations than HbR, and thus be more prone to nonstationary low-frequency physiological fluctuations related to modulations in cardiac rate,52 breathing,53 and systemic blood pressure.54,55 These processes are difficult to be explained by means of stationary models of correlations but could modulate time–frequency dynamics of hemodynamic fluctuations during resting-state, and account for a substantial part of the correlation between the channels in our experimental data after prewhitening.
Finally, our simulations demonstrated that convolving two uncorrelated time series with the HRF artificially increases the correlation between them, resulting in larger false-positive rates. These results were already noted by Santosa et al.26 in similar simulations, and they are also in line with those reported in Bright et al.28 for simulations with fMRI-like data. Figure 2 in Bright et al.28 illustrated that the false-positive rate increases due to the effect of bandpass filtering, specifically that narrower bandpass filters and faster sampling rates show the highest false-positive rates. Thus, the effect of bandpass filtering the data can be considered equivalent to convolution with the HRF. In all the conditions (i.e., and ), AR prewhitening removed correlation between the signals and centered the distribution of the measured correlation values in zero. Nonparametric prewhitening also removed the correlation and centered the correlation values in zero, except for the signals with a white spectrum and , where the distribution of correlation coefficients was slightly shifted toward positive values.
In the second set of simulations, where changes in spatial correlation patterns resembling RSFC were investigated, we observed similar correlation patterns between the “original data” (i.e., simulated neural activity where the correlation structure was induced) and the simulated “NIRS data.” After prewhitening, and with the two approaches, correlation between channels was reduced to levels close to zero, and the shape of the adjacency matrices disrupted, although part of the original correlation structure is still preserved. It is important to note that in our simulations, all the “participants” showed the same original correlation structure, which we consider a very unlikely scenario in the case of real RS-NIRS data. We expect that, when experimental data are considered, RSFC results of the measured RS-NIRS data will considerably differ from results after applying prewhitening.
5. Conclusion
This work investigated the implications of including prewhitening as part of the RS-NIRS data preprocessing pipeline. More specifically, the effect of prewhitening was assessed by replicating the results of two previous RS-NIRS studies and comparing the outcome of the standard preprocessing pipeline with the outcome after incorporating prewhitening. Results from previous studies were replicated with the standard preprocessing pipeline but not with ones that included prewhitening. Importantly, the expected anticorrelation and antiphase state between and HbR disappeared after prewhitening. Also, different prewhitening procedures yielded different results, both compared to the standard RS-NIRS preprocessing method and across prewhitening procedures.
These results open a discussion about which method would be more appropriate for those NIRS users who are interested in adding prewhitening to their preprocessing pipeline. Undoubtedly, the statistical challenges that have been recently described for both functional task based and connectivity NIRS data should be taken into consideration when analyzing NIRS data.26,27 However, based on our results, we conclude that a better understanding of the effect of prewhitening in RS-NIRS data, and of the neurophysiological significance of the prewhitened signal, is still required to determine if prewhitening should be applied and, if so, which prewhitening procedure is more appropriate. Other relevant preprocessing methods might also be incorporated in the analysis of RS-NIRS data, such as global signal regression to attenuate the contribution of physiological confounds18,23,56 or robust regression analysis to account for the presence of outliers due to motion artifacts in the data.26,27 A full evaluation of the combined effect of these methods was beyond the scope of this paper, but we acknowledge the importance of including all these different methods in a potential discussion on standardized data preprocessing procedures for future RS-NIRS studies.
Acknowledgments
Authors thank Dr. Robert J. Cooper for insightful comments on an earlier version of this manuscript. We thank Elena Aguirrebengoa for her assistance on recruiting and testing participants. We also thank all the parents and infants, who generously participate in our studies. This research was possible due to the support of the Basque Government predoctoral grant PRE_2016_2_0188 to Borja Blanco, as well as the support of the Spanish Ministry of Economy and Competitiveness through the project PSI 2014-54512-P, Juan de la Cierva Fellowship (IJCI-2014-20821) and the “Severo Ochoa” Programme for Centres/Units of Excellence in R & D (SEV-2015-490).
Biographies
Borja Blanco is a PhD student in cognitive neuroscience at the Basque Center on Cognition, Brain and Language. His research interests mainly concern signal processing and analysis methods for neuroimaging techniques employed in infant research (fNIRS & EEG). In particular, he is interested in investigating resting-state activity and language processing in infant populations in the context of bilingualism.
Monika Molnar is an assistant professor at the Department of Speech-Language Pathology of the University of Toronto. Her research focuses on the behavioral, physiological, and neural correlates of spoken language processing in infants and children growing up in monolingual and bilingual environments.
César Caballero-Gaudes is an MRI engineer at the Basque Center of Cognition, Brain and Language. His research focuses on signal processing and data analysis methods for neuroimaging, mainly fMRI and fNIRS, and their application in cognitive and clinical neuroscience.
Disclosures
The authors declare that this research was conducted in the absence of any commercial or financial relationships that could represent a potential conflict of interest. This research was approved by the local ethical committee.
References
- 1.Biswal B., et al. , “Functional connectivity in the motor cortex of resting human brain using echo-planar MRI,” Magn. Reson. Med. 34(4), 537–541 (1995). 10.1002/(ISSN)1522-2594 [DOI] [PubMed] [Google Scholar]
- 2.Fox M. D., Raichle M. E., “Spontaneous fluctuations in brain activity observed with functional magnetic resonance imaging,” Nat. Rev. Neurosci. 8(9), 700–711 (2007). 10.1038/nrn2201 [DOI] [PubMed] [Google Scholar]
- 3.De Luca M., et al. , “fMRI resting state networks define distinct modes of long-distance interactions in the human brain,” Neuroimage 29(4), 1359–1367 (2006). 10.1016/j.neuroimage.2005.08.035 [DOI] [PubMed] [Google Scholar]
- 4.van den Heuvel M. P., Hulshoff Pol H. E., “Exploring the brain network: a review on resting-state fMRI functional connectivity,” Eur. Neuropsychopharmacol. 20(8), 519–534 (2010). 10.1016/j.euroneuro.2010.03.008 [DOI] [PubMed] [Google Scholar]
- 5.Smith S. M., et al. , “Correspondence of the brain’s functional architecture during activation and rest,” Proc. Natl. Acad. Sci. U. S. A. 106(31), 13040–13045 (2009). 10.1073/pnas.0905267106 [DOI] [PMC free article] [PubMed] [Google Scholar]
- 6.Fox M. D., et al. , “Intrinsic fluctuations within cortical systems account for intertrial variability in human behavior,” Neuron 56(1), 171–184 (2007). 10.1016/j.neuron.2007.08.023 [DOI] [PubMed] [Google Scholar]
- 7.Damoiseaux J. S., et al. , “Consistent resting-state networks across healthy subjects,” Proc. Natl. Acad. Sci. U. S. A. 103(37), 13848–13853 (2006). 10.1073/pnas.0601417103 [DOI] [PMC free article] [PubMed] [Google Scholar]
- 8.Fransson P., et al. , “Resting-state networks in the infant brain,” Proc. Natl. Acad. Sci. U. S. A. 104(39), 15531–15536 (2007). 10.1073/pnas.0704380104 [DOI] [PMC free article] [PubMed] [Google Scholar]
- 9.Lin W., et al. , “Functional connectivity MR imaging reveals cortical functional connectivity in the developing brain,” Am. J. Neuroradiol. 29(10), 1883–1889 (2008). 10.3174/ajnr.A1256 [DOI] [PMC free article] [PubMed] [Google Scholar]
- 10.Biswal B. B., Kylen J. V., Hyde J. S., “Simultaneous assessment of flow and BOLD signals in resting-state functional connectivity maps,” NMR Biomed. 10(4–5), 165–170 (1997). [DOI] [PubMed] [Google Scholar]
- 11.Zou Q., et al. , “Static and dynamic characteristics of cerebral blood flow during the resting state,” Neuroimage 48(3), 515–524 (2009). 10.1016/j.neuroimage.2009.07.006 [DOI] [PMC free article] [PubMed] [Google Scholar]
- 12.Miao X., et al. , “Detecting resting-state brain activity by spontaneous cerebral blood volume fluctuations using whole brain vascular space occupancy imaging,” Neuroimage 84, 575–584 (2014). 10.1016/j.neuroimage.2013.09.019 [DOI] [PubMed] [Google Scholar]
- 13.Huber L., et al. , “High-Resolution CBV-fMRI allows mapping of laminar activity and connectivity of cortical input and output in human M1,” Neuron 96(6), 1253.e7–1263.e7 (2017). 10.1016/j.neuron.2017.11.005 [DOI] [PMC free article] [PubMed] [Google Scholar]
- 14.Mantini D., et al. , “Electrophysiological signatures of resting state networks in the human brain,” Proc. Natl. Acad. Sci. U. S. A. 104(32), 13170–13175 (2007). 10.1073/pnas.0700668104 [DOI] [PMC free article] [PubMed] [Google Scholar]
- 15.Brookes M. J., et al. , “Investigating the electrophysiological basis of resting state networks using magnetoencephalography,” Proc. Natl. Acad. Sci. U. S. A. 108(40), 16783–16788 (2011). 10.1073/pnas.1112685108 [DOI] [PMC free article] [PubMed] [Google Scholar]
- 16.Obrig H., Villringer A., “Beyond the visible - imaging the human brain with light,” J. Cereb. Blood Flow Metab. 23(1), 1–18 (2003). 10.1097/01.WCB.0000043472.45775.29 [DOI] [PubMed] [Google Scholar]
- 17.Scholkmann F., et al. , “A review on continuous wave functional near-infrared spectroscopy and imaging instrumentation and methodology,” Neuroimage 85(Pt 1), 6–27 (2014). 10.1016/j.neuroimage.2013.05.004 [DOI] [PubMed] [Google Scholar]
- 18.Mesquita R. C., Franceschini M. A., Boas D. A., “Resting state functional connectivity of the whole head with near-infrared spectroscopy,” Biomed. Opt. Express 1(1), 324–336 (2010). 10.1364/BOE.1.000324 [DOI] [PMC free article] [PubMed] [Google Scholar]
- 19.Homae F., et al. , “Development of global cortical networks in early infancy,” J. Neurosci. 30(14), 4877–4882 (2010). 10.1523/JNEUROSCI.5618-09.2010 [DOI] [PMC free article] [PubMed] [Google Scholar]
- 20.White B. R., et al. , “Bedside optical imaging of occipital resting-state functional connectivity in neonates,” Neuroimage 59(3), 2529–2538 (2012). 10.1016/j.neuroimage.2011.08.094 [DOI] [PMC free article] [PubMed] [Google Scholar]
- 21.Watanabe H., et al. , “Hemoglobin phase of oxygenation and deoxygenation in early brain development measured using fNIRS,” Proc. Natl. Acad. Sci. U. S. A. 114(9), E1737–E1744 (2017). 10.1073/pnas.1616866114 [DOI] [PMC free article] [PubMed] [Google Scholar]
- 22.Keehn B., et al. , “Functional connectivity in the first year of life in infants at-risk for autism: a preliminary near-infrared spectroscopy study,” Front. Hum. Neurosci. 7, 444 (2013). 10.3389/fnhum.2013.00444 [DOI] [PMC free article] [PubMed] [Google Scholar]
- 23.Tachtsidis I., Scholkmann F., “False positives and false negatives in functional near-infrared spectroscopy: issues, challenges, and the way forward,” Neurophotonics 3(3), 031405 (2016). 10.1117/1.NPh.3.3.031405 [DOI] [PMC free article] [PubMed] [Google Scholar]
- 24.Granger C. W. J., Newbold P., “Spurious regressions in econometrics,” J. Econ. 2(2), 111–120 (1974). 10.1016/0304-4076(74)90034-7 [DOI] [Google Scholar]
- 25.Barker J. W., Aarabi A., Huppert T. J., “Autoregressive model based algorithm for correcting motion and serially correlated errors in fNIRS,” Biomed. Opt. Express 4(8), 1366–79 (2013). 10.1364/BOE.4.001366 [DOI] [PMC free article] [PubMed] [Google Scholar]
- 26.Santosa H., et al. , “Characterization and correction of the false-discovery rates in resting state connectivity using functional near-infrared spectroscopy,” J. Biomed. Opt. 22(5), 55002 (2017). 10.1117/1.JBO.22.5.055002 [DOI] [PMC free article] [PubMed] [Google Scholar]
- 27.Huppert T. J., “Commentary on the statistical properties of noise and its implication on general linear models in functional near-infrared spectroscopy,” Neurophotonics 3(1), 10401 (2016). 10.1117/1.NPh.3.1.010401 [DOI] [PMC free article] [PubMed] [Google Scholar]
- 28.Bright M. G., Tench C. R., Murphy K., “Potential pitfalls when denoising resting state fMRI data using nuisance regression,” Neuroimage 154, 159–168 (2017). 10.1016/j.neuroimage.2016.12.027 [DOI] [PMC free article] [PubMed] [Google Scholar]
- 29.Friston K., et al. , “To smooth or not to smooth? Bias and efficiency in fMRI time-series analysis,” Neuroimage 12(2), 196–208 (2000). 10.1006/nimg.2000.0609 [DOI] [PubMed] [Google Scholar]
- 30.Bullmore E., et al. , “Statistical methods of estimation and inference for functional MR image analysis,” Magn. Reson. Med. 35(2), 261–277 (1996). 10.1002/(ISSN)1522-2594 [DOI] [PubMed] [Google Scholar]
- 31.Woolrich M. W., et al. , “Temporal autocorrelation in univariate linear modeling of fMRI data,” Neuroimage 14(6), 1370–1386 (2001). 10.1006/nimg.2001.0931 [DOI] [PubMed] [Google Scholar]
- 32.Barker J. W., et al. , “Correction of motion artifacts and serial correlations for real-time functional near-infrared spectroscopy,” Neurophotonics 3(3), 31410 (2016). 10.1117/1.NPh.3.3.031410 [DOI] [PMC free article] [PubMed] [Google Scholar]
- 33.Hassanpour M. S., et al. , “Statistical analysis of high density diffuse optical tomography,” Neuroimage 85(Pt 1), 104–116 (2014). 10.1016/j.neuroimage.2013.05.105 [DOI] [PMC free article] [PubMed] [Google Scholar]
- 34.Christova P., et al. , “True associations between resting fMRI time series based on innovations,” J. Neural Eng. 8(4), 46025 (2011). 10.1088/1741-2560/8/4/046025 [DOI] [PubMed] [Google Scholar]
- 35.Arbabshirani M. R., et al. , “Impact of autocorrelation on functional connectivity,” Neuroimage 102(Pt 2), 294–308 (2014). 10.1016/j.neuroimage.2014.07.045 [DOI] [PMC free article] [PubMed] [Google Scholar]
- 36.Pritchard W. S., “The brain in fractal time: 1/F-like power spectrum scaling of the human electroencephalogram,” Int. J. Neurosci. 66, 119–129 (1992). 10.3109/00207459208999796 [DOI] [PubMed] [Google Scholar]
- 37.Linkenkaer-Hansen K., et al. , “Long-range temporal correlations and scaling behavior in human brain oscillations,” J. Neurosci. 21, 1370–1377 (2001). 10.1523/JNEUROSCI.21-04-01370.2001 [DOI] [PMC free article] [PubMed] [Google Scholar]
- 38.Lombardi F., Herrmann H. J., de Arcangelis L., “Balance of excitation and inhibition determines 1/f power spectrum in neuronal networks,” Chaos 27, 47402 (2017). 10.1063/1.4979043 [DOI] [PubMed] [Google Scholar]
- 39.Huppert T. J., et al. , “HomER: a review of time-series analysis methods for near-infrared spectroscopy of the brain,” Appl. Opt. 48(10), D280–D298 (2009). 10.1364/AO.48.00D280 [DOI] [PMC free article] [PubMed] [Google Scholar]
- 40.Patel A. X., et al. , “A wavelet method for modeling and despiking motion artifacts from resting-state fMRI time series,” Neuroimage 95, 287–304 (2014). 10.1016/j.neuroimage.2014.03.012 [DOI] [PMC free article] [PubMed] [Google Scholar]
- 41.Scholkmann F., Wolf M., “General equation for the differential pathlength factor of the frontal human head depending on wavelength and age,” J. Biomed. Opt. 18(10), 105004 (2013). 10.1117/1.JBO.18.10.105004 [DOI] [PubMed] [Google Scholar]
- 42.Berens P., “CircStat: a MATLAB toolbox for circular statistics,” J. Stat. Softw. 31(10), (2009). 10.18637/jss.v031.i10 [DOI] [Google Scholar]
- 43.Zimeo Morais G. A., et al. , “Non-neuronal evoked and spontaneous hemodynamic changes in the anterior temporal region of the human head may lead to misinterpretations of functional near-infrared spectroscopy signals,” Neurophotonics 5(1), 011002 (2018). 10.1117/1.NPh.5.1.011002 [DOI] [PMC free article] [PubMed] [Google Scholar]
- 44.Homae F., et al. , “Large-scale brain networks underlying language acquisition in early infancy,” Front. Psychol. 2, 93 (2011). 10.3389/fpsyg.2011.00093 [DOI] [PMC free article] [PubMed] [Google Scholar]
- 45.Damaraju E., et al. , “Functional connectivity in the developing brain: a longitudinal study from 4 to 9 months of age,” Neuroimage 84, 169–180 (2014). 10.1016/j.neuroimage.2013.08.038 [DOI] [PMC free article] [PubMed] [Google Scholar]
- 46.Fransson P., et al. , “Spontaneous brain activity in the newborn brain during natural sleep—an fMRI study in infants born at full term,” Pediatr. Res. 66(3), 301–305 (2009). 10.1203/PDR.0b013e3181b1bd84 [DOI] [PubMed] [Google Scholar]
- 47.Gao W., et al. , “Functional network development during the first year: relative sequence and socioeconomic correlations,” Cereb. Cortex 25(9), 2919–2928 (2015). 10.1093/cercor/bhu088 [DOI] [PMC free article] [PubMed] [Google Scholar]
- 48.Wolf M., et al. , “Different time evolution of oxyhemoglobin and deoxyhemoglobin concentration changes in the visual and motor cortices during functional stimulation: a near-infrared spectroscopy study,” Neuroimage 16(3 Pt 1), 704–712 (2002). 10.1006/nimg.2002.1128 [DOI] [PubMed] [Google Scholar]
- 49.Caballero Gaudes C., et al. , “Paradigm free mapping with sparse regression automatically detects single-trial functional magnetic resonance imaging blood oxygenation level dependent responses,” Hum. Brain Mapp. 34(3), 501–518 (2013). 10.1002/hbm.21452 [DOI] [PMC free article] [PubMed] [Google Scholar]
- 50.Karahanoğlu F. I., et al. , “Total activation: fMRI deconvolution through spatio-temporal regularization,” Neuroimage 73, 121–134 (2013). 10.1016/j.neuroimage.2013.01.067 [DOI] [PubMed] [Google Scholar]
- 51.Gitelman D. R., et al. , “Modeling regional and psychophysiologic interactions in fMRI: the importance of hemodynamic deconvolution,” Neuroimage 19(1), 200–207 (2003). 10.1016/S1053-8119(03)00058-2 [DOI] [PubMed] [Google Scholar]
- 52.Kirilina E., et al. , “Identifying and quantifying main components of physiological noise in functional near infrared spectroscopy on the prefrontal cortex,” Front. Hum. Neurosci. 7, 864 (2013). 10.3389/fnhum.2013.00864 [DOI] [PMC free article] [PubMed] [Google Scholar]
- 53.Holper L., Scholkmann F., Seifritz E., “Time-frequency dynamics of intra- and extracerebral hemodynamic functional connectivity during resting-state and respiratory challenges assessed by multimodal functional near-infrared spectroscopy,” Neuroimage 120, 481–492 (2015). 10.1016/j.neuroimage.2015.07.021 [DOI] [PubMed] [Google Scholar]
- 54.Boas D. A., Dale A. M., Franceschini M. A., “Diffuse optical imaging of brain activation: approaches to optimizing image sensitivity, resolution, and accuracy,” Neuroimage 23, S275–S288 (2004). 10.1016/j.neuroimage.2004.07.011 [DOI] [PubMed] [Google Scholar]
- 55.Kirilina E., et al. , “The physiological origin of task-evoked systemic artefacts in functional near infrared spectroscopy,” Neuroimage 61(1), 70–81 (2012). 10.1016/j.neuroimage.2012.02.074 [DOI] [PMC free article] [PubMed] [Google Scholar]
- 56.Pfeifer M. D., Scholkmann F., Labruyère R., “Signal processing in functional near-infrared spectroscopy (fNIRS): methodological differences lead to different statistical results,” Front. Hum. Neurosci. 11, 641 (2018). 10.3389/fnhum.2017.00641 [DOI] [PMC free article] [PubMed] [Google Scholar]


