

INTRODUCTION
In healthcare settings, patients with infectious diseases release pathogen-containing bodily fluids (e.g., vomitus, diarrhea, respiratory secretions) and otherwise shed pathogens into the environment, which may result in healthcare-associated infections (HAIs) among other patients and healthcare personnel. Pathogen contamination of environmental surfaces in patient rooms has been widely documented, 1,2 and is thought to be specifically associated with HAIs.3 Thus, cleaning of environmental surfaces to remove pathogens is recommended to prevent HAIs.4
There remains a knowledge gap about the exposures of environmental service workers (ESWs) to pathogens in healthcare settings. Cleaning requires ESWs to be in close, and potentially prolonged proximity, to infectious agents. Most research involving ESWs in healthcare settings has focused on improving the quality of cleaning, particularly with respect to terminal room cleaning,5 not on infection risks. To begin to understand the exposures of ESWs to pathogens during cleaning in healthcare settings, we performed a simulation study in which ESWs were recruited to clean simulated vomitus in a room-scale chamber. Herein, we describe contamination in the environment and on workers’ bodies associated with cleaning simulated, fluorescein-containing vomitus. Elsewhere, we have described the environmental surface and body contacts of the participants.6
METHODS
Details of the experimental simulation approach are provided elsewhere.6 Briefly, participants with experience in hospital cleaning were recruited and asked to clean 200 mL of simulated vomitus in a room-scale chamber (2.5 m × 4.5 m × 2.4 m high). The chamber floor was marked into a grid (30.5 cm by 30.5 cm grid, or 929 cm2), labeled by row (A-O) and column (1–9) (Figure 1). Simulated vomitus was a mixture of protein powder, water, sodium phosphate and fluorescein powder (106 μg/L).7 Four experimental conditions were used: 1) low viscosity vomitus poured on the side of the gurney (LG), 2) high viscosity vomitus poured on the side of the gurney (HG), 3) low viscosity vomitus poured on the floor (LF), and 4) high viscosity vomitus poured on the floor (HF). Vomitus was poured near grid square F4 (Figure 1). Participation involved a 2-hour time commitment and was incentivized with a $40 gift card. The University of Illinois at Chicago Institutional Review Board approved this study, protocol 2015–0990.
Figure 1.
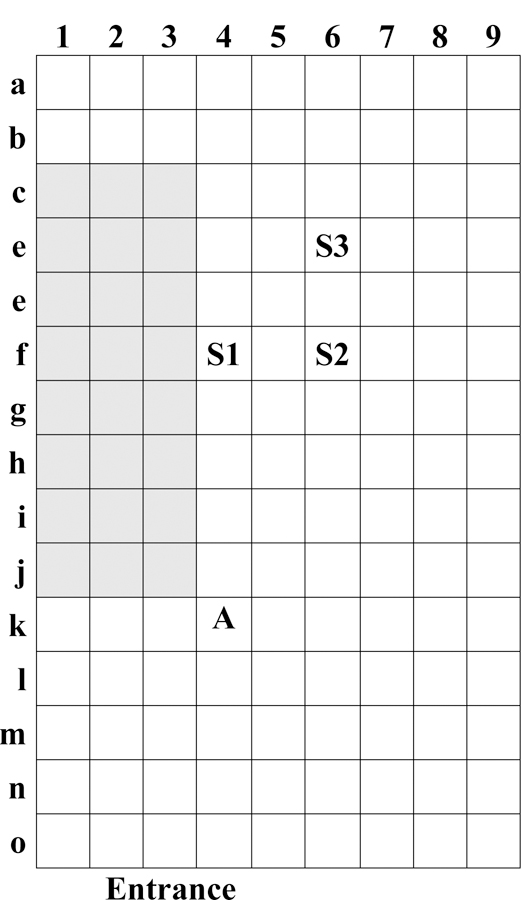
Layout of the room-scale chamber. Shaded boxes indicate location of the gurney. S1, S2 and S3 denote locations of floor sampling; and A denotes location of air sampling.
Environmental contamination of the chamber, indicated by the presence of fluorescein, was qualitatively measured under black light and described by the maximum radius and area contaminated before and after cleaning. Fluorescein was quantitatively measured at three pre-specified locations (grid squares F4, F6 and D6, Figure 1) by swabbing each area with a Sponge Stick (3M, Minneapolis, MN). Fluorescein was measured in the air near the site of contamination, 70 cm above the floor at grid square K4, using a five-stage Sioutas cascade impactor, with 37-mm and 25-mm PTFE filters (SKC Inc., Eighty Four, PA) and air flow rate of 9 L/min.
Body contamination of the participant was qualitatively measured under black light before and after doffing personal protective equipment (PPE). Observations were recorded separately for the palm, fingers, and back of the right and left glove and hand, the sole and top of the right and left shoe cover and shoe, the eye and forehead area, the mouth and nose area, goggles or face shield (if worn), and the mask or respirator (if worn). Visible contamination at each location was recorded as the number of spots < 1 cm and 1–3 cm in diameter, and percentage of the surface area contaminated by spots > 3 cm in diameter. In tabulating total percent surface area visibly contaminated, each spot < 1 cm in diameter were equated with 1% surface area, while spots 1–3 cm in diameter were equated with 2% surface area. The total surface area visibly contaminated was categorized by percent of surface area as: none, low (> 0 and ≤ 25% of the area contaminated), medium (> 25 and ≤ 50%) and high (> 50%).
Fluorescein was extracted for quantification by agitation of the sampling device with sodium phosphate buffer and measured in triplicate using a Trilogy bench-top fluorometer (Turner Designs, San Jose, CA): The average value is reported. The fluorometer was calibrated to report fluorescein concentration in μg/L using a five-point calibration curve, with quality criterion R2 > 0.99. The limit of detection was 0.038 μg/L. The fluorescein concentration in buffer (μg/L) was converted to mass concentration per surface area (μg/cm2) for Sponge Sticks, to mass concentration per air volume (ng/m3) for air filters, and to total mass for gloves and shoe covers (μg).
Between trials, plastic sheeting on the chamber floor was replaced, and the absence of visible contamination verified under black light. Blank trials, in which participants performed cleaning activities without simulated vomitus, were used to verify the absence of fluorescein in the chamber. Quality control also included the analysis of blank sampling media (filters, Sponge Sticks, gloves and shoe covers). Sponge Sticks were found consistently to have some fluorescent component, equal to 1.08 μg fluorescein (see Supplementary materials). As a result, the floor contamination data reported have been blank corrected. Air sampling filters were found contaminated on the day of two experimental trials (3-A1 and 3-A2). As a result, the results of these trials were excluded from analysis and the packages of filters discarded. Experimental blanks were elevated (but < 5 μg) on the day of experimental trials 4-A1 and 4-A2, so these data were blank corrected.
Results have not been corrected for sampling and extraction efficiencies, but the method performance was quantified (see Supplementary Materials). Briefly, sampling and extraction efficiency for Sponge Sticks sampling fluorescein from plastic-covered surfaces was 57.3%, on average. The extraction efficiency for the air sampling filters was 99.0%, on average.
As in previous work,6 a crude measure of cleaning quality was defined as the ratio of the spatial extent of contamination after cleaning to the spatial extent of contamination before cleaning. This ratio was then categorized as: 1) < 0.5, 2) ≥ 0.5 to < 1.0, 3) ≥ 1.0. Category 3 means that the extent of contamination after cleaning was equal to or greater than before cleaning. Cleaning practices were compared to the protocols recommended by the Healthcare Infection Control Practices Advisory Committee (HICPAC)8 and the University of Illinois Hospital: Participants who used towels to pick-up the bulk fluid and cleaned from high to low surfaces were considered to follow the protocol.
Participants’ dominant hand was inferred from observing behavior in video recordings of cleaning activities.
Data were initially recorded on paper forms or bound laboratory notebooks with duplicate pages, and entered into a database (Access™ 2016, Micrsoft Corporation, Redmond, WA). All data analysis was performed with R: A Language and Environment for Statistical Computing (The R Foundation for Statistical Computing, Vienna, Austria). Two-way and multi-way comparisons were made using the Mann-Whitney (MW) and Kruskal-Wallis (KW) tests, respectively, with statistical significance set to α = 0.05. Correlations were calculated using Spearman’s method. Though the design involves repeated measures for participants, observations were treated as independent in the statistical analyses due to the small number of replicates and participants.
RESULTS
The area of fluorescein contamination on the floor visible under black light varied by experimental condition prior to cleaning (KW p = 0.01), with low viscosity simulated vomitus contaminating larger areas (Table 1). No difference, however, was observed in the maximum distance of contamination among the experimental conditions (KW p = 0.06).
Table 1.
Environmental Fluorescein Contamination
| Trial2 | Condition3 | Visible Contamination | Cleaning Quality |
Quantitative Contamination |
Fluorescein Concentration in Air (ng/m3) |
|||||||
|---|---|---|---|---|---|---|---|---|---|---|---|---|
| Before Cleaning | After Cleaning | Floor (μg)1 | ||||||||||
| Radius (m) | Area (m2) | Area (m2) | Increased | Site 1 | Site 2 | Site 3 | Mean | |||||
| 1-A1 | LG | 2.3 | 5.4 | 3.5 | No | 2 | 10.6 | 19.6 | 7.66 | 12.6 | ≤ 22.3 | |
| 1-B1 | LF | 2.4 | 6.0 | 2.4 | No | 1 | 6.29 | 7.05 | 4.83 | 6.06 | ≤ 41.7 | |
| 1-B2 | HF | 1.0 | 2.3 | 0.2 | No | 1 | 3.03 | 2.51 | 2.59 | 2.71 | ≤ 116 | |
| 2-A1 | LG | 1.8 | 5.3 | 1.9 | No | 1 | 0 | 2.64 | 3.82 | 2.12 | ≤ 23.3 | |
| 2-A2 | HF | 1.2 | 0.9 | 0.4 | No | 1 | 0.87 | 0.08 | 0.32 | 0.42 | ≤ 46.9 | |
| 2-B1 | HF | 1.4 | 1.9 | 0.2 | No | 1 | 2.56 | 0.81 | 0.18 | 1.18 | ≤ 31.8 | |
| 2-B2 | HG | 1.7 | 3.3 | 0.2 | No | 1 | 1.93 | 1.17 | 0.47 | 1.19 | ≤ 34.9 | |
| 3-A1 | HF | 1.2 | 1.6 | 5.0 | Yes | 3 | 9.75 | 6.76 | 7.10 | 7.87 | -4 | |
| 3-A2 | HG | 1.5 | 3.2 | 0.6 | No | 1 | 3.48 | 3.59 | 2.88 | 3.32 | -4 | |
| 3-B1 | LG | 2.1 | 6.7 | 4.1 | No | 2 | 12.6 | 27.2 | 16.4 | 18.7 | ≤ 23.5 | |
| 3-B2 | LF | 2.3 | 7.5 | 5.1 | No | 2 | 19.0 | 23.6 | 13.1 | 18.6 | ≤ 73.7 | |
| 4-A1 | LG | 2.0 | 6.4 | 1.4 | No | 1 | 0.96 | 1.01 | 0.52 | 0.83 | 4,2705 | |
| 4-A2 | HG | 1.4 | 2.9 | 0.2 | No | 1 | 0.22 | 0.31 | 0.26 | 0.27 | ≤ 98.15 | |
| 5-A1 | HG | 0.8 | 1.2 | 0.2 | No | 1 | 0.09 | 0.19 | 0.18 | 0.15 | ≤ 16.3 | |
| 5-A2 | LF | 2.5 | 7.8 | 1.8 | No | 1 | 12.8 | 11.3 | 12.3 | 12.1 | ≤ 23.3 | |
| 6-A1 | HF | 0.9 | 1.9 | 0.3 | No | 1 | 1.81 | 1.90 | 2.04 | 1.92 | ≤ 46.6 | |
| 6-A2 | LF | 2.2 | 6.8 | 2.3 | No | 1 | 8.34 | 5.22 | 5.47 | 6.34 | ≤ 33.8 | |
| 7-A1 | LF | 2.1 | 6.4 | 8.1 | Yes | 1 | 87.1 | 74.7 | 88.3 | 83.3 | -6 | |
| 7-A2 | LG | 2.1 | 5.7 | 9.6 | Yes | 3 | 86.7 | 56.0 | 75.1 | 72.6 | ≤ 70.2 | |
| 7-B1 | HG | 1.0 | 2.7 | 6.0 | Yes | 3 | 113 | 68.6 | 33.3 | 71.6 | ≤ 69.6 | |
| 7-B2 | HF | 1.0 | 3.1 | 6.8 | Yes | 3 | 117 | 46.7 | 23.0 | 62.3 | ≤ 85.1 | |
| Mean | 1.7 | 4.2 | 3.1 | 23.7 | 17.2 | 14.3 | 18.6 | |||||
| Median | 1.7 | 3.3 | 2.1 | 6.30 | 5.22 | 4.83 | 6.06 | ≤ 45.3 | ||||
Blank corrected by subtraction of 1.08 μg; to obtain concentration (μg/in2), divide by sampling surface area 929 cm2
Trial code indicates participant number, visit and trial during visit. 2-B1 is the first trial during visit B of participant 2.
Condition refers to experimental condition: LG is low viscosity simulated vomitus poured on gurney, HG is high viscosity on gurney, LF is low viscosity poured on floor, and HF is high viscosity on floor.
Samples from this day of experiments were excluded due to gross contamination of the filters detected in laboratory and field blanks
These samples were blank corrected, based on blank values: 0.80, 2.70, 4.70, 0.38 and 1.30 ng for filter stages A, B, C, D and E.
Sample was not collected or lost
Fluorescein was visible under black light and quantitatively measured on the floor in all trials (Table 1). However, cleaning reduced the area of visible contamination in 76% of trials (Table 1). Between experimental trials, the level of floor contamination varied five orders of magnitude (0.09–117 μg), but within each trial, results at the three sites were relatively similar, within 2-or 3-fold. The mean fluorescein contamination on the floor after cleaning was not the same for the three categories of cleaning quality (KW p = 0.001): Poorer cleaning quality was associated with higher fluorescein contamination (Figure 1).
Fluorescein was infrequently quantified in air samples above the limit of detection (LOD), 0.38 ng. Fluorescein was quantified from 25% of stage A filters (particle aerodynamic diameter > 2.5 μm), 33% of stage B filters (1.0–2.5 μm), 17% of stage C filters (0.5–1.0 μm), 22% of stage D filters (0.25–0.5 μm) and 11% of stage E filters (< 0.25 μm). In only one sample (trial 4-A1) were samples from all stages quantified. Most fluorescein concentrations in air shown in Table 1 are reported as less than or equal to some value because one or more filters had fluorescein concentrations below the LOD (Table 1), and the LOD was substituted to provide a maximum estimate. Experimental trial 4-A1 appears to be different from other trials, as the air concentration, 4,270 ng/m3, was two orders of magnitude larger than other trial results (≤ 116 ng/m3).
Participants’ gloves were visibly contaminated in every trial (Table 2). The fingers were most frequently observed to have medium or high contamination (> 25% of area contaminated), occurring in 52% and 76% of trials on the left and right, hand respectively: All participants appeared to be right-handed. The fluorescein mass on gloves ranged up to 66.8 μg (mean 5.96 μg, Table 3), and was correlated with the total percent of glove surface area contaminated (ρ = 0.47, p = 0.03).
Table 2.
Frequency of fluorescein contamination on participant’s gloves and shoe covers. Visible contamination was classified as: none, low (>0 and ≤ 25%), medium (> 25% and ≤ 50%) or high (>50%).
| Percent of Trials with Contamination (%) |
||||||||||
|---|---|---|---|---|---|---|---|---|---|---|
| Gloves | Shoe Covers | |||||||||
| Contamination | Left | Right | Left | Right | ||||||
| Level | Palm | Fingers | Back | Palm | Fingers | Back | Sole | Top | Sole | Top |
| None | 19 | 10 | 14 | 10 | 5 | 0 | 10 | 67 | 5 | 48 |
| Low | 48 | 38 | 52 | 33 | 19 | 57 | 5 | 29 | 10 | 38 |
| Medium | 33 | 52 | 29 | 57 | 76. | 33 | 0 | 5 | 0 | 14 |
| High | 0 | 0 | 45 | 0 | 0 | 10 | 86 | 0 | 85 | 0 |
Table 3.
Fluorescein Contamination on Participants’ Bodies Before Doffing Personal Protective Equipment.
| Trial | Fluorescein Mass (ug) |
Other Contaminated Body Parts | |
|---|---|---|---|
| Gloves | Shoe Covers | ||
| 1-A1 | 0.20 | 105 | Front and Back of Legs |
| 1-B1 | 0.69 | 137 | |
| 1-B2 | 0.38 | 1.62 | |
| 2-A1 | 0.78 | 12.7 | Knees |
| 2-A2 | 1.30 | 0.00 | Right Knee |
| 2-B1 | 5.08 | 2.46 | |
| 2-B2 | 0.42 | 22.0 | |
| 3-A1 | 0.64 | 49.4 | Front of Ankles |
| 3-A2 | 0.07 | 29.4 | Right Forearm, Front of Lower Left Leg |
| 3-B1 | 0.13 | 229 | |
| 3-B2 | 0.18 | 85.5 | Front of Right Upper Leg |
| 4-A1 | 1.40 | 200 | Abdomen, Upper Left Arm |
| 4-A2 | 0.27 | 19.3 | |
| 5-A1 | 0.29 | 0.00 | |
| 5-A2 | 0.29 | 33.0 | |
| 6-A1 | 0.00 | 1.76 | |
| 6-A2 | 0.41 | 76.2 | Front of Right Leg |
| 7-A1 | 0.15 | 26.1 | |
| 7-A2 | 35.8 | 158 | |
| 7-B1 | 66.8 | 68.5 | |
| 7-B2 | 4.26 | 60.5 | |
| Mean | 5.96 | 62.7 | |
| Median | 0.42 | 33.0 | |
In 86% of trials, the soles of shoe covers worn by participants were found to have high levels of visible contamination (approximately 100%), indicating that most participants stepped in the simulated bodily fluid during cleaning (Table 2). The spatial extent of contamination on the top of the shoe covers, when it occurred, was low or moderate. The fluorescein mass on shoe covers ranged up to 200 μg (mean 62.7 μg, Table 3), and was correlated with the total percent of surface area contaminated (ρ = 0.86, p < 0.01) and mass on the floor after cleaning (ρ = 0.60, p = 0.01).
Contamination on other parts of participants’ bodies occurred in 8 (38%) trials, and generally involved the legs (Table 3). Contamination of the knees was associated with participants’ kneeling. No contamination was visible on participants’ facial PPE or faces. Upon removal of PPE, in two trials participants’ hands were visually contaminated in small areas (≤ 5%), and in one trial the sole of one participant’s shoe was contaminated in a small area (< 5%).
The cleaning tools used in each trial was previously reported. 6 The mean fluorescein contamination on the floor after cleaning was negatively associated with the number of moist towels (ρ = −0.48, p = 0.03), and with the total number of (moist and dry) towels (ρ = −0.56, p = 0.01) used during cleaning; but not with the number of dry towels or mop heads used. Fluorescein contamination on the floor after cleaning was not associated with the use of liquid cleaning product (MW p = 0.12). Overall, following the recommended protocol was statistically significantly associated with lower floor contamination after cleaning (MW p = 0.02).
Previously,6 we reported the contact patterns and frequency in each experimental trial, and we found the fluorescein mass on gloves was not associated with contact number or frequency (see Supplemental Materials).
DISCUSSION
The spatial extent of contamination by simulated vomitus in these experiments was large, extending up to 2.5 m from the point of emission (Table 1), but patients may emit vomitus in larger volumes and with more energy, which could extend the area of contamination. It is important to understand the extent of vomitus contamination to ensure that the appropriate area is cleaned.6
The varied quality of floor cleaning (Table 1) is consistent with findings in hospitals that cleaning effectiveness for frequently touched environmental surfaces is imperfect and highly variable.9–11 Further, pathogen contamination on floors is common and can disseminate broadly within the patient room, to portable equipment, and to adjacent areas in the hospital.12,13 Our findings indicate that cleaning practices and/or frequency may need to be altered to yield consistent, effective cleaning after bodily fluid spills.
The lack of association between glove contamination and contacts with environmental surfaces, indicates that glove contamination may result from sporadic contact events, such as picking up contaminated towels from the floor or removing mop heads, rather than accumulation of contamination across multiple contacts. In this study we asked participants to not change gloves so as to capture the total magnitude of contamination, but this finding suggests that workers should change gloves during cleaning activities, when the gloves are soiled. The rarity of hand contamination after glove removal (observed in two trials) indicates that gloves maintained integrity and doffing practices prevented cross contamination. Future work will consider the specific doffing practices observed in these and other ongoing healthcare simulation studies. The observed shoe cover and clothing contamination suggest a potential for transfer to contamination outside of the patient room.
The evidence base for recommended cleaning protocols is limited, with emphasis placed more on disinfectant performance (or novel disinfectant tools like wipes or ultraviolet radiation) than on how to use conventional cleaning tools.8,14 Our finding that the use of towels to pick up bulk fluid was associated with lower fluorescein contamination on the floor, however, supports the cleaning strategy recommended by the HICPAC;8 and makes sense because the towels are more efficient than mop heads at removing fluid volume.
To help interpret the quantitative fluorescein contamination data in this study we consider the ratio between the measured fluorescein mass (or mass concentration) in the environment and the mass emitted into the environment, termed here in contamination fraction. This concept is analogous to the spray fraction used in occupational health to describe the concentration of pathogens in the air near workers’ breathing zones relative to the concentration of pathogens in materials being manipulated in laboratory procedures.15,16 These types of ratios are helpful to extrapolate exposures when the magnitude, but not the context, of emission changes over time. For example, in this study, we measured environmental contamination of 2 × 10⁵ μg of fluorescein (200 mL of simulated vomitus with 106 μg/L fluorescein), but in the actual healthcare setting the volume of vomitus and the concentration of pathogens in vomitus may vary. Applying the contamination fraction determined in this study to the pathogens emitted in vomitus will yield estimates for pathogen contamination on the floor, in the air or on gloves.
To illustrate, consider the contamination fraction describing the material that remains on the floor after cleaning. The fluorescein emitted into the chamber is 2 × 10⁵ μg, and is the denominator. The average floor contamination measured in 929 cm2 areas after cleaning was 18.6 μg (Table 1), or 0.02 μg/cm2. The mean floor contamination fraction is 0.02 μg/cm2 divided by 2 × 10⁵ μg, or 10–7. If 500 mL of vomitus containing 105 genomic equivalent copies (GEC) of norovirus per mL,17 or 5 × 10⁷ GEC, were emitted, the concentration of norovirus GEC on the floor would be 5.04 GEC/cm2. For reference, the median infectious dose of norvorius has been estimated to be 1320 GEC.18 Observed cleaning quality (Table 1) suggests the concentration of norovirus GEC may be higher than 5.04 GEC/cm2 in some areas of the floor. When cleaning vomitus and other body fluids, workers would use disinfectants that inactivate pathogens,8 decreasing the presence of infectious pathogens over time. Thus, an estimate of contamination based on fluorescein data in this study would yield a conservative estimate of contamination after cleaning. It is important to consider, however, that the performance of disinfectants depends upon the pathogen, contact time, and dilution, and may not always inactivate pathogens as expected.
A limitation of this study was the modest sample size, with seven participants that each participated in 2–4 trials with simulated vomitus. The primary concern with a modest sample size is that the sample represents the variability in the population of interest. Here and in our previous report6, we described variation between participants with respect to cleaning strategy, cleaning quality, cleaning tool use and contact patterns, suggesting that we captured some, if not all, of the variation in cleaning practices. In general, there is concern that participants change their behaviors when observed, but the poor cleaning quality and lack of compliance with the recommended cleaning protocol suggest that participants did not systematically change (improve) their cleaning practices.
Supplementary Material
Figure 2.
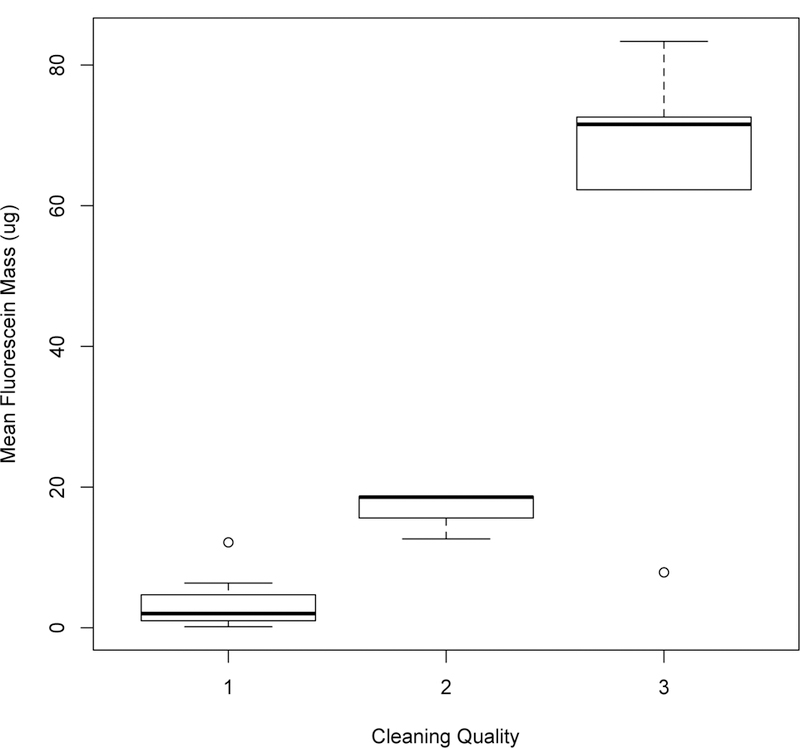
Increased cleaning quality is associated with decreased residual fluorescein contamination on the floor.
ACKNOWLEDGEMENTS
We acknowledge the helpful assistance of Charline Gooley, Superintendent of Building Services at the University of Illinois Hospital. We acknowledge Drs. Lisa Brosseau, Susan Bleasdale and Monica Sikka for their thoughtful discussions about the study design. Electronic data tables in this manuscript and the Supplementary Materials will be available online at time of publication at UIC INDIGO (https://indigo.uic.edu); raw data will be available within 16 months at the same location.
Financial Support. This work was supported by the Centers for Disease Control and Prevention Epicenter Program through cooperative agreement U54CK000445, the UIC Epicenter for Prevention of Healthcare Associated Infections.
Footnotes
Conflict of Interest. All authors report no conflicts of interest relevant to this article.
REFERENCES
- 1.Cheng VC et al. Hand-touch contact assessment of high-touch and mutual-touch surfaces among healthcare workers, patients, and visitors. J Hosp Infect 90, 220–225 (2015). [DOI] [PubMed] [Google Scholar]
- 2.Shek K et al. Rate of contamination of hospital privacy curtains on a burns and plastic surgery ward: a cross-sectional study. J Hosp Infect 96, 54–58 (2017). [DOI] [PubMed] [Google Scholar]
- 3.Weber DJ, Anderson D & Rutala WA The role of the surface environment in healthcare-associated infections. Curr Opin Infect Dis 26, 338–344 (2013). [DOI] [PubMed] [Google Scholar]
- 4.Dancer S The role of environmental cleaning in the control of hospital-acquired infection. J Hosp Infect 73, 378–385 (2009). [DOI] [PubMed] [Google Scholar]
- 5.Ramphal L, Suzuki S, Mercy mcCracken I & Addai A Improving hospital staff compliance with environmental cleaning behavior. Proc Bayl Univ Med Cent 27, 88–91 (2014). [DOI] [PMC free article] [PubMed] [Google Scholar]
- 6.Su Y, Contact patterns during cleaning of vomitus: a simulation study. Am. J. Infect. Control (207AD) [DOI] [PubMed]
- 7.Su YM & Jones RM Recipes for simulated vomitus (submitted). [DOI] [PMC free article] [PubMed]
- 8.Sehulster LM & Chinn RYW Guidelines for environmental infection control in health-care facilities. Recommendations from CDC and the Healthcare Infection Control Practices Advisory Committee (HICPAC). MMW Recomm. Rep 52, 1–42 (2003). [PubMed] [Google Scholar]
- 9.Makison Booth C Vomiting Larry: a simulated vomiting system for assessing environmental contamination from projectile vomiting related to norovirus infection. J Infect Prev 15, 176–180 (2014). [DOI] [PMC free article] [PubMed] [Google Scholar]
- 10.Carling PC, Parry MF, Bruno-Murtha LA & Dick B Improving environmental hygiene in 27 intensive care units to decrease multidrug-resistant bacterial transmission. Crit Care Med 38, 1054–1059 (2010). [DOI] [PubMed] [Google Scholar]
- 11.Goodman ER et al. Impact of an environmental cleaning intervention on the presence of methicillin-resistant Staphylococcus aureus and vancomycin-resistant enterococci on surfaces in intensive care unit rooms. Infect Cont Hosp Epidemiol 29, 593–599 (2008). [DOI] [PMC free article] [PubMed] [Google Scholar]
- 12.Griffith CJ, Obee P, Cooper RA, Burton NF & Lewis M The effectiveness of existing and modified cleaning regimens in a Welsh hospital. J Hosp Infect 66, 351–359 (2007). [DOI] [PubMed] [Google Scholar]
- 13.Deshpande A et al. Are hospital floors an underappreciated reservoir for transmission of health care-associated pathogens? Am J Infect Control 45, 336–338 (2017). [DOI] [PubMed] [Google Scholar]
- 14.Kogatni S et al. Evaluation of hospital floors as a potential source of pathogen dissemination using a nonpathogenic virus as a surrogate marker. Infect Cont Hosp Epidemiol 37, 1374–1377 (2016). [DOI] [PubMed] [Google Scholar]
- 15.Han J et al. Cleaning hospital room surfaces to prevent health care-associated infections. Ann Intern Med 163, 598–607 (2015). [DOI] [PMC free article] [PubMed] [Google Scholar]
- 16.Dimmick RL, Vogl WF & Chatigny MA Potential for accidental microbial aerosol transmission in the biological laboratory. in Biohazards in biological research (eds. Hellman A, Oxman MN & Pollack R) 246–266 (Cold Spring Harbor Laboratory, 1973). [Google Scholar]
- 17.Bennett A & Parks S Microbial aerosol generation during laboratory accidents and subsequent risk assessment. J Appl Microbiol 100, 658–663 (2006). [DOI] [PubMed] [Google Scholar]
- 18.Kirby AE, Streby A & Moe CL Vomiting as a symptom and transmission risk in norovirus illness: Evidence from human challenge studies. PLoS One 11, e0143759 (2016). [DOI] [PMC free article] [PubMed] [Google Scholar]
- 19.Atmar RL et al. Determination of the 50% human infectious dose for Norwalk virus. J Infect Dis 209, 1016–1022 (2014). [DOI] [PMC free article] [PubMed] [Google Scholar]
Associated Data
This section collects any data citations, data availability statements, or supplementary materials included in this article.