Abstract
Protein post-translational modifications provide critical proteomic details towards elucidating mechanisms of altered protein function due to toxic exposure, altered metabolism, or disease pathogenesis. Lysine propionylation is a recently described modification that occurs due to metabolic alterations in propionyl-CoA metabolism and sirtuin depropionylase activity. Acrolein is a toxic aldehyde generated through exogenous and endogenous pathways, such as industrial exposure, cigarette smoke inhalation, and non-enzymatic lipid peroxidation. Importantly, lysine modifications arising from propionylation and acroleination can be isobaric – indistinguishable by mass spectrometry – and inseparable via reverse-phase chromatography. Here, we present the novel application of trapped ion mobility spectrometry (TIMS) to resolve such competing isobaric lysine modifications. Specifically, the PTM products of a small synthetic peptide were analyzed using a prototype TIMS – time-of-flight mass spectrometer (TIMS-TOF). In that the mobilities of these propionylated and acroleinated peptides differ by only 1%, a high-resolution mobility analysis is required to resolve the two. We were able to achieve more than sufficient resolution in the TIMS analyzer (~170), readily separating these isobars.
Keywords: Acylation, propionylation, propionyl-CoA, acrolein, oxidative stress, mass spectrometry, ion mobility shift
Introduction
Understanding the biochemical relevance and complexity of protein post-translational modifications (PTMs) remains a key factor in deciphering proteomic biomarkers and variances in human health and disease (Gajadhar and White 2014, Ebhardt, Root et al. 2015). While species-specific mass spectral libraries now contain thousands of tandem mass spectrometry peptide fingerprints, resolving protein modifications to correlate functional relationships in translational research remains relatively difficulty (Khoury, Baliban et al. 2011). Analytical methods must continue to adapt to the ever-growing landscape of proteomic PTMs.
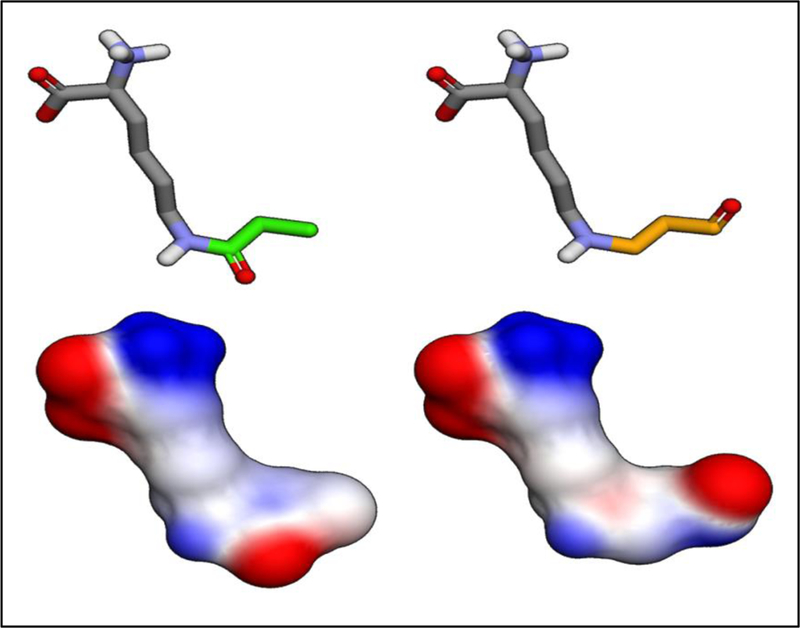
Lysine residues are susceptible to myriad PTMs. A number of these, such as ubiquitination and acetylation, are becoming well characterized (Xu, Paige et al. 2010, Lin, Su et al. 2012). Yet others have only recently been discovered, including butyrylation, succinylation, and propionylation (Choudhary, Weinert et al. 2014, Papanicolaou, O’Rourke et al. 2014). Additionally, oxidative stress induced lipid peroxidation generates numerous reactive aldehydes that have been shown to modify lysine residues (Esterbauer 1993, Fritz and Petersen 2013). Lysine modification via reactive aldehyde is directed primarily through electrophile-nucleophile reactivity based on Hard Soft Acid Base chemistry (HSAB) (LoPachin and Gavin 2014). These various lysine-targeted PTMs create a complex narrative of protein regulation. Through the modification of solvent-accessible lysine residues, these PTMs are able to impact cofactor binding, quaternary structure, and protein electrostatics, among many other biochemical variables (Figure 1).
Figure 1.

Lysine modified via propionylation (green) and acrolein (orange) illustrate isobaric PTMs (top). Elec-trophilic density maps show the impact each PTM has on amino acid charge-state dynamics (bottom).
Mass spectrometry (MS) has become a powerful tool in proteomics discovery for elucidating mechanisms of altered protein modification during disease pathogenesis (Baker, Liu et al. 2012, Wang, Shi et al. 2016). Utilizing novel technology such as electron transfer dissociation (ETD) and trapped ion mobility spectrometry (TIMS) has the potential to extend discovery of novel PTMs (Fritz, Kellersberger et al. 2012, Silveira, Ridgeway et al. 2014, Pu, Ridgeway et al. 2016). Previous work has demonstrated the application of TIMS in the identification of isomeric glycans (Pu, Ridgeway et al. 2016). Here, we present the application of TIMS-MS to resolve isobaric lysine modifications.
Experimental Methods
Materials and reagents
Lysine modification and analysis was performed on the peptide PFGK (Sigma, P6691). Peptide modification was performed with acrolein diethyl acetate 96% (Aldrich A24001–25G) and Propionic anhydride >99% (Aldrich 240311–50G). Acrolein was prepared fresh as described elsewhere (Cai, Bhatnagar et al. 2009). Propionic anhydride was prepared fresh in 100% methanol.
Peptide Modification
Stock PFGK peptide was dissolved in 10 mM ammonium bicarbonate (ABC). 100 μL aliquots of peptide were prepared for control, acrolein, and propionyl treatment, and each sample was modified with 10 μL of 10 mM ABC with 200 μM acrolein, and 200 μM propionic anhydride, respectively. Each treatment occurred for 45 min at room temperature. Sample clean-up was performed using C18 ZipTip pipette tips (EMDMillipore). It is important to note that acrolein is capable of generating a host of complex modifications which complicate identification by mass spectrometry, while the propionylation reaction is predicted to produce only a few potential modifications, with the propionyl-lys being the major product (Cai, Bhatnagar et al. 2009, Maeshima, Honda et al. 2012, Zee and Garcia 2012). To prevent cross-contamination of peptide modification, the stock peptide solutions were modified separately for analysis and then combined for experiments utilizing direct-infusion TIMS separation.
TIMS-MS Analysis
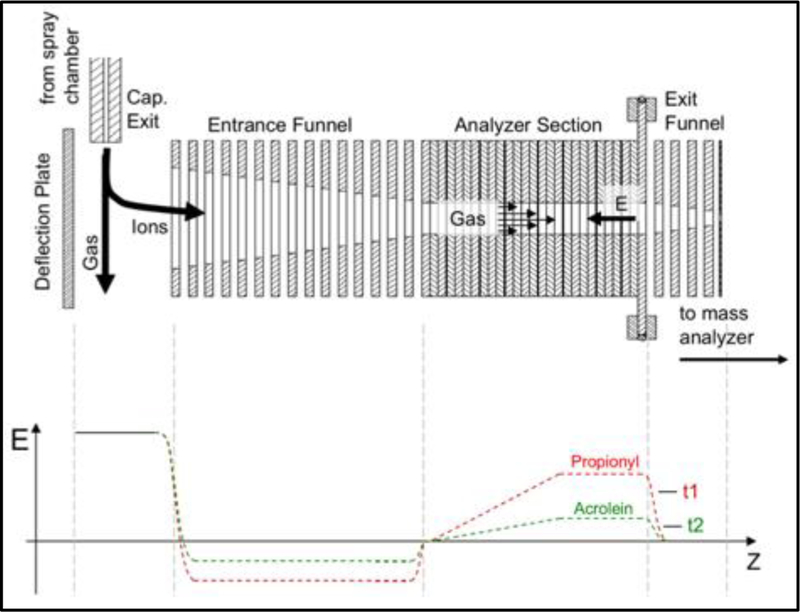
A TIMS funnel was incorporated into the first vacuum stage of a prototype ESI-QqTOF (Bruker Daltonics, Billerica, MA) mass spectrometer. Details of the instrumentation can be found in the literature (Silveira, Ridgeway et al. 2014, Michelmann, Silveira et al. 2015, Silveira, Michelmann et al. 2016). The TIMS scheme is outlined in Figure 2 and was adapted from our previously published work (Pu, Ridgeway et al. 2016). Briefly, ions were produced by electrospray ionization (ESI) at atmospheric pressure. Ions entrained in nitrogen gas pass through a glass capillary, positioned orthogonal to the TIMS separation axis, into the first pumping region of the instrument.
Figure 2.

Scheme demonstrating the basic design flow of a TIMS funnel (top) and the application of TIMS technology to resolve a peptide modified by two isobaric PTMs (bot-tom). The application of TIMS separation to co-eluting pep-tides, or modified peptides, would enable the identification of each peptide species when compared with a standard. For example, a peptide modified by lysine-propionyl (t1) or lysine-acrolein (t2) could potentially be resolved.
The TIMS analyzer is comprised of three regions: the entrance ion funnel, tunnel, and exit ion funnel. Ions are deflected from the gas stream and into the entrance funnel by applying a repulsive potential to a deflection plate. The entrance funnel collects the ions and transfers them to the tunnel. To conduct a mobility analysis, the electric fields in the tunnel are set to trap the ions. Alternatively, if no mobility analysis is desired, the tunnel potentials are set to simply transmit the ions. In each case, either with or without mobility analysis, the ions are eventually collected in the exit funnel and transmitted to downstream optics and mass spectrometer.
The mobility analysis sequence includes an “accumulation step” wherein ions from the source are stored in the tunnel and an “elution step” wherein stored ions are sequentially released according to their mobility. During the accumulation step, the potential on the deflection plate is set such that ions are transmitted into the entrance funnel, and subsequently, the tunnel. During the elution step, the potential on the deflection plate is set to prevent additional ions from entering the tunnel while stored ions are eluted to mass spectrometer.
Sequential elution occurs as the magnitude of an electric field gradient (EFG) is decreased over time, thus releasing ions of progressively higher mobility for MS or MS/MS analysis. Experimental conditions that increase the work done on the ions (including analyses that reduce the EFG scan rate, β) have been shown to result in higher resolving power, R: (Michelmann, Silveira et al. 2015, Silveira, Michelmann et al. 2016)
| [1] |
where vg is the velocity of the gas acting on the ions, Lp is the length of the plateau in the EFG profile, K is the ion mobility coefficient, q is the ion charge, kb is Boltzmann’s constant, and T is the temperature. Under typical TIMS operating conditions, eq. [1] can be rearranged to an expression having the same form as the resolving power expression for drift tube IMS:
| [2] |
where Ee is the electric field on the plateau at the time of elution.
Custom software, written in C, was used for communication with a DAQ (6289, National Instruments) that controls the voltage output of the TIMS power supplies. The electric field, Ee, at the time of ion elution is proportional to the potential applied across the TIMS tunnel, V, at that time. This potential, V, is scanned down from an initial maximum, V0, at a constant rate, δ:
| [3] |
As discussed previously (Michelmann, Silveira et al. 2015), reducing the scan rate, δ, results in increased mobility resolution. In the present work, scan rates as low as 41.4 V/s were used to obtain resolutions needed to separate the acrolein and propionyl peptide isomers.
Results and discussion
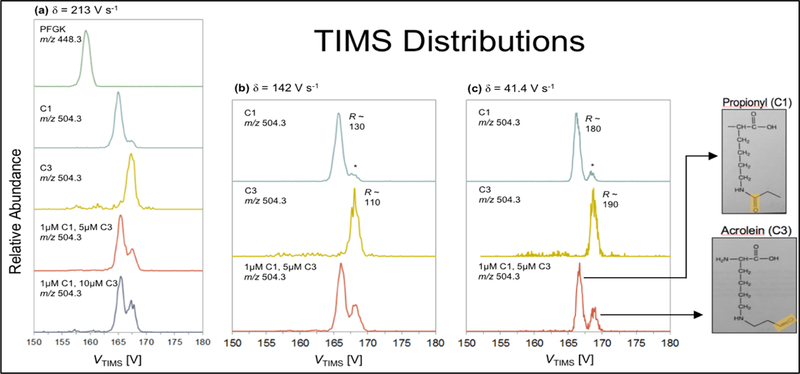
For this study, a target synthetic peptide (PFGK) containing one lysine residue was used to demonstrate the ion mobility analysis of isobaric PTMs, comparing lysine-propionyl and lysine-acrolein modifications. Initial analysis by HPLC-MS/MS determined that chromatography alone could not reliably separate a mixture of these two modified peptides. Aside from being isobaric PTMs, the length and composition of a given peptide may significantly alter chromatographic retention characteristics. Due to these characteristics, a short peptide was utilized for our direct-injection TIMS analysis. A key aspect of utilizing TIMS for the separation of isobaric peptides is the ability to tune the voltage scan rate to increase resolution. The TIMS mobility spectra of the control and modified peptides are presented in Figure 3. Figure 3a shows the fastest scan rate and lowest resolution results, whereas Figures 3b and 3c present results with successively slower scan rates and higher resolution. It’s interesting to note that in the upper three mobility spectra of Figure 3a, we see that even at fast scan rates (δ=213 V/s) the control (top) is readily distinguished from the modified peptides (below). The bottom spectra in Figures 3a-c are of the mixture of the two modified peptides. Clearly, as the scan rate is reduced and the mobility resolution increases, the separation between the two species increases. In the highest resolution scan (Figure 3c, bottom), the modified peptides, C1 and C3, are baseline separated from one another.
Figure 3.

Mass-selected TIMS distributions of PFGK(control), PFGK-C1 (propionyl), and PFGK-C3 (acrolein). TIMS utilizes an axial voltage component to trap ions along the rising edge of the electric field gradient against a flow of neutral gas that pushes ions toward the exit. When the magnitude of the electric field gradient is decreased during a scan, ions elute according to their mobility (K). Resolving power (R) is dependent upon user-defined parameters, including the voltage scan rate (δ). As demon-strated in (a), (b), and (c) above, R increases as δ decreases. In (c), major peaks corresponding to C1 and C3 are nearly baseline resolved at δ = 41.4 V s-1. Importantly, the TIMS voltage (VTIMS) is inversely proportional to K. The C3 species is observed at a greater elution voltage and therefore has a smaller K value (larger collision cross section) relative to the C1 species.
To fully appreciate this result, it’s important to recognize that the isobaric modifications on our peptide only differ in placement of the carbonyl group. The propionyl modification maintains the carbonyl at C1, while acrolein contains the carbonyl on C3 of the modification backbone. Importantly, due to the small structural difference in the modification, the distinction in mobility for the C1 and C3 species is only 1%. Thus, the resolution achieved in this TIMS analysis (R~170) is essential.
Interestingly, the high-resolving power of TIMS revealed the presence of a C3-type structure in the C1 sample (Figure 3b and 3c, labeled with a *). On the basis of its mobility, the peak labeled * in the C1 TIMS distribution (Figure 3) is consistent with the C3 structural isomer. Due to the nature of propionic anhydride treatment, it is likely that another adduct species exists and shares a similar conformation to the C3 (acrolein) adduct, thus one cannot rule out the possibility that the C1 species adopts a second conformation (having low relative abundance) with a mobility constant matching the C3 species. Importantly, the C3 species shows no evidence for the presence of the C1 structural isomer. Therefore, it is unlikely that the peak labeled * resulted from cross-contamination during sample analysis.
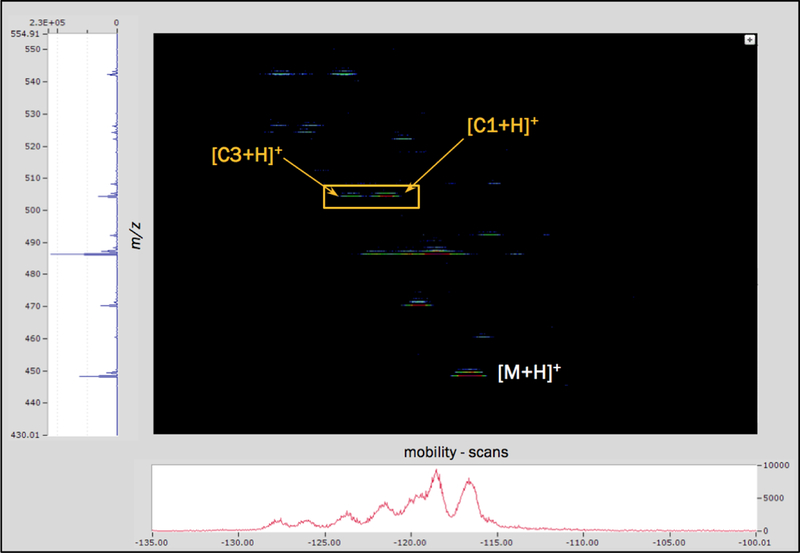
Mass spectrometry analysis without TIMS was utilized to confirm the identity of the control and each modified peptide prior to the TIMS analysis shown in Figure 4. The mass spectrum on the left-hand side of Figure 4 shows the control peptide at 448.26 m/z and the two modified peptide species with a shift of +56.03 Da. The mobility scan for this mixture of peptides is at the bottom of Figure 4. Here, the ion mobility shift from the control is compared to, and between, the two modified peptides. TIMS was able to resolve not only the control from the modified peptides, but also the relatively slight difference in spatial orientation between the two modifications. The results of Figure 4 also suggest that the propionyl-Lys modification is more abundant than the acrolein-Lys adduct – i.e. the C1 peak is more intense than the C3 peak. This is consistent with the fact that acrolein generates many different adduct species (Maeshima, Honda et al. 2012) whereas the propionylation reaction produces relatively much fewer adduct species. In aggregate, these data demonstrate that TIMS can be used to resolve isobaric modifications such as lysine acylation PTMs that otherwise are poorly separated by LC-MS.
Figure 4.

Heat map resulting from the TIMS-MS analysis of control (PFGK, [M+H]+), C1 (propionyl modified), and C3 (acrolein modified) peptide mixture. The heat map displays m/z, in Da, on the y-axis and mobility on the x-axis. The mass spectrum to the left of the heat map is the sum of all ions over the displayed mobility range and the mobility spectrum just below the heat map is the sum of all ions in the heat map over the displayed mass range. The heat map demonstrates the resolution of all 3 peptides in a single TIMS-MS analysis.
Conclusions
The data presented here demonstrates that TIMS provides advantages by adding another dimension of analysis to the study of protein modifications. As demonstrated, TIMS allows for the separation of complex acyl-lysine PTMs that are structural isomers. Specifically, the PTM products of the peptide PFGK were analyzed using a prototype TIMS – time-of-flight mass spectrometer (TIMS-TOF). In that the mobilities of these propionylated and acroleinated peptides differ by only 1%, a high-resolution mobility analysis is required to resolve the two. We were able to achieve more than sufficient resolution in the TIMS analyzer (~170), readily separating these isobars, but also unexpectedly revealing that the propionylated sample may include a small amount of a side reaction product. Future studies examining the application of TIMS to isobaric PTMs should account for variance in peptide size, charge-state, ionization capacity, and chromatographic retention. Additional consideration should be given to the location of such modification, whether it be internal or terminal, as this would likely alter IMS and collision cross section characteristics.
Acknowledgements
The authors wish to thank Joshua Silveira for technical support and thoughtful discussion. Molecular modeling was performed in collaboration with Dr. Don Backos in Computational Chemistry and Biology Core Facility (NIH/NCATS CCTSI UL1TR001082). Studies were supported, in part, by 1R01AA022146-04 (KSF).
Footnotes
The authors declare no competing financial interests.
References
- Baker ES, Liu T, Petyuk VA, Burnum-Johnson KE, Ibrahim YM, Anderson GA and Smith RD (2012). “Mass spectrometry for translational proteomics: progress and clinical implications.” Genome Med 4(8): 63. [DOI] [PMC free article] [PubMed] [Google Scholar]
- Cai J, Bhatnagar A and Pierce WM Jr. (2009). “Protein modification by acrolein: formation and stability of cysteine adducts.” Chem Res Toxicol 22(4): 708–716. [DOI] [PMC free article] [PubMed] [Google Scholar]
- Choudhary C, Weinert BT, Nishida Y, Verdin E and Mann M (2014). “The growing landscape of lysine acetylation links metabolism and cell signalling.” Nat Rev Mol Cell Biol 15(8): 536–550. [DOI] [PubMed] [Google Scholar]
- Ebhardt HA, Root A, Sander C and Aebersold R (2015). “Applications of targeted proteomics in systems biology and translational medicine.” Proteomics 15(18): 3193–3208. [DOI] [PMC free article] [PubMed] [Google Scholar]
- Esterbauer H (1993). “Cytotoxicity and genotoxicity of lipid-oxidation products.” American Journal of Clinical Nutrition 57(5 Suppl): 779S–785S; discussion 785S-786S. [DOI] [PubMed] [Google Scholar]
- Fritz KS, Kellersberger KA, Gomez JD and Petersen DR (2012). “4-HNE adduct stability characterized by collision-induced dissociation and electron transfer dissociation mass spectrometry.” Chem Res Toxicol 25(4): 965–970. [DOI] [PMC free article] [PubMed] [Google Scholar]
- Fritz KS and Petersen DR (2013). “An overview of the chemistry and biology of reactive aldehydes.” Free Radic Biol Med 59: 85–91. [DOI] [PMC free article] [PubMed] [Google Scholar]
- Gajadhar AS and White FM (2014). “System level dynamics of post-translational modifications.” Curr Opin Biotechnol 28: 83–87. [DOI] [PMC free article] [PubMed] [Google Scholar]
- Khoury GA, Baliban RC and Floudas CA (2011). “Proteome-wide post-translational modification statistics: frequency analysis and curation of the swiss-prot database.” Sci Rep 1. [DOI] [PMC free article] [PubMed] [Google Scholar]
- Lin H, Su X and He B (2012). “Protein lysine acylation and cysteine succination by intermediates of energy metabolism.” ACS Chem Biol 7(6): 947–960. [DOI] [PMC free article] [PubMed] [Google Scholar]
- LoPachin RM and Gavin T (2014). “Molecular mechanisms of aldehyde toxicity: a chemical perspective.” Chem Res Toxicol 27(7): 1081–1091. [DOI] [PMC free article] [PubMed] [Google Scholar]
- Maeshima T, Honda K, Chikazawa M, Shibata T, Kawai Y, Akagawa M and Uchida K (2012). “Quantitative analysis of acrolein-specific adducts generated during lipid peroxidation-modification of proteins in vitro: identification of N(tau)-(3-propanal)histidine as the major adduct.” Chem Res Toxicol 25(7): 1384–1392. [DOI] [PubMed] [Google Scholar]
- Michelmann K, Silveira JA, Ridgeway ME and Park MA (2015). “Fundamentals of trapped ion mobility spectrometry.” J Am Soc Mass Spectrom 26(1): 14–24. [DOI] [PubMed] [Google Scholar]
- Papanicolaou KN, O’Rourke B and Foster DB (2014). “Metabolism leaves its mark on the powerhouse: recent progress in post-translational modifications of lysine in mitochondria.” Front Physiol 5: 301. [DOI] [PMC free article] [PubMed] [Google Scholar]
- Pu Y, Ridgeway ME, Glaskin RS, Park MA, Costello CE and Lin C (2016). “Separation and Identification of Isomeric Glycans by Selected Accumulation-Trapped Ion Mobility Spectrometry-Electron Activated Dissociation Tandem Mass Spectrometry.” Anal Chem 88(7): 3440–3443. [DOI] [PMC free article] [PubMed] [Google Scholar]
- Silveira JA, Michelmann K, Ridgeway ME and Park MA (2016). “Fundamentals of Trapped Ion Mobility Spectrometry Part II: Fluid Dynamics.” J Am Soc Mass Spectrom 27(4): 585–595. [DOI] [PubMed] [Google Scholar]
- Silveira JA, Ridgeway ME and Park MA (2014). “High resolution trapped ion mobility spectrometery of peptides.” Anal Chem 86(12): 5624–5627. [DOI] [PubMed] [Google Scholar]
- Wang H, Shi T, Qian WJ, Liu T, Kagan J, Srivastava S, Smith RD, Rodland KD and Camp DG 2nd (2016). “The clinical impact of recent advances in LC-MS for cancer biomarker discovery and verification.” Expert Rev Proteomics 13(1): 99–114. [DOI] [PMC free article] [PubMed] [Google Scholar]
- Xu G, Paige JS and Jaffrey SR (2010). “Global analysis of lysine ubiquitination by ubiquitin remnant immunoaffinity profiling.” Nat Biotechnol 28(8): 868–873. [DOI] [PMC free article] [PubMed] [Google Scholar]
- Zee BM and Garcia BA (2012). “Discovery of lysine post-translational modifications through mass spectrometric detection.” Essays Biochem 52: 147–163. [DOI] [PMC free article] [PubMed] [Google Scholar]


