Abstract
Dendritic cells (DC) are critical initiators of innate immunity in the kidney and orchestrate inflammation following ischemia-reperfusion injury. The role of the mammalian/mechanistic target of rapamycin (mTOR) in the pathophysiology of renal ischemia-reperfusion injury has been characterized. However, the influence of DC-based alterations in mTOR signaling is unknown. To address this, bone marrow-derived mTORC2-deficient (Rictor−/−) DC underwent hypoxia-reoxygenation and then analysis by flow cytometry. Adoptive transfer of wild-type or Rictor−/− DC to C57BL/6 mice followed by unilateral or bilateral renal ischemia-reperfusion injury (20 min ischemia) was used to assess their in vivo migratory capacity and influence on tissue injury. Age-matched, male DC-specific Rictor−/− mice or littermate controls underwent bilateral renal ischemia-reperfusion, followed by assessment of renal function, histopathology, bio-molecular and cell infiltration analysis. Rictor−/− DC expressed more co-stimulatory CD80/CD86 but less co-inhibitory programmed death ligand-1 (PDL1), a pattern that was enhanced by hypoxia-reoxygenation. They also demonstrated enhanced migration to the injured kidney and induced greater tissue damage. Following ischemia-reperfusion, Rictor−/− DC mice developed higher serum creatinine levels, more severe histologic damage and greater pro-inflammatory cytokine production compared to littermate controls. Additionally, a greater influx of both neutrophils and T cells was seen in Rictor−/− DC mice, along with CD11c+MHCII+CD11bhiF4/80+ renal DC, that expressed more CD86, but less PDL1. Thus, DC-targeted elimination of Rictor enhances inflammation and migratory responses to the injured kidney, highlighting the regulatory roles of both DC and Rictor in the pathophysiology of acute kidney injury.
Keywords: Rictor, dendritic cells, kidney ischemia-reperfusion injury
INTRODUCTION
Dendritic cells (DC) are bone marrow (BM)-derived antigen-presenting cells crucial to the induction and regulation of innate and adaptive immunity. In addition to residing within the renal interstitium as part of the heterogeneous mononuclear phagocyte system,1 they are an abundant component of the inflammatory cell infiltrate that appears in response to acute kidney injury (AKI).2, 3 DC can play disparate roles in the pathogenesis of AKI, since their depletion has been found to be protective,3 deleterious,4 or of no benefit5 in mouse models of ischemia-reperfusion injury (IRI). However, few studies have investigated specific signal transduction mechanisms underlying renal DC function and how these may affect the manifestation of AKI.
The mammalian/mechanistic target of rapamycin (mTOR) is a serine-threonine kinase comprising two distinct complexes. mTOR complex (C) 1, composed of mTOR, Raptor (regulatory-associated protein of mTOR), DEPTOR (DEP domain-containing mTOR-interacting protein) and G-protein β subunit like (GβL protein), is primarily responsible for regulating cell growth and metabolism in response to nutritional cues and environmental stressors.6, 7 The second complex, mTORC2, is composed of mTOR, Rictor (rapamycin-insensitive companion of mTOR), GβL, Sin-1, PRR5/Protor-1 and DEPTOR and regulates cell survival and cytoskeletal function.8 mTOR plays a crucial role in the development and function of immune cell populations.9, 10 It regulates DC maturation and mobilization in vivo,11 thymic development of natural killer/T cells,12 T cell polarization,13, 14 T follicular helper cell expansion,15 and B cell homeostasis and antibody class switching.16 Many of these functions have been elucidated experimentally through the use of rapamycin, the archetypical selective mTORC1 inhibitor.17 Thus, the role of mTORC2 in these events, particularly in relation to DC function, is not well-defined.
Recently, mTORC2 has been ascribed a role in the regulation of DC-based inflammatory responses. Thus, lipopolysaccharide (LPS)-based stimulation of Rictor-deficient murine DC results in a hyper-inflammatory phenotype by limiting Akt signaling.18 Further, we have reported that mTORC2-deficient DC demonstrate enhanced inflammatory and Th1- and Th17-polarizing capacity following Toll-like receptor (TLR) 4 (but not TLR2) ligation.19 However, the role of mTORC2 signaling in DC in AKI has not been studied.
In this study, we show that Rictor (mTORC2)-deficient DC up-regulate markers of maturation in response to a hypoxic/ischemic injury stimulus, both in vivo and in vitro, and exhibit enhanced migration to injured kidneys. We also provide evidence that Rictor-deficient DC exacerbate AKI by promoting immune cell infiltration and pro-inflammatory cytokine production. These findings demonstrate a novel role for DC-based mTORC2 function in promoting AKI and enhance our understanding of the role of DC in regulation of renal injury.
RESULTS
Raptor and Rictor signaling are altered in AKI
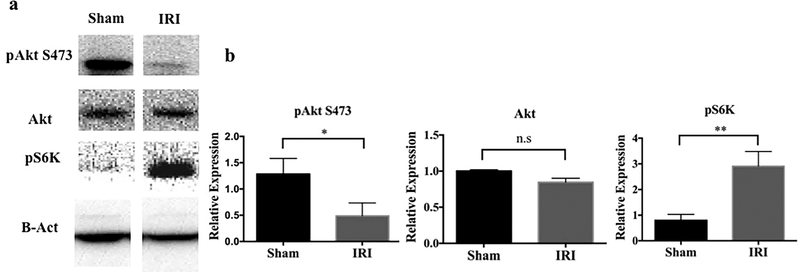
To ascertain the role of mTOR in AKI, we initially evaluated activation of the mTORC1/2 pathway in sham-operated and post-IRI C57BL/6 (B6) mice. Interestingly, protein expression of the mTORC1 downstream marker pS6K was upregulated in whole kidney tissue in response to AKI. Conversely, expression of pAkt, the mTORC2 downstream marker was decreased, although total Akt remained unchanged (Figure 1). This suggested that the mTOR1 and 2 signaling routes were differentially regulated in AKI.
Figure 1|. Signaling downstream of mTORC2 is inhibited while mTORC1 signaling is augmented after kidney IRI.
Kidney lysate was obtained from C57BL/6 mice 24 hr after IRI or sham operation. (a) Representative Western blots of phosphorylated (p) Akt S473, total Akt and pS6K protein are shown. (b) Expression of each protein relative to β-actin. n=3–4 mice per group. Results are means +1SD *P < 0.05; **P < 0.01.
Rictor−/− DC display a mature profile and enhanced in vivo migratory capacity in response to AKI
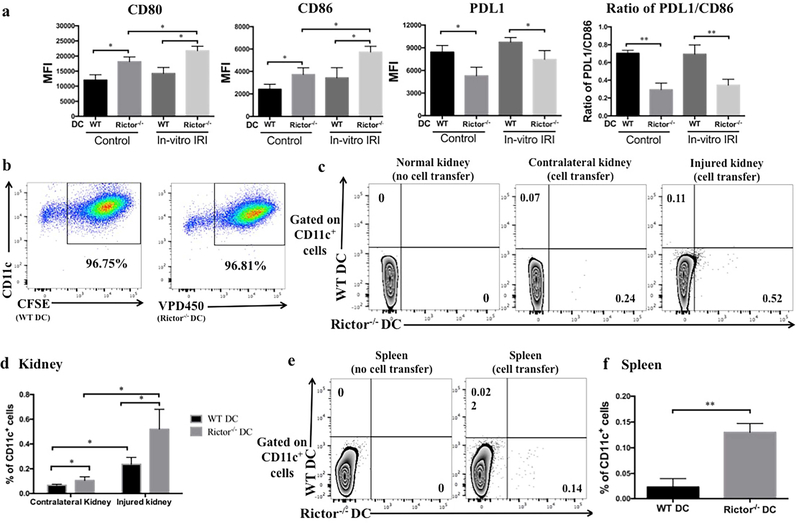
There is evidence that DC are crucial to the pathophysiology of AKI; indeed, systemic ablation of DC can mitigate the manifestation of AKI.3 DC express mTOR and we have shown previously that absence of mTORC2 (Rictor) augments their T cell stimulatory capacity.19 Therefore, we assessed the response of Rictor-deficient DC to non-antigenic stimuli, as would occur in AKI. We evaluated the influence of Rictor deficiency on DC maturation following in vitro hypoxia-reoxygenation,20 used to mimic IRI. Compared to wild-type (WT) DC, Rictor−/− DC demonstrated increased costimulatory CD80 and CD86, but decreased co-inhibitory programmed death ligand 1 (PDL1) expression and thus a reduced PDL1/CD86 ratio, both at baseline and following hypoxia-reoxygenation (Figure 2a).
Figure 2|. Rictor−/− DC display an enhanced maturation profile and migration to acutely-injured kidneys and spleen.
(a) Bone marrow-derived CD11c+ DC from WT or Rictor−/− mice were exposed to in vitro IRI conditions, and cell surface markers then assessed by flow cytometry. Data shown are mean MFI + 1SD; n=3–4 mice per group. *P < 0.05. (b) BMDC from WT or Rictor−/− DC mice were labeled with CFSE or VPD450 respectively, before their adoptive transfer. Labeled cells (5×10⁶) were injected together intravenously into male B6 mice followed by 20 min unilateral kidney IRI. After 24 hr reperfusion, kidneys were harvested and analyzed by flow cytometry. (c) Representative plots showing the percentage of WT DC (CD11c+CFSE+) and Rictor−/− DC (CD11c+VPD450+) in native kidney. (d) The percentage of adoptively-transferred WT or Rictor−/− CD11c+ DC detected in each kidney was compared. (e) Representative plots showing the percentage of WT DC (CD11c+CFSE+) and Rictor−/− DC (CD11c+VPD450+) in the spleens of mice receiving either no cells or cell transfer. (f) Incidence of transferred WT or Rictor−/− CD11c+ DC in the spleen. Data shown are means +1SD; n=3–4 mice per group. *P < 0.05; **P<0.01.
We then investigated DC migratory capacity to injured tissue, using an established model of renal IRI (20 min ischemia and 24 hr reperfusion), as described.21 We labeled WT DC with CFSE and Rictor−/− DC with VPD450 (Figure 2b) and adoptively transferred them to WT B6 recipients. Twenty-four hr after unilateral kidney IRI, we harvested the injured and contralateral uninjured kidneys to track the transferred cells using flow cytometry. Compared to WT DC, a significantly greater number of Rictor−/− DC had migrated to both the injured and (to a lesser degree) the uninjured kidney (p< 0.05; Figure 2c and d). We also found significantly more Rictor−/− DC than WT DC in the spleen (Figure 2e and f).
Rictor−/− DC exacerbate susceptibility to AKI
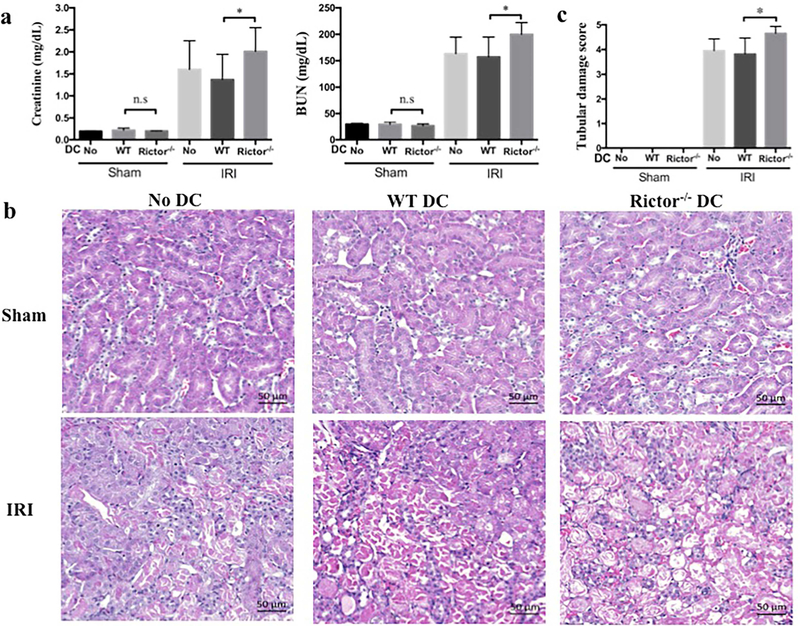
Activation of pro-inflammatory pathways contributes significantly to the pathophysiology of AKI, and Rictor−/− DC demonstrate a pro-inflammatory phenotype.19 We hypothesized that absence of Rictor signaling in DC would promote tissue injury following AKI and to investigate this question we performed two linked experiments. First, we generated CD11c+ BMDC from WT or Rictor−/− mice and adoptively transferred the cells to (syngeneic) B6 mice, 1 day before bilateral IRI. Kidneys were harvested for analysis 24 hr after injury. Adoptive transfer of DC (WT or Rictor−/−) did not change baseline (sham-operated) renal function. Injured B6 mice with or without WT DC demonstrated a robust rise in serum creatinine and blood urea nitrogen (BUN) that was exacerbated significantly in mice given Rictor−/− DC (Figure 3a). This deterioration in renal function was reflected in increased histological damage (Figure 3b and c).
Figure 3|. Adoptively-transferred Rictor−/− DC promote acute kidney injury.
Bone marrow-derived CD11c+ DC from WT or Rictor−/− mice were adoptively transferred (5 × 10⁶) intravenously into C57BL/6 mice 24 hr before bilateral renal IRI. After 24 h reperfusion, serum and kidneys were harvested and results compared to sham-operated mice and C57BL/6 mice not injected with cells. (a) Serum creatinine and blood urea nitrogen (BUN) levels from all mice. (b) Representative appearances and (c) semi-quantitative analysis of hematoxylin and eosin-stained kidney sections from sham-operated and post-IRI mice. Scale bars in (b) represent 50 m. Data shown are means +1SD; n=5–9 mice per group. *P < 0.05.
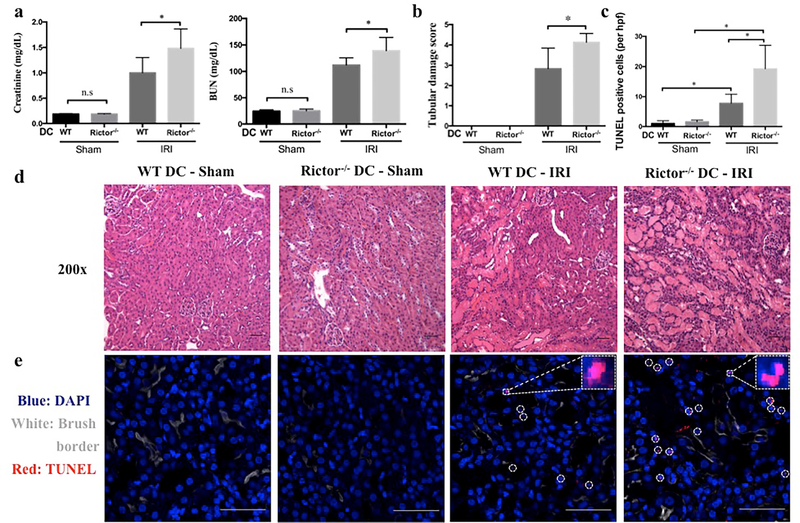
Second, using a standardized model of bilateral renal IRI as described,21 we observed greater renal functional impairment in Rictor−/− DC mice compared to littermate controls (Figure 4a). The degree of tissue injury was determined by evaluation of renal histology as described.21 Histologic examination of WT control mice showed typical features of IRI, characterized by tubular epithelial cell necrosis and nuclear loss, tubular dilatation and cast formation localized to the corticomedullary segments (Figure 4b–e). These findings were more severe in Rictor−/− DC mice, and extended through to the cortex and medulla (Figure 4d). We assessed tubular cell death by terminal deoxynucleotidyl transferase-mediated digoxigenin-deoxyuridine nick-end labeling (TUNEL) staining. Compared with WT DC mice, Rictor−/− DC mice showed greater renal tubular epithelial cell death post-AKI (Figure 4c and e). Interestingly, Raptor (mTORC1)−/− DC mice demonstrated no significant difference in the manifestation of AKI compared to littermate controls (Supplementary Figure S1).
Figure 4|. Rictor deficiency in CD11c+ DC worsens acute kidney injury.
Age-matched male CD11cCre−/−Rictorf/f (WT DC) or CD11cCre+/+Rictorf/f (Rictor−/− DC) mice were challenged with sham operation or 20 min of bilateral renal ischemia and 24 hr reperfusion (n=3–10 mice per group). (a) Serum creatinine and BUN levels. (b-e) Representative appearances and quantitative analyses of hematoxylin and eosin- and TUNEL-stained kidney sections of WT DC mice and Rictor−/− DC mice following IRI. TUNEL staining (TUNEL+ cells are indicated by circles in e) was visualized using confocal microscopy and TUNEL+ (dead) cells/hpf counted in 4 successive fields of WT DC and Rictor−/− DC mice. Insets show higher power views of TUNEL+ cells. Images (d and e) are shown as 200 × original magnifications. Scale bars in (d) represent 50 m and scale bars in (e) represent 100 m. All data are presented as means +1SD; *P < 0.05.
Rictor−/− DC show increased pro-inflammatory cytokine expression after AKI
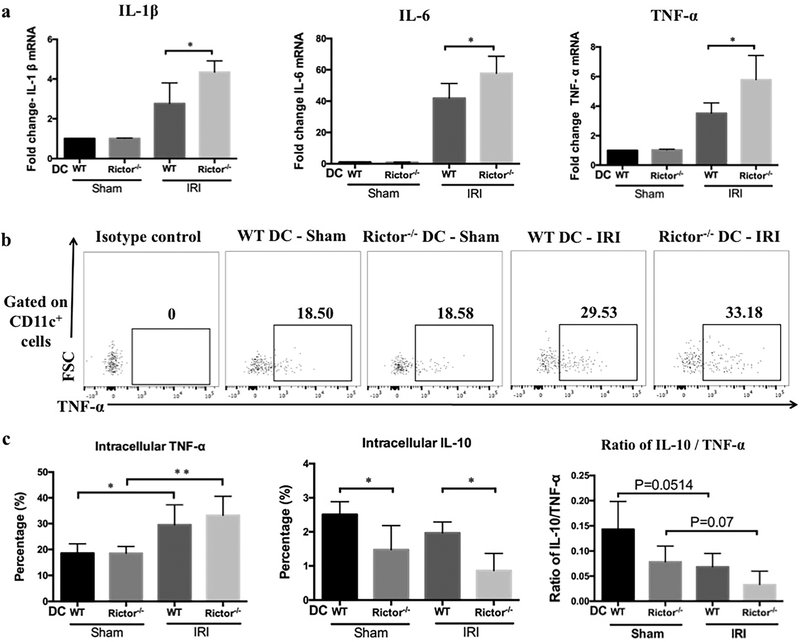
We investigated whether DC-based Rictor deficiency also influenced the expression of cytokines critical to the inflammatory response in AKI. mRNA transcripts of IL-1β, IL-6 and TNF-α were examined in kidneys from WT DC and Rictor−/− DC mice after sham operation or IRI (Figure 5a). Compared with the WT DC IRI group, pro-inflammatory cytokine expression was uniformly increased in Rictor−/− DC mice.
Figure 5|. Pro-inflammatory cytokine mRNA profiles are enhanced and DC intracellular cytokines differentially affected in kidneys of Rictor−/− DC mice after renal IRI.
(a) Renal pro-inflammatory cytokine (IL-1β, IL-6 and TNF-α) mRNA relative expression by WT or Rictor−/− DC mice subjected to renal IRI. Results were normalized to the housekeeping gene GAPDH and WT-DC sham-operated animals used as the referent control. Data shown are means + 1SD; n=3–4 mice per group. *P < 0.05. Twenty-four hr after IRI or sham operation, CD11c+ cells were isolated from kidneys and stained for both cell surface and intracellular cytokines. (b) Representative plots showing DC intracellular cytokine (TNF-α) staining by flow cytometry. (c) Percentages of CD11c+ cells producing TNF-α and IL-10 and the ratio of IL-10/TNF-α in the different groups (n=3–4 mice per group). Data are presented as means +1SD; *P < 0.05; **P < 0.01.
Subsequently, we determined whether the enhanced pro-inflammatory cytokine profiles were evident in renal DC. Twenty-four hours after sham-operation or IRI, the cellular infiltrates from kidneys were stained for both surface and intracellular markers and then analyzed by flow cytometry (Figure 5b). After IRI challenge, Rictor−/− DC showed a trend towards increased TNF-α production, but significantly reduced IL-10 compared to WT DC (Figure 5c). The ratio of IL-10/TNF-α was also lower in Rictor−/− DC mice after IRI compared with WT DC (Figure 5c).
Influx of inflammatory cells is altered in Rictor−/− DC mice following AKI
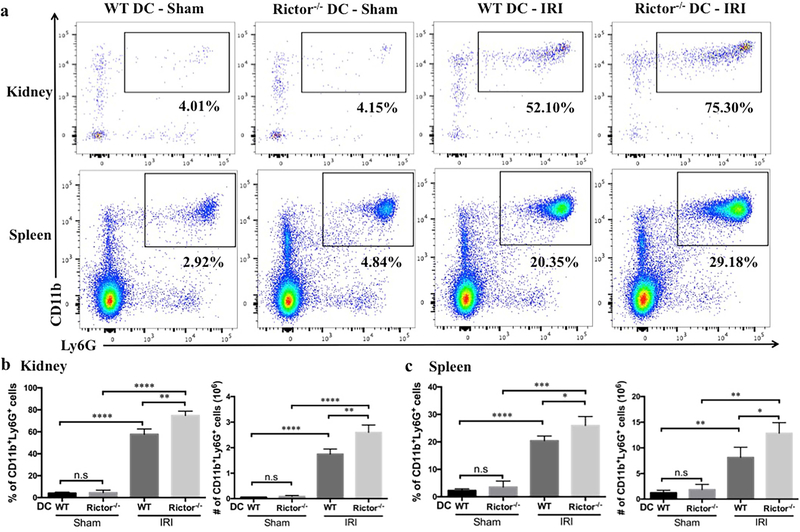
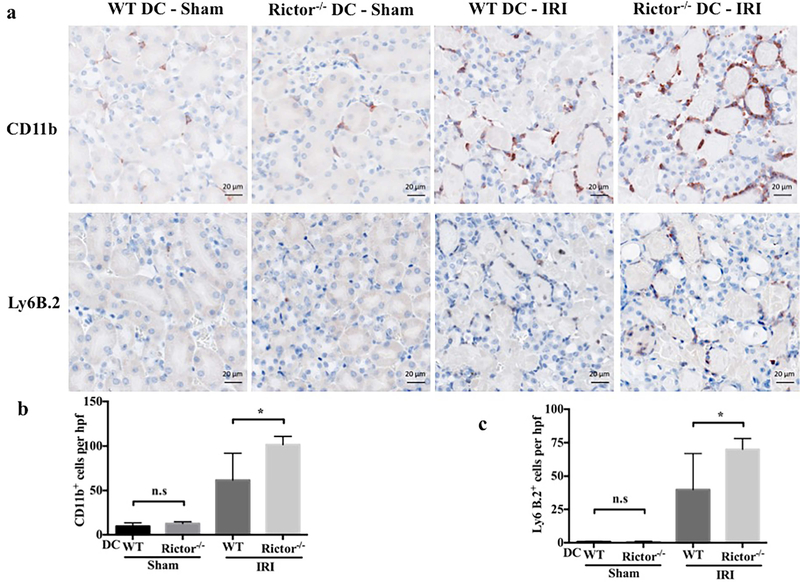
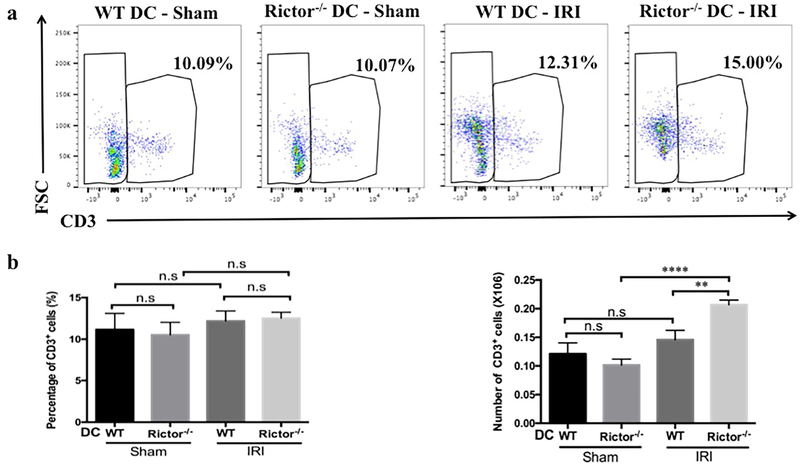
Influx of inflammatory/immune cells into the kidney is a fundamental component of both the response to, and the pathophysiology of AKI. Neutrophils and T cells comprise the predominant components of the early cellular infiltrate. Kidney- and spleen-infiltrating inflammatory cells in sham-operated and post-IRI mice were analyzed by flow cytometry and immunohistochemistry (Figures 6–9). No significant difference in CD45+CD11b+Ly6G+ neutrophils was seen between sham groups, however the percentage and absolute number of neutrophils were increased significantly in Rictor−/− DC kidneys following IRI, compared with the WT DC group (Figure 6a and b). This was confirmed by immunohistochemical staining of kidney sections that showed a robust increase in CD11b+ and Ly6B.2+ cells in WT DC mice subjected to bilateral IRI (compared to sham operation), that was amplified in Rictor−/− DC mice (Figure 7). A significant increase in infiltrating T cell numbers was also found in injured kidneys in the Rictor−/− DC IRI group (Figure 8a and b).
Figure 6|. Neutrophil infiltration is augmented in Rictor−/− DC mice following renal IRI.
Kidneys and spleens from sham-operated and post-IRI WT and Rictor−/− DC mice were digested and flow cytometric analysis of infiltrating CD45+ cell populations performed. (a) Representative plots of renal and splenic CD11b+Ly6G+ neutrophils are shown. (b) and (c) Absolute numbers and percentages of kidney and splenic neutrophils gated from the CD45+ NK1.1−CD3−B220−population were determined. Data are means +1SD from n=3–4 mice/ per group; *P < 0.05; **P < 0.01; ***P < 0.001; ****P < 0.0001. n.s, not significant.
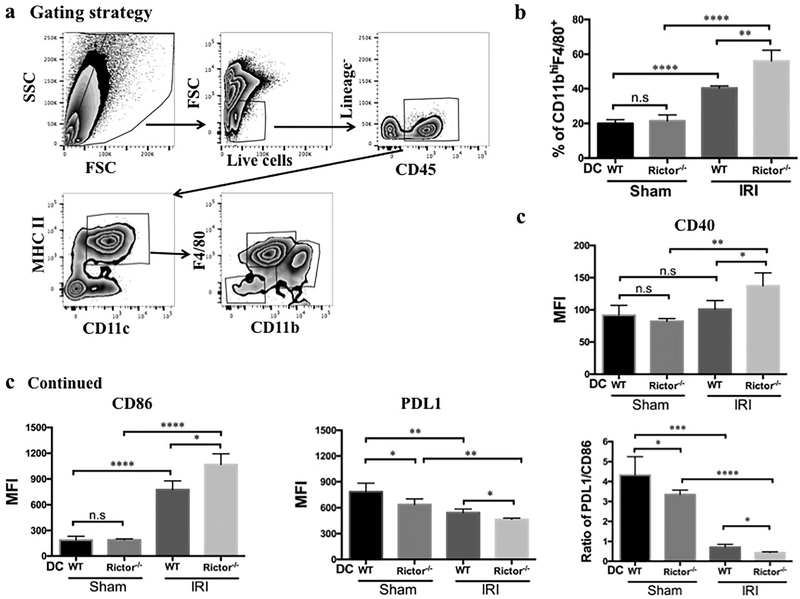
Figure 9|. CD11c+MHCII+CD11bhiF4/80+ renal DC are selectively increased and exhibit enhanced maturity following renal IRI.
Flow cytometric analysis of the CD11c+MHCII+CD11bhiF480+ DC subset after isolation of CD45+ leukocytes from sham-operated and IRI WT and Rictor−/− DC kidneys. (a) Representative plots depict gating strategy (live cells, lineage−: NK1.1−, CD3−, B220− and CD45+) followed by DC subset analysis. (b) The percentage of CD11bhiF4/80+ DC in CD11c+MHCII+ cells in the kidney was calculated. (c, d) CD11c+MHCII+CD11bhiF4/80+ renal DC were analyzed for CD40, CD86 and PDL1 expression by flow cytometry and the ratio of PDL1/CD86 also determined. Data shown are means +1SD; n=3–4 mice per group. *P < 0.05, **P < 0.01, ***P < 0.001, ****P < 0.0001. n.s, not significant
Figure 7|. Inflammatory cell infiltration is enhanced significantly in Rictor−/− DC kidneys following renal IRI.
Kidney sections from sham-operated and post-IRI WT and Rictor−/− DC mice were stained by immunohistochemistry for CD11b and Ly6B.2. (a) Representative micrographs and (b) quantitative analysis of cells/hpf are shown. Images are 400× magnification; scale bars represent 20 m. Data are means +1SD from n=4–6 mice/ per group; *P < 0.05; ns = not significant.
Figure 8|. T cell infiltration is augmented in Rictor−/− DC kidneys but not spleens following renal IRI.
Kidneys and spleens from sham-operated and post-IRI WT and Rictor−/− DC mice were digested and flow cytometric analysis of infiltrating T cells performed. (a) Representative plots of renal and splenic CD3+ T cells analyzed by flow cytometry. (b) and (c) Absolute numbers and percentages of renal and splenic T cells gated from the CD45+NK1.1− population. Data are means +1SD from n=3–4 mice/ per group; **P < 0.01; ****P < 0.0001; n.s, no significant.
IRI initiates a systemic inflammatory response that is evident in extra-renal organs.22 This is characterized by elaboration of chemokines and cytokines and by the release of alarmins and other normally sequestered factors from dying cells. These products alter vascular permeability and modulate leukocyte trafficking. We hypothesized that the inflammatory infiltrate seen in the kidney post-IRI would be reflected in lymphoid organs and therefore assessed splenic cellular infiltrates in WT-DC and Rictor−/− DC mice under sham-operated and post-IRI conditions. Neutrophil percentage and number in spleen were increased significantly following IRI, especially in Rictor−/− DC mice (Figure 6c). Interestingly, however, both the percentage and absolute number of splenic T cells were unchanged between sham-operated and IRI conditions, regardless of genotype (data not shown).
A greater influx of renal DC with an enhanced maturation phenotype is observed in Rictor−/− DC mice following AKI
Finally, we determined the influence of Rictor deficiency in DC on renal DC subsets after kidney IRI (Figure 9a). The incidence of CD11c+MHCII+CD11bhiF4/80+DC was increased significantly in the WT DC-IRI group compared to sham-operated animals, and further augmented in Rictor−/− DC mice (Figure 9b). The MHCII+CD11bhiCD11c+F4/80+ DC subset was further analyzed for markers of maturation. Interestingly, WT-DC mice demonstrated increased CD86 and decreased PDL1 expression in response to IRI; CD40 expression was unchanged (Figure 9c). This effect was exaggerated in Rictor−/− DC animals, in addition to increased CD40 (Figure 9c). Furthermore, the ratio of PDL1/CD86 was lower in Rictor−/− DC mice than in WT DC mice (Figure 9c). These data suggest that maturation of DC in the context of self-antigen and sterile inflammation likely promotes T cell and neutrophil migration to the targeted organ.
DISCUSSION
We and others have recently demonstrated an important role for mTORC2 in DC activation and T cell-polarizing capacity.18, 19, 23 Here, we demonstrate a novel role for DC-based mTORC2 expression in AKI. In this study, we found that DC-specific Rictor deficiency led to higher expression of the co-stimulatory molecules CD80 and CD86, but lower expression of the co-inhibitory molecule PDL1 by CD11c+ DC. We also demonstrated that DC maturation was enhanced following an injury stimulus, both in vitro and in vivo, and was associated with enhanced pro-inflammatory cytokine production. These results are consistent with our previous studies,19 and the work of others showing that absence of Rictor in DC induces a pro-inflammatory phenotype by down-regulating the Akt-FoxO1 signaling pathway.18 Collectively, the data suggest that Rictor has an important influence on DC phenotype, function and their response to exogenous stimuli.
Whether DC administered via the systemic circulation can migrate in significant and sufficient numbers to the kidney to influence AKI is currently inconclusive. Several groups have reported that adoptively-transferred splenic or BM-derived DC can migrate to the kidney,4, 24 and that this migration is CCR5-dependent.24 Others have failed to demonstrate such migration to the kidney.25 Our findings support previous observations that transferred BM-derived DC migrate to the kidneys, albeit in small numbers compared to the number infused, with enhanced migration to injured kidneys compared with contralateral, uninjured kidneys. The proportion of Rictor−/− DC detected in kidneys was significantly greater than WT DC regardless of injury, suggesting that Rictor deficiency in DC enhances their in vivo migratory capacity. Studies have suggested that rapamycin, a well-recognized mTORC1 inhibitor (and, with prolonged exposure, potential mTORC2 inhibitor)26 can enhance the ability of DC to migrate to secondary lymphoid tissues,27,28 but it has also been reported that rapamycin does not affect DC migration.29 Although the influence of mTORC1 on the migration of DC is still disputed, our findings demonstrate, for the first time to our knowledge, that mTORC2 directly affects the ability of DC to migrate to targeted organs.
To ascertain the influence of Rictor deficiency in DC on AKI, we used a standardized model of renal IRI. Compared with the WT DC cohort, Rictor−/− DC mice exhibited higher serum creatinine and BUN levels, accompanied by enhanced renal tubular epithelial cell necrosis and TUNEL positive cells. These data provide strong evidence that Rictor deficiency confined to DC exacerbates AKI. Moreover, compared with WT DC, adoptive transfer of Rictor−/− DC resulted in greater early phase injury in bilateral kidney IRI recipients.
The cascade of infiltrating inflammatory cells following renal IRI is rapid and consists of a broad range of CD45+ cells, although the profile peaks 24 hours post-reperfusion.3, 30 We assessed immune cell infiltration at this time point. In keeping with a pro-inflammatory profile, Rictor−/− DC mice exhibited more neutrophil infiltration post-IRI. Neutrophils are the predominant inflammatory cell population during the early phase of IRI,31–33 that can produce reactive oxygen species, nitrogen substances and also release antimicrobial peptides.34 Studies have confirmed that the clearance of infective pathogen by neutrophils observed in a burn injury model is DC-dependent.34 Whether the increase in neutrophils observed in Rictor−/− DC mice is due to Rictor deficiency in DC requires further investigation.
Neutrophils and DC “crosstalk” through cell contact, as well as through secretion of cytokines and chemokines.35, 36 Interestingly, we found that mRNA levels of inflammatory cytokines including TNF-α, IL-1β and IL-6 were significantly higher in whole kidney homogenates of Rictor−/− DC mice. This was corroborated by intracellular cytokine levels. Resident DC have been reported to be the predominant TNF-α-secreting cell population following renal IRI.37 TNF-α expression was increased in both WT and Rictor−/− DC post-IRI compared to sham-operated animals. We also found that Rictor−/− DC produced less of the anti-inflammatory cytokine IL-10, resulting in diminished IL-10/TNF-α ratios. Polarization of cytokine profiles, particularly IL-10/TNF-α expression, is an indicator of regulatory B cell function in human renal allografts.38 These data also support the concept that a shift in the pro-inflammatory/anti-inflammatory profile, as the result of DC-based deletion of Rictor, contributes to enhanced pathology in AKI.
A further significant finding was the increased incidence of CD11c+MHCII+CD11bhiF4/80+ DC in both WT DC and Rictor−/− DC kidneys after renal IRI, with significantly greater cell infiltration in the latter group. Further analysis of this DC phenotype revealed no difference in co-stimulatory molecule expression (CD86/CD40) between WT DC and Rictor−/− DC sham-operated kidneys. However, expression of these co-stimulatory molecules increased after renal IRI, indicating that sterile injury stimulates renal DC maturation, consistent with previous reports.21, 37, 39, 40 These data support maturation of DC in the context of sterile inflammation attracting neutrophils and T cells specifically to target organs. In addition, CD11c+MHCII+CD11bhiF4/80+ DC expressed lower levels of the co-inhibitory molecule PDL1 in Rictor−/− DC kidneys post-IRI and thus lower PDL1/CD86 ratios, confirming the role of Rictor deficiency in promoting a pro-inflammatory DC phenotype. We41 and others42 have shown previously that a high PDL1/CD86 ratio correlates with impaired DC function and T regulatory cells, although its importance in the absence of antigen remains poorly defined.
As IRI can initiate a systemic inflammatory response that is reflected in extra-renal tissue,22 we hypothesized that inflammatory cell infiltration seen in the kidney post-IRI could also be manifest in secondary lymphoid organs, such as the spleen. Indeed, splenic neutrophil percentage and absolute cell number were increased following IRI, particularly in Rictor−/− DC mice. However, numbers of splenic T cells did not differ significantly between sham-operated and IRI conditions, as well as between WT-DC and Rictor−/− DC mice. These data reinforce the view that inflammatory changes within an acutely-injured organ can be reflected systemically and may contribute to systemic consequences of AKI.
The role of mTOR expression in determining renal physiology and pathophysiological changes is being increasingly explored, although much of our current understanding pertains to podocyte and renal tubular epithelial cell biology.43 Evidence is also accruing for mTOR-based regulation of DC responses and alloimmunity.44 Our data reveal that Rictor-deficient DC exhibit enhanced migratory capacity, pro-inflammatory cytokine production and a maturation profile that is enhanced by sterile injury. This phenotype exacerbated AKI, again emphasizing the impact of DC in driving an innate immune response and contributing to sterile renal injury. Our findings may have significant clinical implications, particularly in the context of the development of dual mTORC1- and 2-inhibiting pharmacotherapeutic agents (TORKinibs) for therapeutic use,45, 46 including transplantation.
MATERIALS AND METHODS
Mice
Male C57BL/6J (B6; H-2b) mice were from The Jackson Laboratory (Bar Harbor, ME). CD11c-specific Rictor−/− mice were generated by crossing floxed Rictor mice (Rictorfl/fl) with CD11c-Cre mice. CD11c-specific Raptor−/− mice were generated by crossing floxed Raptor mice (Raptorfl/fl) with CD11c-Cre mice. Genotype was verified by PCR and wild-type littermates used as controls. The mice (12–16 wk old when studied) were maintained under specific pathogen-free conditions, had access to water and standard rodent chow ad libitum, and were cared for according to methods approved by the American Association for the Accreditation of Laboratory Animal Care. All studies were performed according to an Institutional Animal Care and Use Committee-approved protocol in accordance with National Institutes of Health guidelines.
Generation of bone marrow-derived dendritic cells (BMDC)
DC were generated from freshly-isolated femoral BM cells as described.47 Ten million BM cells were cultured in RPMI-1640 with recombinant mouse granulocyte-macrophage colony-stimulating factor and mouse IL-4 (both 1000 U/ml; R & D Systems, Minneapolis, MN). Fresh GM-CSF and IL-4 were added every 2 days. On day 7, the cells were collected, counted and CD11c+ cells isolated by anti-CD11c immuno-magnetic bead purification (Miltenyi Biotec, Auburn, CA).
Western blots
Immunoblots were performed as described.21, 48 For each sample, 15μg of protein was loaded into the gel (4–20% gradient). Proteins were transferred to a PVDF membrane, which was cut based on ladder position prior to primary antibody (Ab) incubation for detection of multiple targets. Abs against β-actin (clone #4970; 42kDa), Akt (#9272; 60kDa), p-Akt (S473) (#9271; 60kDa) and p70S6K (#9202; 70, 85kDa) were purchased from Cell Signaling Technologies (Danvers, MA) and diluted 1:1000. HRP-conjugated secondary Ab was purchased from Cell Signaling Technologies (#7074S) and diluted 1:2000. Band visualization was achieved with SuperSignal West Pico Substrate (Pierce Chemical, Dallas, TX) and developed using a Protein Simple Fluorchem E system (Biotechne, Minneapolis, MN). The intensity of individual bands was quantified using ImageJ (NIH) relative to the loading control (β-actin) and represented as relative expression compared to sham-operated control mice.
Hypoxia-reoxygenation of DC
To simulate IRI in vivo, BMDC were placed in PBS to mimic nutrient/energy deprivation and cultured in an air-tight chamber (FiO2 1%) at 37°C for 4 hr. Reperfusion was simulated by adding back complete RPMI-1640 medium under normoxia at 37°C for an additional 24 hr, as described.20 BMDC cultured with RPMI under normoxia at 37°C for 28 hr served as control. Cells were then collected for flow cytometry.
Adoptive transfer of DC
BMDC from CD11c-Cre+ Rictorfl/fl mice or CD11c-Cre− Rictorfl/fl mice were labeled with Violet Proliferation Dye 450 (VPD450) (BD Bioscience, Franklin Lakes, NJ) or CFSE (Invitrogen, Waltham, MA), respectively. Briefly, 5–10 ×106 BMDC were suspended in 1 ml of PBS (pre-warmed to room temperature). One μM of CFSE or VPD450 was added and the cells incubated at 37°C for 20 min. The cells were washed with 9× the original volume of PBS, resuspended in fresh PBS (4°C), then counted. Equivalent numbers (5×10⁶) of Rictor−/− DC and WT DC (Rictor+/+DC) were mixed in 200 μl PBS and administered together by intravenous injection into WT B6 mice followed immediately by unilateral renal IRI. Twenty-four hr later, both injured and contralateral kidneys were harvested for analysis. In the case of adoptive transfer of DC into bilateral renal IRI mice, 5×10⁶ of either WT DC or Rictor−/− DC were injected separately into individual WT B6 recipients 24 hours before IRI.
IRI model
Age- matched (12–16 weeks; weight 27–30g) male mice were anesthetized using isoflurane (2% for induction and 1.5% for maintenance) and oxygen titrated to effect with body temperature maintained at 36° ± 0.2°C with the aid of a rectal probe. Micro-vascular clamps were placed bilaterally to occlude the renal pedicles for 20 min. For adoptive cell transfer experiments, unilateral (left-sided) renal pedicles were clamped for 20 min. The abdomen was closed with 5/0 monofilament suture. Buprenex® (0.3 mg/ml) was administered subcutaneously (0.1 mg/kg) every 12 hr to alleviate pain. Mice were euthanized 24 hr after reperfusion. Blood was collected via cardiac puncture; kidney tissue was snap frozen, placed in RNA later, embedded in optimal cutting temperature (OCT) compound (Sakura Finetek, Torrance, CA), fixed in 10% neutral buffered formalin, or digested using collagenase I (Worthington-biochemical Corporation, Lakewood, NJ) for cell isolation and flow cytometric analysis.
Assessment of renal function after IRI
Renal function was assessed by measurement of serum creatinine 24 hr after IRI using a Jaffe creatinine picric acid reaction (OSR 6178; Beckman Coulter, Brea, CA) analyzed on an Olympus AU640 analyzer (Beckman Coulter).
Flow cytometry
Cells from kidney or spleen, were first stained with Zombie Aqua (Biolegend; San Diego, CA) to exclude dead cells according to the manufacturer’s instructions. Cells were then treated with FcγR-blocking rat anti-mouse CD16/32 Ab (93; Biolegend). The procedures for flow staining were similar to those we have described previously.19, 49 Briefly, for surface staining, cells were incubated for 30 min at 4°C with different combinations of fluorochrome-conjugated Abs, including CD45.2 (clone 104), NK1.1 (PK136), CD3 (17A2), B220/CD45R (RA3–6B2), CD11c (HL3), MHCII (M5/114.15.2), CD11b (M1/70), F4/80 (BM8), Ly6G (M1/70), CD40 (3/23), CD80 (16–10A1), CD86 (GL1), PDL1 (CD274; 10F.9G2) (from eBioscience, BD or Biolegend). After staining, the cells were fixed in 4% paraformaldehyde. For intracellular staining, the cells were cultured at 106 cells /ml in 15 ml tubes stimulated with LPS (100ng/ml; Sigma). GolgiStop™ (0.66μl/ml; BD) was added 30 min after LPS stimulation. Cells were then stained for surface markers as described above, fixed and permeabilized using Fix and Perm reagent (eBioscience) followed by cytokine staining. The following fluorochrome-conjugated Abs were used: TNF-α (MP6-XT22) and IL-10 (JES5–16E3) (BD). Appropriate fluorochrome-conjugated isotype-matched IgG was used as a negative control. All flow data were acquired using a LSR Fortessa flow cytometer (BD) and analyzed using FlowJo v10 software (Tree Star, San Carlos, CA).
Kidney histology
Kidneys embedded in paraffin were sectioned at 5 μm and stained with hematoxylin and eosin using standard methods. As described previously,21, 48 indices of tubular damage (tubular dilation, cell necrosis, infarction and cast formation) were scored by calculation of the percentage of tubules in the corticomedullary junction that displayed such features. The scores were as follows: 0, none; 1, 1%–10%; 2, 11%–25%; 3, 26%–45%; 4, 46%–75%; and 5, 75%. Histologic assessment was performed in blinded fashion on six randomly-selected corticomedullary fields (magnification x100).
Immunohistochemistry
Formalin-fixed, paraffin-embedded kidney sections (5μm) were deparaffinized and boiled for 30 min in 10 mM sodium citrate buffer (pH 6.0). The sections were exposed to 3% H2O2 in PBS to quench endogenous peroxidase and blocked with Super Block (ScyTek AAA500, Logan, UT) and Avidin/Biotin block (Vector Laboratories, Burlingame, CA). They were stained with primary rabbit anti-mouse CD11b Ab (1:5000; clone ERR1344, Abcam, Cambridge, MA) overnight at room temperature (RT). After washing with PBS, biotinylated goat anti-rabbit secondary Ab (Vector Laboratories; 1:200) was added in combination with a Vectastain ABC kit (Vector Laboratories) at RT for 30 min. After washing, the sections were incubated with AEC (ScyTek ACE500) for 5 min, washed, counterstained with hematoxylin, dehydrated and covered. For Ly6B.2 staining, sections were incubated with primary rat anti-mouse Ly6B.2 Ab (1:100; clone 7/4, Bio-Rad, Oxford) overnight at RT, then with secondary biotinylated horse anti-rat Ab (1:200; Vector Laboratories) at RT for 30 min. All other materials and procedures were as for CD11b staining. Quantification cell infiltrates was performed in a “blinded” manner by assessing 10 consecutive high-power fields (hpf; magnification, ×400).
Renal parenchymal cell death
TUNEL staining to detect cell death was performed with a commercially available in situ cell death detection kit (Roche, Basel, Switzerland), used in accordance with the manufacturer’s instructions.
RNA extraction and quantification by real-time PCR
Total RNA was extracted using Qiagen RNeasy Mini Kits (Qiagen, Hilden, Germany) as per the manufacturer’s instructions. RNA was quantified using a Take3 Gen5 spectrophotometer (BioTek, Winooski, VT). One microgram of RNA was treated with DNase I (amplification grade; Invitrogen) and then reverse-transcribed using the Superscript III First Strand Synthesis SuperMix (Invitrogen). cDNA was amplified using Platinum Quantitative PCR SuperMix-UDG (Invitrogen) in 20 μl volumes in quadruplicate with gene-specific primers and probed on the ABI Prism 7900HT Sequence Detection System (Applied Biosystems, Foster City, CA) according to the manufacturer’s instructions. Thermal cycling conditions were 50°C for 2 min then 95°C for 2 min, followed by 40 cycles of 95°C for 15 sec and 60°C for 1 min. Data were analyzed using the ΔΔCt method with expression normalized to the housekeeping gene (GAPDH) with sham-operated animals serving as controls.
Statistical analyses
Results were expressed as means ± 1SD. Statistical analyses were performed using GraphPad Prism software (La Jolla, CA). Data were analyzed by Student’s ‘t’-test (parametric data) or the Mann-Whitney U test (non-parametric data), or by analysis of variance (ANOVA) for multiple group comparisons. P < 0.05 was considered significant.
Supplementary Material
Age-matched male CD11c+Cre−/-Raptorf/f (WT DC) or CD11cCre+/+Raptorf/f (Raptor−/− DC) mice were challenged by sham operation or 20 min bilateral renal ischemia and 24 hr reperfusion. Serum creatinine and blood urea nitrogen (BUN) levels were determined (n=3–5 mice per group). ****P < 0.0001. n.s, not significant.
ACKNOWLEDGEMENTS
This work was supported by National Institutes of Health (NIH) grants R01 AI67541 and R56 AI126377 (to AWT). HD was in receipt of China Scholarship Council funding (201506370079). DF was in receipt of an American Society of Nephrology Ben Lipps Postdoctoral Research Fellowship. ARW was in receipt of an institutional NIH T32 (AI74490) research training fellowship. NMR was in receipt of the Joseph A. Patrick Fellowship in Transplantation. We thank Drs. Heth Turnquist and Bala Ramaswami, and Mr. Mark A. Ross and Mr. Alan F. Zahorchak for valuable advice and technical support.
Footnotes
Publisher's Disclaimer: This is a PDF file of an unedited manuscript that has been accepted for publication. As a service toour customers we are providing this early version of the manuscript. The manuscript will undergo copyediting, typesetting, and review of the resulting proof before it is published in its final form. Please note that during the production process errors may be discovered which could affect the content, and all legal disclaimers that apply to the journal pertain.
DISCLOSURE
All the authors declare no competing interests.
REFERENCES
- 1.Rogers NM, Ferenbach DA, Isenberg JS, et al. Dendritic cells and macrophages in the kidney: a spectrum of good and evil. Nature reviews Nephrology 2014; 10: 625–643. [DOI] [PMC free article] [PubMed] [Google Scholar]
- 2.Ysebaert DK, De Greef KE, Vercauteren SR, et al. Identification and kinetics of leukocytes after severe ischaemia/reperfusion renal injury. Nephrol Dial Transplant 2000; 15: 1562–1574. [DOI] [PubMed] [Google Scholar]
- 3.Li L, Okusa MD. Macrophages, dendritic cells, and kidney ischemia-reperfusion injury. Semin Nephrol 2010; 30: 268–277. [DOI] [PMC free article] [PubMed] [Google Scholar]
- 4.Kim MG, Boo CS, Ko YS, et al. Depletion of kidney CD11c+ F4/80+ cells impairs the recovery process in ischaemia/reperfusion-induced acute kidney injury. Nephrol Dial Transplant 2010; 25: 2908–2921. [DOI] [PubMed] [Google Scholar]
- 5.Lu L, Faubel S, He Z, et al. Depletion of macrophages and dendritic cells in ischemic acute kidney injury. Am J Nephrol 2012; 35: 181–190. [DOI] [PMC free article] [PubMed] [Google Scholar]
- 6.Sengupta S, Peterson TR, Sabatini DM. Regulation of the mTOR complex 1 pathway by nutrients, growth factors, and stress. Mol Cell 2010; 40: 310–322. [DOI] [PMC free article] [PubMed] [Google Scholar]
- 7.Saxton RA, Sabatini DM. mTOR Signaling in Growth, Metabolism, and Disease. Cell 2017; 168: 960–976. [DOI] [PMC free article] [PubMed] [Google Scholar]
- 8.Oh WJ, Jacinto E. mTOR complex 2 signaling and functions. Cell Cycle 2011; 10: 2305–2316. [DOI] [PMC free article] [PubMed] [Google Scholar]
- 9.Thomson AW, Turnquist HR, Raimondi G. Immunoregulatory functions of mTOR inhibition. Nat Rev Immunol 2009; 9: 324–337. [DOI] [PMC free article] [PubMed] [Google Scholar]
- 10.Powell JD, Delgoffe GM. The mammalian target of rapamycin: linking T cell differentiation, function, and metabolism. Immunity 2010; 33: 301–311. [DOI] [PMC free article] [PubMed] [Google Scholar]
- 11.Hackstein H, Taner T, Zahorchak AF, et al. Rapamycin inhibits IL-4--induced dendritic cell maturation in vitro and dendritic cell mobilization and function in vivo. Blood 2003; 101: 4457–4463. [DOI] [PubMed] [Google Scholar]
- 12.Wei J, Yang K, Chi H. Cutting edge: Discrete functions of mTOR signaling in invariant NKT cell development and NKT17 fate decision. J Immunol 2014; 193: 4297–4301. [DOI] [PMC free article] [PubMed] [Google Scholar]
- 13.Delgoffe GM, Kole TP, Zheng Y, et al. The mTOR kinase differentially regulates effector and regulatory T cell lineage commitment. Immunity 2009; 30: 832–844. [DOI] [PMC free article] [PubMed] [Google Scholar]
- 14.Lee K, Gudapati P, Dragovic S, et al. Mammalian target of rapamycin protein complex 2 regulates differentiation of Th1 and Th2 cell subsets via distinct signaling pathways. Immunity 2010; 32: 743–753. [DOI] [PMC free article] [PubMed] [Google Scholar]
- 15.Ray JP, Staron MM, Shyer JA, et al. The Interleukin-2-mTORc1 Kinase Axis Defines the Signaling, Differentiation, and Metabolism of T Helper 1 and Follicular B Helper T Cells. Immunity 2015; 43: 690–702. [DOI] [PMC free article] [PubMed] [Google Scholar]
- 16.Lee K, Heffington L, Jellusova J, et al. Requirement for Rictor in homeostasis and function of mature B lymphoid cells. Blood 2013; 122: 2369–2379. [DOI] [PMC free article] [PubMed] [Google Scholar]
- 17.Jacinto E, Loewith R, Schmidt A, et al. Mammalian TOR complex 2 controls the actin cytoskeleton and is rapamycin insensitive. Nat Cell Biol 2004; 6: 1122–1128. [DOI] [PubMed] [Google Scholar]
- 18.Brown J, Wang H, Suttles J, et al. Mammalian target of rapamycin complex 2 (mTORC2) negatively regulates Toll-like receptor 4-mediated inflammatory response via FoxO1. J Biol Chem 2011; 286: 44295–44305. [DOI] [PMC free article] [PubMed] [Google Scholar]
- 19.Raich-Regue D, Rosborough BR, Watson AR, et al. mTORC2 Deficiency in Myeloid Dendritic Cells Enhances Their Allogeneic Th1 and Th17 Stimulatory Ability after TLR4 Ligation In Vitro and In Vivo. J Immunol 2015; 194: 4767–4776. [DOI] [PMC free article] [PubMed] [Google Scholar]
- 20.Hine C, Harputlugil E, Zhang Y, et al. Endogenous hydrogen sulfide production is essential for dietary restriction benefits. Cell 2015; 160: 132–144. [DOI] [PMC free article] [PubMed] [Google Scholar]
- 21.Rogers NM, Thomson AW, Isenberg JS. Activation of parenchymal CD47 promotes renal ischemia-reperfusion injury. J Am Soc Nephrol 2012; 23: 1538–1550. [DOI] [PMC free article] [PubMed] [Google Scholar]
- 22.Hassoun HT, Grigoryev DN, Lie ML, et al. Ischemic acute kidney injury induces a distant organ functional and genomic response distinguishable from bilateral nephrectomy. Am J Physiol Renal Physiol 2007; 293: F30–40. [DOI] [PubMed] [Google Scholar]
- 23.Raich-Regue D, Fabian KP, Watson AR, et al. Intratumoral delivery of mTORC2-deficient dendritic cells inhibits B16 melanoma growth by promoting CD8(+) effector T cell responses. Oncoimmunology 2016; 5: e1146841. [DOI] [PMC free article] [PubMed] [Google Scholar]
- 24.Coates PT, Colvin BL, Ranganathan A, et al. CCR and CC chemokine expression in relation to Flt3 ligand-induced renal dendritic cell mobilization. Kidney Int 2004; 66: 1907–1917. [DOI] [PubMed] [Google Scholar]
- 25.Zheng D, Wen L, Li C, et al. Adoptive transfer of bone marrow dendritic cells failed to localize in the renal cortex and to improve renal injury in adriamycin nephropathy. Nephron Exp Nephrol 2014; 126: 8–15. [DOI] [PubMed] [Google Scholar]
- 26.Sarbassov DD, Ali SM, Sengupta S, et al. Prolonged rapamycin treatment inhibits mTORC2 assembly and Akt/PKB. Mol Cell 2006; 22: 159–168. [DOI] [PubMed] [Google Scholar]
- 27.Reichardt W, Durr C, von Elverfeldt D, et al. Impact of mammalian target of rapamycin inhibition on lymphoid homing and tolerogenic function of nanoparticle-labeled dendritic cells following allogeneic hematopoietic cell transplantation. J Immunol 2008; 181: 4770–4779. [DOI] [PMC free article] [PubMed] [Google Scholar]
- 28.Sordi V, Bianchi G, Buracchi C, et al. Differential effects of immunosuppressive drugs on chemokine receptor CCR7 in human monocyte-derived dendritic cells: selective upregulation by rapamycin. Transplantation 2006; 82: 826–834. [DOI] [PubMed] [Google Scholar]
- 29.Taner T, Hackstein H, Wang Z, et al. Rapamycin-treated, alloantigen-pulsed host dendritic cells induce ag-specific T cell regulation and prolong graft survival. Am J Transplant 2005; 5: 228–236. [DOI] [PubMed] [Google Scholar]
- 30.Li L, Huang L, Sung SS, et al. The chemokine receptors CCR2 and CX3CR1 mediate monocyte/macrophage trafficking in kidney ischemia-reperfusion injury. Kidney Int 2008; 74: 1526–1537. [DOI] [PMC free article] [PubMed] [Google Scholar]
- 31.Mizuno S, Nakamura T. Prevention of neutrophil extravasation by hepatocyte growth factor leads to attenuations of tubular apoptosis and renal dysfunction in mouse ischemic kidneys. The American journal of pathology 2005; 166: 1895–1905. [DOI] [PMC free article] [PubMed] [Google Scholar]
- 32.Li L, Huang L, Vergis AL, et al. IL-17 produced by neutrophils regulates IFN-gamma-mediated neutrophil migration in mouse kidney ischemia-reperfusion injury. The Journal of clinical investigation 2010; 120: 331–342. [DOI] [PMC free article] [PubMed] [Google Scholar]
- 33.Jang HR, Rabb H. Immune cells in experimental acute kidney injury. Nature reviews Nephrology 2015; 11: 88–101. [DOI] [PubMed] [Google Scholar]
- 34.Bohannon J, Cui W, Sherwood E, et al. Dendritic cell modification of neutrophil responses to infection after burn injury. J Immunol 2010; 185: 2847–2853. [DOI] [PMC free article] [PubMed] [Google Scholar]
- 35.Tittel AP, Heuser C, Ohliger C, et al. Functionally relevant neutrophilia in CD11c diphtheria toxin receptor transgenic mice. Nature methods 2012; 9: 385–390. [DOI] [PubMed] [Google Scholar]
- 36.Schuster S, Hurrell B, Tacchini-Cottier F. Crosstalk between neutrophils and dendritic cells: a context-dependent process. Journal of leukocyte biology 2013; 94: 671–675. [DOI] [PubMed] [Google Scholar]
- 37.Dong X, Swaminathan S, Bachman LA, et al. Resident dendritic cells are the predominant TNF-secreting cell in early renal ischemia-reperfusion injury. Kidney Int 2007; 71: 619–628. [DOI] [PubMed] [Google Scholar]
- 38.Cherukuri A, Rothstein DM, Clark B, et al. Immunologic human renal allograft injury associates with an altered IL-10/TNF-alpha expression ratio in regulatory B cells. J Am Soc Nephrol 2014; 25: 1575–1585. [DOI] [PMC free article] [PubMed] [Google Scholar]
- 39.Kim BS, Lim SW, Li C, et al. Ischemia-reperfusion injury activates innate immunity in rat kidneys. Transplantation 2005; 79: 1370–1377. [DOI] [PubMed] [Google Scholar]
- 40.Zhou T, Sun GZ, Zhang MJ, et al. Role of adhesion molecules and dendritic cells in rat hepatic/renal ischemia-reperfusion injury and anti-adhesive intervention with anti-P-selectin lectin-EGF domain monoclonal antibody. World J Gastroenterol 2005; 11: 1005–1010. [DOI] [PMC free article] [PubMed] [Google Scholar]
- 41.Tokita D, Mazariegos GV, Zahorchak AF, et al. High PDL1/CD86 ratio on plasmacytoid dendritic cells correlates with elevated T-regulatory cells in liver transplant tolerance. Transplantation 2008; 85: 369–377. [DOI] [PubMed] [Google Scholar]
- 42.Shen T, Chen X, Chen Y, et al. Increased PDL1 expression and PDL1/CD86 ratio on dendritic cells were associated with impaired dendritic cells function in HCV infection. J Med Virol 2010; 82: 1152–1159. [DOI] [PubMed] [Google Scholar]
- 43.Fantus D, Rogers NM, Grahammer F, et al. Roles of mTOR complexes in the kidney: implications for renal disease and transplantation. Nature reviews Nephrology 2016; 12: 587–609. [DOI] [PMC free article] [PubMed] [Google Scholar]
- 44.Fantus D, Thomson AW. Evolving perspectives of mTOR complexes in immunity and transplantation. Am J Transplant 2015; 15: 891–902. [DOI] [PubMed] [Google Scholar]
- 45.Basu B, Dean E, Puglisi M, et al. First-in-Human Pharmacokinetic and Pharmacodynamic Study of the Dual m-TORC 1/2 Inhibitor AZD2014. Clinical cancer research : an official journal of the American Association for Cancer Research 2015; 21: 3412–3419. [DOI] [PMC free article] [PubMed] [Google Scholar]
- 46.Powles T, Wheater M, Din O, et al. A Randomised Phase 2 Study of AZD2014 Versus Everolimus in Patients with VEGF-Refractory Metastatic Clear Cell Renal Cancer. European urology 2016; 69: 450–456. [DOI] [PubMed] [Google Scholar]
- 47.Morelli AE, Zahorchak AF, Larregina AT, et al. Cytokine production by mouse myeloid dendritic cells in relation to differentiation and terminal maturation induced by lipopolysaccharide or CD40 ligation. Blood 2001; 98: 1512–1523. [DOI] [PubMed] [Google Scholar]
- 48.Rogers NM, Zhang ZJ, Wang JJ, et al. CD47 regulates renal tubular epithelial cell self-renewal and proliferation following renal ischemia reperfusion. Kidney Int 2016; 90: 334–347. [DOI] [PubMed] [Google Scholar]
- 49.Rosborough BR, Raich-Regue D, Matta BM, et al. Murine dendritic cell rapamycin-resistant and rictor-independent mTOR controls IL-10, B7–H1, and regulatory T-cell induction. Blood 2013; 121: 3619–3630. [DOI] [PMC free article] [PubMed] [Google Scholar]
Associated Data
This section collects any data citations, data availability statements, or supplementary materials included in this article.
Supplementary Materials
Age-matched male CD11c+Cre−/-Raptorf/f (WT DC) or CD11cCre+/+Raptorf/f (Raptor−/− DC) mice were challenged by sham operation or 20 min bilateral renal ischemia and 24 hr reperfusion. Serum creatinine and blood urea nitrogen (BUN) levels were determined (n=3–5 mice per group). ****P < 0.0001. n.s, not significant.


