



Abstract
Exercise limitation is common in chronic obstructive pulmonary disease (COPD). We determined the impact of pulmonary emphysema on the physiological response to exercise independent of contemporary measures of COPD severity. Smokers 40–79 years old with COPD underwent computed tomography, pulmonary function tesing, and symptom-limited incremental exercise testing. COPD severity was quantified according to the Global Initiative for Chronic Obstructive Lung Disease (GOLD) by spirometry (GOLD 1–4); and symptom burden and exacerbation risk (GOLD A-D). Emphysema severity was quantified as the percent lung volume <−950 Hounsfield units. Regression models adjusted for age, gender, body size, smoking status, airflow limitation, symptom burden and exacerbation risk. Among 67 COPD subjects (age 67 ± 8 years; 75% male; GOLD 1–4: 11%, 43%, 30%, 16%), median percent emphysema was 11%, and peak power output (PPO) was 61 ± 32 W. Higher percent emphysema independently predicted lower PPO (−24 W per 10% increment in emphysema; 95%CI −41 to −7 W). Throughout exercise, higher percent emphysema predicted 1) higher minute ventilation, ventilatory equivalent for CO2, and heart rate; and 2) lower oxy-hemoglobin saturation, and end-tidal PCO2. Independent of contemporary measures of COPD severity, the extent of pulmonary emphysema predicts lower exercise capacity, ventilatory inefficiency, impaired gas-exchange and increased heart rate response to exercise.
Introduction
Chronic obstructive pulmonary disease (COPD) is a heterogeneous disorder characterized by persistent airflow limitation due to airway and alveolar abnormalities1. Exercise intolerance is observed at all severities of COPD, but correlates poorly with spirometry and responds variably to pharmacological interventions targeting airway bronchoconstriction and inflammation2–7. There is increasing interest in identifying COPD endotypes to better target the heterogeneous pathophysiologies that contribute to COPD8. Indeed, contemporary guidelines emphasize indivudalized patient management1.
Pulmonary emphysema is defined anatomically as enlargement of alveoli with destruction of their walls, and is present to varying degrees in COPD9. Emphysema is reliably quantified in vivo by computed tomography (CT) and correlates with histopathlogy10,11.
Emphysema at CT has been shown to predict mortality independent of airflow limitation12,13, suggesting a distinct pathophysiology from non-emphysematous COPD. Emphysema is also associated with impaired pulmonary blood flow, and cardiac filling that is independent of airflow limitation14–17. While emphysema has been shown to predict shorter six-minute walk distance, lower peak O2 uptake and greater exercise ventilatory inefficiency in COPD18–29, the independent contribution of emphysema in COPD to the abnormal physiological and perceptual response to exercise remains poorly understood.
We hypothesized that emphysema severity in patients with mild-to-very-severe COPD would be associated with lower exercise capacity and altered cardiac, metabolic, gas exchange, ventilatory and perceptual responses to symptom-limited incremental cycle exercise testing, independent of airflow limitation, symptom burden and exacerbation risk.
Results
Among 70 participants enrolled in the study, 67 completed study measures and were included in the analysis. The mean age of participants completing the study was 67 ± 8 years, and 75% were men. The prevalence of GOLD 1–4 was 11%, 43%, 30%, and 16%, respectively; and GOLD group A-D was 49%, 25%, 8%, and 18%, respectively. Participant characteristics stratified by quartiles of percent emphysema are summarized in Table 1. Airflow limitation severity, gas-trapping, hyperinflation, and DLCO impairment increased with percent emphysema quartile, whereas age, gender, height, BMI, pectoral muscle area, pulmonary artery-to-aorta diameter, and smoking history were similar.
Table 1.
Participant characteristics by quartile of percent emphysema.
| Quartiles of Percent Emphysema | p-value | ||||
|---|---|---|---|---|---|
| Q1 N = 17 | Q2 N = 17 | Q3 N = 17 | Q4 N = 16 | ||
| Percent emphysema | 3.1 (2.1, 4.5) | 8.4 (7.4, 9.6) | 14.5 (12.6, 16.2) | 27.5 (23.8, 35.5) | |
| Age – years | 66 ± 8 | 65 ± 9 | 67 ± 8 | 70 ± 6 | 0.205 |
| Male – % | 65 | 76 | 76 | 81 | 0.151 |
| Height – cm | 167 ± 11 | 168 ± 11 | 167 ± 8 | 171 ± 7 | 0.311 |
| Body mass index – kg/m2 | 26 ± 4 | 28 ± 7 | 28 ± 6 | 25 ± 5 | 0.404 |
| Smoking status – % | 0.004 | ||||
| Current | 53 | 41 | 24 | 12 | |
| Former | 47 | 59 | 76 | 88 | |
| Pack-years of smoking | 59 ± 22 | 61 ± 32 | 56 ± 30 | 48 ± 26 | 0.154 |
| mMRC dyspnea rating – % | 0.171 | ||||
| 0 | 41 | 29 | 24 | 13 | |
| 1 | 18 | 35 | 47 | 19 | |
| 2 | 29 | 6 | 6 | 25 | |
| 3 | 6 | 18 | 12 | 38 | |
| 4 | 6 | 12 | 12 | 6 | |
| FEV1% predicted | 68 ± 20 | 54 ± 18 | 52 ± 20 | 35 ± 16 | <0.001 |
| FVC % predicted | 94 ± 20 | 89 ± 20 | 92 ± 23 | 81 ± 23 | 0.160 |
| FEV1/FVC | 0.54 ± 0.11 | 0.45 ± 0.12 | 0.41 ± 0.09 | 0.31 ± 0.08 | <0.001 |
| GOLD by severity of airflow limitation – % | <0.001 | ||||
| 1 | 24 | 6 | 12 | 6 | |
| 2 | 59 | 59 | 47 | 6 | |
| 3 | 18 | 29 | 35 | 38 | |
| 4 | 0 | 6 | 6 | 50 | |
| GOLD by group – % | 0.056 | ||||
| A | 53 | 59 | 59 | 25 | |
| B | 41 | 18 | 18 | 25 | |
| C | 6 | 6 | 12 | 6 | |
| D | 0 | 18 | 12 | 44 | |
| Frequent or severe exacerbator – % | 6 | 24 | 24 | 47 | 0.006 |
| Residual volume % predicted | 101 ± 58 | 131 ± 64 | 151 ± 55 | 175 ± 89 | 0.004 |
| Functional residual capacity % predicted | 141 ± 32 | 145 ± 43 | 157 ± 25 | 172 ± 38 | 0.012 |
| Total lung capacity % predicted | 113 ± 18 | 115 ± 18 | 122 ± 12 | 129 ± 14 | 0.005 |
| CT lung volume/Plethysmographic TLC | 0.70 ± 0.09 | 0.77 ± 0.08 | 0.73 ± 0.07 | 0.79 ± 0.11 | <0.001 |
| DLCO % predicted | 73 ± 14 | 58 ± 13 | 57 ± 19 | 31 ± 11 | < 0.001 |
| Pectoralis muscle area – cm2 | 34.5 ± 10.5 | 28.2 ± 8.1 | 31.0 ± 8.6 | 28.2 ± 7.6 | 0.090 |
| Pulmonary artery to aorta diameter ratio | 0.79 ± 0.12 | 0.76 ± 0.09 | 0.75 ± 0.11 | 0.82 ± 0.15 | 0.530 |
| Resting | |||||
| – mL/kg/min | 4.5 ± 1.5 | 4.8 ± 1.0 | 4.2 ± 1.2 | 4.4 ± 1.5 | 0.823 |
| Dyspnea – Borg 0–10 scale | 0.0 (0.0, 0.0) | 0.0 (0.0, 1.5) | 0.0 (0.0, 0.0) | 1.0 (0.5, 3.0) | 0.019 |
| Leg fatigue – Borg 0–10 scale | 0.0 (0.0, 0.0) | 0.0 (0.0, 1.0) | 0.0 (0.0, 0.0) | 0.5 (0.0, 1.0) | 0.112 |
| – L/min | 15.1 ± 3.5 | 17.3 ± 3.4 | 15.4 ± 3.0 | 16.4 ± 3.0 | 0.354 |
| VT − L | 0.8 ± 0.1 | 0.9 ± 0.2 | 0.8 ± 0.2 | 0.8 ± 0.2 | 0.323 |
| Respiratory rate – breaths/min | 20 ± 4 | 21 ± 5 | 19 ± 3 | 21 ± 5 | 0.953 |
| / | 57.8 ± 9.8 | 59.1 ± 13.5 | 57.4 ± 11.7 | 66.0 ± 12.6 | 0.086 |
| PETCO2 – mmHg | 30.6 ± 3.4 | 29.7 ± 3.4 | 30.5 ± 5.3 | 27.7 ± 4.1 | 0.088 |
| SpO2 – % | 96.2 ± 3.1 | 96.0 ± 1.5 | 94.9 ± 1.4 | 95.7 ± 2.5 | 0.498 |
| Heart rate – beats/min | 82 ± 15 | 80 ± 14 | 84 ± 11 | 88 ± 14 | 0.052 |
| O2 pulse – mL O2/beat | 4.0 ± 1.3 | 4.8 ± 1.4 | 3.8 ± 0.7 | 3.5 ± 0.8 | 0.081 |
| Nadir / | |||||
| / | 40.2 ± 5.3 | 46.0 ± 8.2 | 43.7 ± 9.7 | 50.2 ± 12.2 | 0.013 |
| – L/min | 38.6 ± 12.7 | 37.4 ± 14.7 | 38.9 ± 10.4 | 28.1 ± 7.8 | 0.015 |
| – L/min | 1.0 ± 0.3 | 0.9 ± 0.4 | 0.9 ± 0.2 | 0.6 ± 0.1 | <0.001 |
| PETCO2 – mmHg | 36.2 ± 4.3 | 33.9 ± 4.5 | 36.4 ± 7.8 | 32.7 ± 6.3 | 0.230 |
| – mL/kg/min | 13.2 ± 4.8 | 11.6 ± 3.8 | 10.9 ± 3.1 | 8.8 ± 2.6 | <0.001 |
| Power output - W | 50 ± 27 | 53 ± 21 | 57 ± 23 | 33 ± 17 | 0.002 |
| Peak Exercise | |||||
| Power output - W | 75 ± 38 | 65 ± 34 | 66 ± 26 | 38 ± 19 | 0.001 |
| – mL/kg/min | 14.7 ± 5.6 | 13.2 ± 5.8 | 12.2 ± 4.3 | 9.3 ± 3.0 | <0.001 |
| Dyspnea – Borg 0–10 scale | 3.0 (3.0, 5.0) | 3.0 (3.0, 4.0) | 5.0 (3.0, 5.0) | 5.0 (3.0, 5.0) | 0.329 |
| Leg fatigue – Borg 0–10 scale | 4.0 (3.0, 4.0) | 3.0 (3.0, 5.0) | 4.0 (3.0, 4.0) | 4.0 (2.0, 5.0) | 0.668 |
| – L/min | 46.7 ± 18.3 | 47.0 ± 26.0 | 41.3 ± 14.4 | 31.5 ± 12.8 | 0.007 |
| VT – L | 1.5 ± 0.5 | 1.5 ± 0.5 | 1.5 ± 0.5 | 1.4 ± 0.4 | 0.380 |
| Respiratory rate – breaths/min | 30 ± 5 | 32 ± 8 | 28 ± 4 | 24 ± 8 | 0.001 |
| / | 43.7 ± 5.9 | 48.0 ± 8.7 | 45.8 ± 10.5 | 52.2 ± 11.8 | 0.034 |
| PETCO2 – mmHg | 34.2 ± 4.0 | 32.9 ± 4.9 | 35.3 ± 7.0 | 31.8 ± 6.5 | 0.399 |
| SpO2 – % | 95.8 ± 1.9 | 94.9 ± 2.9 | 93.3 ± 4.1 | 93.4 ± 4.2 | 0.083 |
| Heart rate – beats/min | 118 ± 18 | 107 ± 18 | 117 ± 20 | 108 ± 15 | 0.454 |
| O2 pulse – mL O2/beat | 8.9 ± 3.2 | 9.5 ± 3.7 | 8.0 ± 2.4 | 6.2 ± 1.8 | <0.001 |
| Reasons for stopping exercise – % | 0.628 | ||||
| Dyspnea | 24 | 29 | 29 | 44 | |
| Leg fatigue | 47 | 29 | 41 | 25 | |
| Dyspnea and leg fatigue | 12 | 18 | 6 | 19 | |
| Other | 17 | 24 | 24 | 12 | |
Plus-minus values are mean ± SD and values with parentheses are median (25th, 75th percentile). GOLD 1–4 defined by percent predicted FEV1, and GOLD group A-D defined by symptoms and exacerbation risk (see Methods for details). P-values computed with percent emphysema as a continuous variable.
Abbreviations: HU = Hounsfield units; mMRC = modified Medical Research Council dyspnea scale; FEV1 forced expired volume in 1-sec; FVC = forced vital capacity; GOLD = Global Initiative for Chronic Obstructive Lung Disease; TLC = total lung capacity; DLCO = diffusing capacity for carbon monoxide; = rate of O2 uptake; = minute ventilation; VT = tidal volume; = rate of CO2 output; / = ventilatory equivalent for CO2; PETCO2 = end-tidal partial pressure of CO2; SpO2 = pulse-oximeter estimate oxy-hemoglobin saturation.
Emphysema and peak exercise capacity
PPO and Peak were 61 ± 32 W (47 ± 27% predicted) and 12 ± 5 ml/kg/min (57 ± 30% predicted), respectively. Independent of airflow limitation severity (GOLD 1–4), higher percent emphysema was associated with lower PPO (−24 W per 10% increment in emphysema; 95%CI: −41 to −7), and lower Peak (−2.7 ml/kg/min per 10% increment in emphysema; 95% CI: −5.2 to −0.2), and these associations remained significant in models adjusting for FEV1 as a continuous variable, and for GOLD group A-D (Fig. 1 and Table 2). Similar results were obtained with additional adjustment for pectoralis muscle area or pulmonary artery-to-aorta diameter (p ≤ 0.005).
Figure 1.

Percent emphysema was associated with peak exercise capacity independent of airflow limitation severity, and symptom burden/exacerbation frequency. Peak power output-percent emphysema relationship stratified by airflow limitation (panel A), and GOLD A–D (panel B). To account for potential confounders, peak power output was calculated using linear regression to adjust for age, gender, height, body mass index, depth of inspiration at CT, smoking status, and FEV1 percent predicted (panel A) or GOLD group A–D (panel B). GOLD group A–D was defined by symptom burden and exacerbation frequency (See Methods for details). Abbreviations: FEV1 = forced expired volume in one second; COPD = chronic obstructive pulmonary disease; CT = computed tomography; and GOLD = Global Initiative for Chronic Obstructive Lung Disease.
Table 2.
Relationship between percent emphysema, peak exercise capacity, peak perceptual responses, and ventilatory inefficiency, expiratory flow limitation and inspiratory neural drive throughout incremental cycle exercise in chronic obstructive pulmonary disease.
| Mean difference in exercise response per 10% increment in percent emphysema (95% CI) | |||||
|---|---|---|---|---|---|
| Unadjusted | Model 1 | Model 1 + GOLD 1–4 | Model 1 + FEV1 percent predicted | Model 1 + GOLD A-D | |
| Peak power output – W | −29 (−46 to −12) P < 0.001 | −41 (−59 to −24) P < 0.001 | −24 (−41 to −7) P = 0.007 | −21 (−34 to −9) P = 0.001 | −31 (−47 to −14) P < 0.001 |
| Peak – mL/kg/min | −4.3 (−6.6 to −1.9) P < 0.001 | −6.2 (−8.8 to −3.6) P < 0.001 | −2.7 (−5.2 to −0.2) P = 0.036 | −2.3 (−4.6 to −0.1) P = 0.038 | −4.6 (−7.3 to −1.9) P < 0.001 |
| Peak dyspnea/ ratio – Borg units/L/min | 0.04 (0.01 to 0.07) P = 0.021 | 0.05 (0.01 to 0.08) P = 0.006 | 0.01 (−0.03 to 0.04) P = 0.682 | 0.01 (−0.10 to 0.05) P = 0.721 | 0.03 (0.0 to 0.06) P = 0.022 |
| Peak leg fatigue/ ratio – Borg units/mL/kg/min | 0.93 (−0.67 to 2.53) P = 0.253 | 1.19 (−0.65 to 3.03) P = 0.206 | 0.45 (−1.40 to 2.30) P = 0.632 | 0.41 (−1.45 to 2.28) P = 0.663 | 0.73 (−0.82 to 2.27) P = 0.356 |
Mean differences in exercise responses at peak exercise estimated by linear regression. Model 1 adjusts for age, gender, height, body mass index, depth of inspiration at CT, and smoking status. GOLD 1–4 defined by strata of percent predicted FEV1, and GOLD group A-D defined by symptoms and exacerbation risk.
Abbreviations: CI = confidence interval; = rate of O2 uptake; = minute ventilation; CT = computed tomography; FEV1 = forced expired volume in 1-sec; and GOLD = Global Initiative for Chronic Obstructive Lung Disease.
Emphysema and perceptual responses at peak exercise
Higher dyspnea intensity- and leg fatigue- ratios at peak exercise were observed with higher percent emphysema; however, these associations were not significant after accounting for airflow limitation severity (Table 2).The reasons for stopping exercise were not associated with percent emphysema after adjusting for airflow limitation (p > 0.16 for dyspnea, leg discomfort or other). Similar results were obtained with additional adjustment for pectoralis muscle area or pulmonary artery-to-aorta diameter (p ≥ 0.503 for all analyses).
Emphysema and the cardiorespiratory responses throughout exercise
Throughout exercise and independent of airflow limitation severity (GOLD 1–4), percent emphysema was associated with higher VT, similar respiratory rate, higher VE, higher - slope, lower PETCO2, lower SpO2, higher heart rate, and lower O2 pulse (Fig. 2). Similar associations were observed with as the measure of exercise intensity (e-Fig. 1), and when adjusting for FEV1 as a continuous variable (e-Fig. 1), or GOLD A-D (e-Fig. 2).
Figure 2.
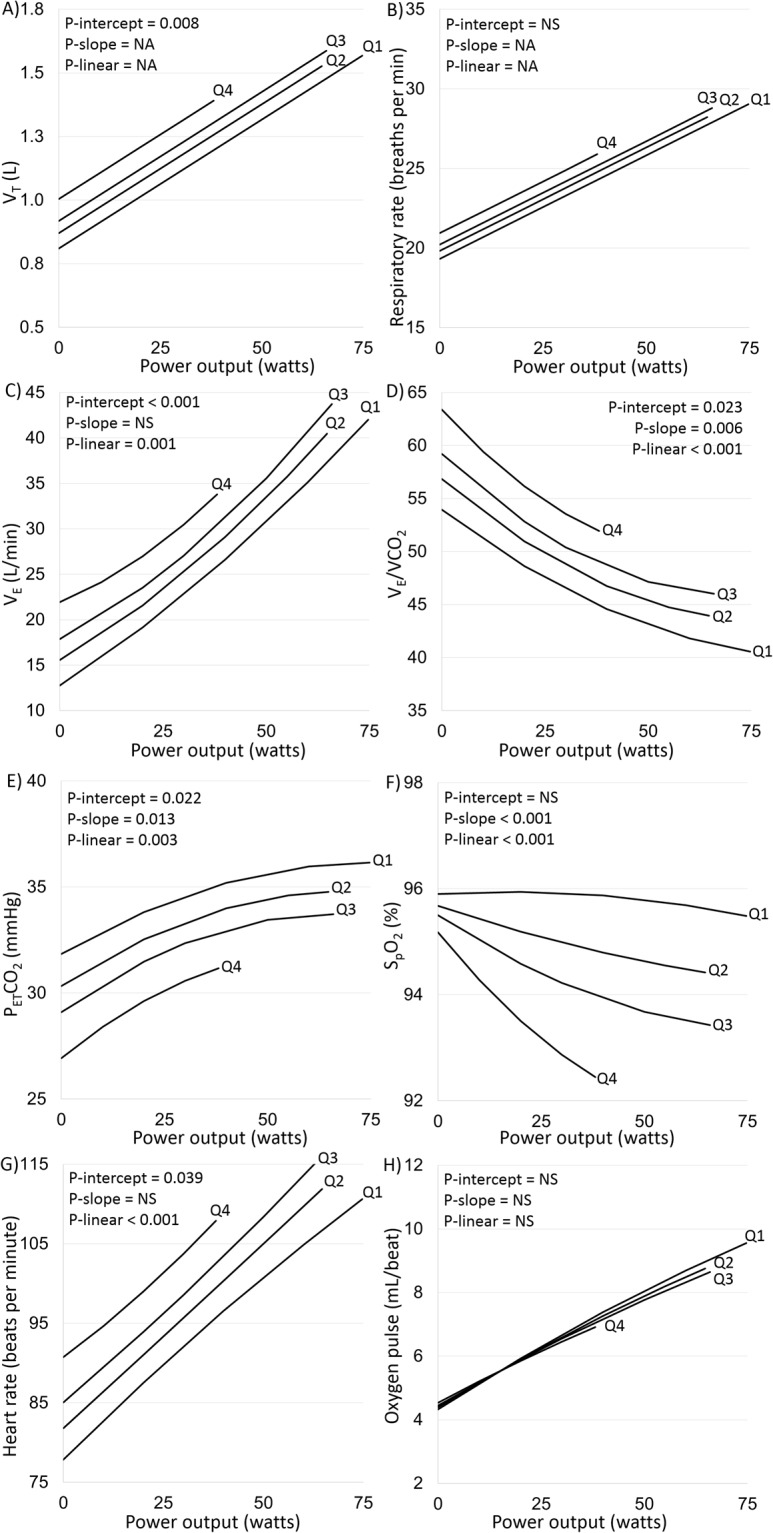
Cardiorespiratory responses to symptom-limited incremental cycle exercise testing by quartile of percent emphysema independent of airflow limitation. Each panel depicts the relationship between percent emphysema quartile (Q1: 3.1%; Q2: 8.4%; Q3: 14.5%; Q4: 27.5%) and a cardiorespiratory response (Y-axis) throughout exercise (X-axis). Curves were derived from mixed model regression adjusting for age, gender, height, body mass index, depth of inspiration at CT, smoking status, and airflow limitation severity (GOLD 1–4). P-intercept is the probability that percent emphysema predicts no difference in cardiorespiratory response at the intercept (i.e., rest). P-slope is the probability that percent emphysema predicts no difference in slope between exercise intensity and cardiorespiratory response. P-linear is the probability that the percent emphysema association with the cardiorespiratory response is linear. NA denotes the model did not require a slope or nonlinear term for optimum fit (See Methods for details). Abbreviations: VT = tidal volume; = rate of O2 uptake; = minute ventilation; = rate of CO2 output; PETCO2 = end-tidal partial pressure of CO2; SpO2 = pulse-oximeter estimated arterial oxy-hemoglobin saturation; CT = computed tomography; and GOLD = Global Initiative for Chronic Obstructive Lung Disease; NA = not applicable.
Percent emphysema was associated with higher - slope during exercise in unadjusted and adjusted analyses including spirometric GOLD 1–4 (Table 3). Percent emphysema was associated with higher / nadir independent of airflow limitation severity (GOLD 1–4 or FEV1 as a continuous variable) and GOLD group A-D, and which occurred at a lower exercise intensity and with lower PETCO2 (e-Table 1).
Table 3.
Relationship between percent emphysema and measures of ventilatory inefficiency, expiratory flow limitation and inspiratory neural drive throughout incremental cycle exercise testing in chronic obstructive pulmonary disease.
| Mean difference in exercise response per 10% increment in percent emphysema (95% CI) | |||||
|---|---|---|---|---|---|
| Unadjusted | Model 1 | Model 1 + GOLD 1–4 | Model 1 + FEV1 percent predicted | Model 1 + GOLD A-D | |
| / slope | 5.9 (1.0 to 10.8) p = 0.019 | 8.1 (1.5 to 14.6) p = 0.015 | 16.8 (9.3 to 24.4) P < 0.001 | 17.1 (9.5 to 24.7) P < 0.001 | 8.7 (2.6 to 14.8) P = 0.005 |
| /TE − slope – mL/sec/L/min | −4.2 (−6.0 to −2.4) P < 0.001 | −3.8 (−6.0 to −1.6) P < 0.001 | −0.9 (−3.5 to 1.7) P = 0.500 | −0.7 (−3.2 to 1.8) P = 0.575 | −3.4 (−5.8 to −1.1) P = 0.004 |
| /TI − slope – mL/sec/L/min | 12.3 (7.2 to 17.4) P < 0.001 | 11.9 (5.8 to 18.0) P < 0.001 | 3.2 (−3.6 to 10.1) P = 0.350 | 2.9 (−3.8 to 9.6) P = 0.391 | 10.9 (4.8 to 17.0) P < 0.001 |
Mean differences in exercise responses estimated by linear regression. Model 1 adjusts for age, gender, height, body mass index, depth of inspiration at CT, and smoking status. GOLD 1–4 defined by percent predicted FEV1, and GOLD group A-D defined by symptoms and exacerbation risk (see Methods for details).
Abbreviations: CI = confidence interval; = minute ventilation; = rate of CO2 output; VT = tidal volume; TE = expiratory time; TI = inspiratory time; VT/TE = mean tidal expiratory flow rate; VT/TE − slope = crude estimate of expiratory flow limitation, where a lower VT/TE − slope reflects greater expiratory flow limitation; VT/TI = mean tidal inspiratory flow rate; VT/TI − slope = crude estimate of inspiratory neural drive, where a higher VT/TI − slope reflects greater inspiratory neural drive; CT = computed tomography; FEV1 = forced expired volume in 1-sec; and GOLD = Global Initiative for Chronic Obstructive Lung Disease.
Slopes of the linear relationships between exercise-induced increases in and each of VT/TI and VT/TE were also associated with percent emphysema, but not after adjustment for GOLD 1–4 or FEV1 as a continuous variable (Table 3).
Similar results were obtained with additional adjustment for pectoralis muscle area or pulmonary artery-to-aorta diameter (e-Fig. 3 and 4).
Discussion
Among smokers with COPD, the extent of pulmonary emphysema was associated with reduced exercise capacity that was independent of standard measures of disease severity, including spirometric airflow limitation, symptom burden (mMRC dyspnea score) and exacerbation risk. Throughout exercise, emphysema was also independently associated with ventilatory inefficiency, impaired gas-exchange, and increased heart rate despite similar dyspnea and leg discomfort ratings and reasons for stopping exercise. This is important considering that obstructive changes and parenchymal destruction (emphysema) will vary from person to person, and they could evolve at different rates over time. These observations suggest that, independent of the severity of airflow limitation, emphysema contributes significantly to exercise intolerance, and may not respond to COPD therapies targeting bronchoconstriction and airways inflammation, particularly among adults with emphysema-predominant COPD.
To our knowledge the present study is the first to investigate the impact of emphysema severity at CT on the physiological and perceptual response to incremental exercise independent of contemporary measures of disease severity and symptom burden1. Emphysema assessed visually20 and quantitatively24 by CT have been correlated with lower Peak, and peak SpO2 on incremental treadmill exercise testing. Similarly, correlations have been described between emphysema severity and six-minute walk distance18,19,25–29. The present study supports and builds upon these observations by demonstrating that differences in exercise capacity are independent of currently recommended measures of COPD severity, symptom burden and exacerbation risk1. These observations suggest that emphysema severity, readily assessed at CT, is a potential indicator (“biomarker”) of physiological impairment in COPD that is unlikely to respond to therapies targeting airflow limitation alone.
The mechanisms of emphysema-associated exercise intolerance in COPD are incompletely understood and likely multi-factorial. Crisafulli, Jones, and Paoletti each reported emphysema-associated exercise ventilatory inefficiency21,22,24. Consistent with these observations, an early study of ventilation-perfusion in advanced COPD demonstrated that virtually all subjects with Burrows type A (emphysematous) COPD had high ventilation-perfusion ratios as compared with type B (bronchial) or mixed COPD phenotypes30,31. Notably, the pattern of ventilation-perfusion inequality in that study was not associated with the degree of spirometric impairment30. More recently, studies have reported an emphysematous phenotype of COPD with significant pulmonary hypertension, hypoxemia, and hypocapnia, despite only mild-to-moderate airflow limitation assessed by spirometry32,33. Furthermore, cardiac magnetic resonance studies in COPD have demonstrated lower lung perfusion and cardiac under filling with emphysema14–17. Emphysematous COPD is associated with higher levels of sarcopenia, which also contributes to exercise intolerance34,35. Our study builds upon these observations by showing that emphysema contributes to significant exercise impairment independent of currently recommended disease severity measures (spirometry, symptom burden, and exacerbation risk) in mild-to-very severe COPD. We further demonstrate emphysema-specific cardiorespiratory exercise responses (ventilatory inefficiency, impaired gas-exchange and cardiac response) independent of COPD severity, pulmonary arterial enlargement, and pectoralis muscle area36,37, and despite similar ratings of dyspnea and leg discomfort.
Together, the novel results of our study i) suggest that emphysema adds to the endotypic characterization of impairment in COPD; ii) strengthens evidence for mechanisms of emphysema-induced exercise that appear to be independent of established mechanisms of airflow limitation, pulmonary hypertension, and sarcopenia; iii) highlight the need for therapeutic targets beyond airways disease38–40; iv) and may inform participant selection (endotypic medicine) for clinical trials targeting the pathobiology of emphysematous COPD8.
We speculate that emphysema-specifc pathophysiological abnormalities in pulmonary gas exchange with attendant arterial blood O2 desaturation (as indicated by the SpO2 findings), cardiac dysfunction (as indicated by heart response findings), and unmeasured arterial hypoxemia with or without arterial hypercapnia and respiratory acidosis would impair exercise tolerance by compromising peripheral locomotor muscle O2 delivery, accelerating the rate of peripheral locomotor muscle fatigue development and increasing central respiratory motor drive via increased stimulation of central and peripheral chemoreceptors and perhaps also muscle metaboreceptors (type IV sensory afferents)41,42. Clinical physiology studies with detailed assessments of arterial blood gases and peripheral locomotor muscle function are needed to substantiate this hypothesis.
The present study has limitations. First, potential mechanisms of emphysema-associated exercise intolerance were not assessed, including the behavior of dynamic operating lung volumes (e.g., dynamic lung hyperinflation), dead space, hemodynamics (central, peripheral and pulmonary), and peripheral muscle dysfunction. Nevertheless, the current findings, to the best of our knowledge, represent the first demonstration of emphysema-associated exercise impairment that is independent of contemporary measures of COPD severity, symptom burden and exacerbation risk, and justify future investigations into the mechanism(s) of this association. Second, non-smokers and participants without COPD were not included in the study sample. We believe this design strategy limited the heterogeneity of disease pathogenesis and permitted a focused investigation of emphysema severity in clinical COPD. Third, our indirect measures of pulmonary arterial pressure, muscle wasting, as well as retrospective exacerbation frequency may have left residual confounding. Future analysis with invasive and prospective measures are needed, in addition to samples with greater muscle wasting. Finally, the sample size was modest and limited to a clinical population of smokers, three-quarters of whom were men, potentially limiting generalizability. However, patients were selected across the range of severity of airflow limitation (GOLD 1–4) and symptom burden/exacerbation risk (GOLD A-D). While our use of mixed model regression leveraged all observed data points, thereby reducing selection bias, increasing precision and accounting for auto-correlations, further study is needed in smokers without airflow limitation having structural evidence of lung disease manifested by the varying presence of emphysema, and among non-smokers.
In summary, in a clinical sample of COPD patients with past or current smoking and mild-to-very-severe airflow limitation, CT-quantified emphysema is associated with exercise intolerance, ventilatory inefficiency, impaired gas-exchange, and evidence of exaggerated heart rate response that is independent of airflow limitation, symptom burden, and exacerbation risk. The novel results of our study (1) suggest that emphysema endotyping may add to the multi-dimensional characterization of COPD currently recommended by GOLD, and (2) highlight the need for clinical research targeting emphysema-associated pathophysiology beyond airflow limitation.
Methods
Adults with clinically stable COPD were recruited from the outpatient department of the Montreal Chest Institute. Included participants were 40–79 years of age with at least 10 pack-years of smoking history. Exclusion criteria were exacerbation or change in COPD medication in the preceding 6 weeks, other physician-diagnosed lung disease (any history of asthma, tuberculosis, cancer, cystic fibrosis, or transplant), congestive heart failure, or any other disease considered to be a contraindication to study participation by the treating physician.
The McGill University Health Centre review board approved the study protocol (BMC-7-011). Written informed consent was obtained from all participants. All procedures were performed in accordance with the relevant guidelines and regulations.
Emphysema assessment
Full-lung thoracic CT scans were acquired at suspended maximal inspiration after participant coaching on a single General Electric helical 16 multi-slice scanner using a standardized protocol (matrix 512 × 512; 120 kVp; 40 mA; slice thickness 1.25 mm; pitch 1.375:1). Quantitative CT analysis was performed using the Pulmonary Workstation 2.0 software package (VIDA Diagnostics, Inc., Coralville, IA). The lungs were automatically segmented from the bronchial tree and surrounding chest wall and mediastinal components. The lung volume was calculated from the segmented images. The percent of emphysema-like lung was defined as the percent of lung voxels below −950 Hounsfield units, hereafter referred to as percent emphysema. The depth of inspiration at CT, which is associated with lung density43, was defined as the ratio of lung volume achieved at CT-to-plethysmographic total lung capacity.
Pulmonary function testing
Post-bronchodilator spirometry, body plethysmography, and single breath diffusing capacity for carbon monoxide (DLCO) were performed according to current standards44–46. Predicted spirometry, lung volume and DLCO values were calculated from reference equations47–49.
COPD status and airflow limitation severity were defined according to the 2017 Global Initiative for Chronic Obstructive Lung Disease (GOLD) strategy1. All participants had a post-bronchodilator forced expired volume in 1-sec-to-forced vital capacity ratio (FEV1/FVC) below 0.701. GOLD spirometric grades were defined by FEV1 percent-predicted (GOLD 1: ≥ 80%; 2: 50–79%; 3: 30–49%; 4: < 30%), and GOLD group by the modified Medical Research Council (mMRC) dyspnea rating and exacerbation frequency in the preceding 12 months (GOLD A: mMRC < 2, and exacerbations < 2 with no hospitalization; B: mMRC ≥ 2 and exacerbations < 2 with no hospitalization; C: mMRC < 2, and exacerbations ≥ 2 or hospitalization; D: mMRC ≥ 2 and exacerbations ≥ 2 or hospitalization)1.
Exercise testing
Symptom-limited incremental exercise tests were performed on an electronically-braked cycle ergometer (Vmax EncoreTM, CareFusion) according to guidelines50. After a rest period of at least 6-min, participants performed 1-min of unloaded pedaling (warm-up), followed by stepwise increases in power output (10 W/min) until symptom limitation. Standard cardiopulmonary parameters were collected breath-by-breath, while oxy-hemoglobin saturation and heart rate were monitored by pulse-oximetry (SpO2) and 12-lead electrocardiogram, respectively. Intensity ratings of dyspnea and leg fatigue were assessed using Borg’s modified 0–10 category ratio scale51 at rest and the symptom-limited peak of exercise. Participants also verbalized their main reason(s) for stopping exercise. Peak power output (PPO) and oxygen uptake (Peak) were defined as the average of the last 30-sec of loaded pedaling. Predicted PPO and Peak were calculated from reference equations52. Dyspnea intensity divided by (dyspnea intensity-), and leg fatigue divided by (leg fatigue-) at peak exercise were also calculated.
Throughout exercise , tidal volume (VT), respiratory rate, minute ventilation (), inspiratory and expiratory times (TI, TE, respectively), end-tidal partial pressure of carbon dioxide (PETCO2), SpO2, and O2 pulse ( divided by heart rate) were averaged over the last 30-sec of every 10 W interval of exercise. The slopes of versus carbon dioxide output ( − slope), VT divided by TE versus (VT/TE- slope), and VT divided by TI versus (VT/TI − slope) were calculated as crude estimates of exercise ventilatory efficiency, inspiratory neural drive, and expiratory flow limitation, respectively. The / nadir was defined as the lowest 30-sec average data point observed during symptom-limited incremental exercise.
Covariables
Body height and mass were measured by standardized protocol and body mass index (BMI) calculated as the weight in kilograms divided by height in meters squared. Gender, smoking status, pack-years of smoking, mMRC dyspnea rating, and exacerbation frequency and severity (admission vs no admission) in the prior 12-months were assessed via standardized questionnaire. Axial CT scan images were used to visually map and quantify pectoralis muscle area at the superior aspect of the aortic arch36, and the pulmonary artery and aorta diameters at the level of the main pulmonary artery bifurcation37.
Statistical analysis
Continuous variables are presented as mean ± SD and dichotomous variables as proportions unless otherwise indicated. Percent emphysema was square-root transformed for all regression analyses to obtain normally distributed residuals.
Peak exercise capacity measures (PPO, Peak) were modeled using linear regression with percent emphysema as the predictor of interest. Models were adjusted for age, gender, height, BMI, smoking status, depth of inspiration at CT, smoking status, and airflow limitation severity (GOLD 1–4). The same approach was used to model peak dyspnea intensity- and leg fatigue- ratios.
The impact of percent emphysema on cardiorespiratory exercise responses were assessed by mixed model regression. This analytic approach permits inclusion of all observed time points despite between-subject differences in peak exercise capacity (thus maximizing precision), accounts for within-subject correlations of repeated measures, and allows for covariable adjustment including measures of COPD severity. The multivariable models included the covariables listed above, and an interaction term between percent emphysema and exercise intensity measure. Linear and non-linear terms were explored, and model selection was based on the model with the lowest Akaike information criterion value for each cardiorespiratory response.
Sensitivity analyses adjusted for FEV1 percent predicted as a continuous variable, and GOLD group A-D. Post hoc analyses additionally adjusted for pectoralis muscle area36, and the ratio of pulmonary artery diameter to aorta diameter37. All analyses were performed using SAS 9.4 (Cary, NC). A p-value less than 0.05 was considered statistically significant.
Electronic supplementary material
Acknowledgements
This investigator-initiated study was supported in part by the Quebec Health Research Fund (FRQS), the McGill University Health Centre Research Institute, the Collaborative Innovative Research Fund, and GlaxoSmithKline. The funders had no role in the design, data collection, analysis, manuscript drafting, revisions, or the decision to submit for publication.
Author Contributions
Design, acquisition, analysis, interpretation, drafting, editing and final approval of the manuscript (B.M.S.). Design, acquisition, analysis, interpretation, editing, and final approval of the manuscript (D.J., M.B., A.B., H.C., and J.B.).
Competing Interests
The authors declare no competing interests.
Footnotes
Publisher’s note: Springer Nature remains neutral with regard to jurisdictional claims in published maps and institutional affiliations.
Electronic supplementary material
Supplementary information accompanies this paper at 10.1038/s41598-018-34014-5.
References
- 1.Vogelmeier Claus F., Criner Gerard J., Martinez Fernando J., Anzueto Antonio, Barnes Peter J., Bourbeau Jean, Celli Bartolome R., Chen Rongchang, Decramer Marc, Fabbri Leonardo M., Frith Peter, Halpin David M.G., López Varela M. Victorina, Nishimura Masaharu, Roche Nicolas, Rodriguez-Roisin Roberto, Sin Don D., Singh Dave, Stockley Robert, Vestbo Jørgen, Wedzicha Jadwiga A., Agusti Alvar. Global Strategy for the Diagnosis, Management, and Prevention of Chronic Obstructive Lung Disease 2017 Report: GOLD Executive Summary. European Respiratory Journal. 2017;49(3):1700214. doi: 10.1183/13993003.00214-2017. [DOI] [PubMed] [Google Scholar]
- 2.Pitta F, et al. Characteristics of physical activities in daily life in chronic obstructive pulmonary disease. American journal of respiratory and critical care medicine. 2005;171:972–977. doi: 10.1164/rccm.200407-855OC. [DOI] [PubMed] [Google Scholar]
- 3.Ofir D, Laveneziana P, Webb KA, Lam YM, O’Donnell DE. Mechanisms of dyspnea during cycle exercise in symptomatic patients with GOLD stage I chronic obstructive pulmonary disease. American journal of respiratory and critical care medicine. 2008;177:622–629. doi: 10.1164/rccm.200707-1064OC. [DOI] [PubMed] [Google Scholar]
- 4.Guenette JA, et al. Sex differences in exertional dyspnea in patients with mild COPD: physiological mechanisms. Respiratory physiology & neurobiology. 2011;177:218–227. doi: 10.1016/j.resp.2011.04.011. [DOI] [PubMed] [Google Scholar]
- 5.Elbehairy AF, et al. Pulmonary Gas Exchange Abnormalities in Mild Chronic Obstructive Pulmonary Disease. Implications for Dyspnea and Exercise Intolerance. American journal of respiratory and critical care medicine. 2015;191:1384–1394. doi: 10.1164/rccm.201501-0157OC. [DOI] [PubMed] [Google Scholar]
- 6.Neder JA, et al. Exercise ventilatory inefficiency in mild to end-stage COPD. The European respiratory journal: official journal of the European Society for Clinical Respiratory Physiology. 2015;45:377–387. doi: 10.1183/09031936.00135514. [DOI] [PubMed] [Google Scholar]
- 7.Chin RC, et al. Does the respiratory system limit exercise in mild chronic obstructive pulmonary disease? American journal of respiratory and critical care medicine. 2013;187:1315–1323. doi: 10.1164/rccm.201211-1970OC. [DOI] [PubMed] [Google Scholar]
- 8.Agusti A, Celli B, Faner R. What does endotyping mean for treatment in chronic obstructive pulmonary disease? Lancet. 2017;390:980–987. doi: 10.1016/S0140-6736(17)32136-0. [DOI] [PubMed] [Google Scholar]
- 9.The definition of emphysema. Report of a National Heart, Lung, and Blood Institute, Division of Lung Diseases workshop. Am Rev Respir Dis132, 182–185 (1985). [DOI] [PubMed]
- 10.Gevenois PA, de Maertelaer V, De Vuyst P, Zanen J, Yernault JC. Comparison of computed density and macroscopic morphometry in pulmonary emphysema. American journal of respiratory and critical care medicine. 1995;152:653–657. doi: 10.1164/ajrccm.152.2.7633722. [DOI] [PubMed] [Google Scholar]
- 11.Gevenois PA, et al. Comparison of computed density and microscopic morphometry in pulmonary emphysema. American journal of respiratory and critical care medicine. 1996;154:187–192. doi: 10.1164/ajrccm.154.1.8680679. [DOI] [PubMed] [Google Scholar]
- 12.Oelsner EC, et al. Association between emphysema-like lung on cardiac computed tomography and mortality in persons without airflow obstruction: a cohort study. Ann Intern Med. 2014;161:863–873. doi: 10.7326/M13-2570. [DOI] [PMC free article] [PubMed] [Google Scholar]
- 13.Oelsner EC, et al. Per cent emphysema is associated with respiratory and lung cancer mortality in the general population: a cohort study. Thorax. 2016;71:624–632. doi: 10.1136/thoraxjnl-2015-207822. [DOI] [PMC free article] [PubMed] [Google Scholar]
- 14.Barr RG, et al. Percent emphysema, airflow obstruction, and impaired left ventricular filling. N Engl J Med. 2010;362:217–227. doi: 10.1056/NEJMoa0808836. [DOI] [PMC free article] [PubMed] [Google Scholar]
- 15.Smith BM, et al. Impaired left ventricular filling in COPD and emphysema: is it the heart or the lungs? The Multi-Ethnic Study of Atherosclerosis COPD Study. Chest. 2013;144:1143–1151. doi: 10.1378/chest.13-0183. [DOI] [PMC free article] [PubMed] [Google Scholar]
- 16.Kawut SM, et al. Cor pulmonale parvus in chronic obstructive pulmonary disease and emphysema: the MESA COPD study. J Am Coll Cardiol. 2014;64:2000–2009. doi: 10.1016/j.jacc.2014.07.991. [DOI] [PMC free article] [PubMed] [Google Scholar]
- 17.Hueper K, et al. Pulmonary Microvascular Blood Flow in Mild Chronic Obstructive Pulmonary Disease and Emphysema. The MESA COPD Study. American journal of respiratory and critical care medicine. 2015;192:570–580. doi: 10.1164/rccm.201411-2120OC. [DOI] [PMC free article] [PubMed] [Google Scholar]
- 18.Wakayama K, Kurihara N, Fujimoto S, Hata M, Takeda T. Relationship between exercise capacity and the severity of emphysema as determined by high resolution CT. The European respiratory journal: official journal of the European Society for Clinical Respiratory Physiology. 1993;6:1362–1367. [PubMed] [Google Scholar]
- 19.Lee YK, et al. Quantitative assessment of emphysema, air trapping, and airway thickening on computed tomography. Lung. 2008;186:157–165. doi: 10.1007/s00408-008-9071-0. [DOI] [PubMed] [Google Scholar]
- 20.Yamasawa W, Tasaka S, Betsuyaku T, Yamaguchi K. Correlation of a Decline in Aerobic Capacity with Development of Emphysema in Patients with Chronic Obstructive Pulmonary Disease: A Prospective Observational Study. PLoS One. 2015;10:e0125053. doi: 10.1371/journal.pone.0125053. [DOI] [PMC free article] [PubMed] [Google Scholar]
- 21.Jones JH, et al. Emphysema on Thoracic CT and Exercise Ventilatory Inefficiency in Mild-to-Moderate COPD. Copd. 2017;14:210–218. doi: 10.1080/15412555.2016.1253670. [DOI] [PubMed] [Google Scholar]
- 22.Crisafulli E, et al. Relationships between emphysema and airways metrics at High-Resolution Computed Tomography (HRCT) and ventilatory response to exercise in mild to moderate COPD patients. Respiratory medicine. 2016;117:207–214. doi: 10.1016/j.rmed.2016.06.016. [DOI] [PubMed] [Google Scholar]
- 23.Smith BM, et al. Pulmonary emphysema subtypes on computed tomography: the MESA COPD study. The American journal of medicine. 2014;127:94 e97–23. doi: 10.1016/j.amjmed.2013.09.020. [DOI] [PMC free article] [PubMed] [Google Scholar]
- 24.Paoletti P, et al. Cardiopulmonary exercise testing (CPET) in pulmonary emphysema. Respiratory physiology & neurobiology. 2011;179:167–173. doi: 10.1016/j.resp.2011.07.013. [DOI] [PubMed] [Google Scholar]
- 25.Diaz AA, et al. Relationship of emphysema and airway disease assessed by CT to exercise capacity in COPD. Respiratory medicine. 2010;104:1145–1151. doi: 10.1016/j.rmed.2010.02.023. [DOI] [PMC free article] [PubMed] [Google Scholar]
- 26.Diaz AA, et al. CT and physiologic determinants of dyspnea and exercise capacity during the six-minute walk test in mild COPD. Respiratory medicine. 2013;107:570–579. doi: 10.1016/j.rmed.2012.12.011. [DOI] [PubMed] [Google Scholar]
- 27.Diaz AA, et al. Emphysema and DLCO predict a clinically important difference for 6MWD decline in COPD. Respiratory medicine. 2015;109:882–889. doi: 10.1016/j.rmed.2015.04.009. [DOI] [PubMed] [Google Scholar]
- 28.Andrianopoulos V, et al. Determinants of exercise-induced oxygen desaturation including pulmonary emphysema in COPD: Results from the ECLIPSE study. Respiratory medicine. 2016;119:87–95. doi: 10.1016/j.rmed.2016.08.023. [DOI] [PubMed] [Google Scholar]
- 29.Kirby M, et al. COPD: Do Imaging Measurements of Emphysema and Airway Disease Explain Symptoms and Exercise Capacity? Radiology. 2015;277:872–880. doi: 10.1148/radiol.2015150037. [DOI] [PubMed] [Google Scholar]
- 30.Wagner PD, Dantzker DR, Dueck R, Clausen JL, West JB. Ventilation-perfusion inequality in chronic obstructive pulmonary disease. J Clin Invest. 1977;59:203–216. doi: 10.1172/JCI108630. [DOI] [PMC free article] [PubMed] [Google Scholar]
- 31.Burrows B, Fletcher CM, Heard BE, Jones NL, Wootliff JS. The emphysematous and bronchial types of chronic airways obstruction. A clinicopathological study of patients in London and Chicago. Lancet. 1966;1:830–835. doi: 10.1016/S0140-6736(66)90181-4. [DOI] [PubMed] [Google Scholar]
- 32.Chaouat A, et al. Severe pulmonary hypertension and chronic obstructive pulmonary disease. American journal of respiratory and critical care medicine. 2005;172:189–194. doi: 10.1164/rccm.200401-006OC. [DOI] [PubMed] [Google Scholar]
- 33.Adir Y, Shachner R, Amir O, Humbert M. Severe pulmonary hypertension associated with emphysema: a new phenotype? Chest. 2012;142:1654–1658. doi: 10.1378/chest.11-2816. [DOI] [PubMed] [Google Scholar]
- 34.Sanders KJC, Klooster K, Vanfleteren L, Slebos DJ, Schols A. CT-derived muscle remodelling after bronchoscopic lung volume reduction in advanced emphysema. Thorax. 2018 doi: 10.1136/thoraxjnl-2018-211931. [DOI] [PubMed] [Google Scholar]
- 35.Vanfleteren LE, et al. Clusters of comorbidities based on validated objective measurements and systemic inflammation in patients with chronic obstructive pulmonary disease. Am J Respir Crit Care Med. 2013;187:728–735. doi: 10.1164/rccm.201209-1665OC. [DOI] [PubMed] [Google Scholar]
- 36.McDonald ML, et al. Quantitative computed tomography measures of pectoralis muscle area and disease severity in chronic obstructive pulmonary disease. A cross-sectional study. Annals of the American Thoracic Society. 2014;11:326–334. doi: 10.1513/AnnalsATS.201307-229OC. [DOI] [PMC free article] [PubMed] [Google Scholar]
- 37.Wells JM, et al. Pulmonary arterial enlargement and acute exacerbations of COPD. N Engl J Med. 2012;367:913–921. doi: 10.1056/NEJMoa1203830. [DOI] [PMC free article] [PubMed] [Google Scholar]
- 38.Iyer KS, et al. Quantitative Dual-Energy Computed Tomography Supports a Vascular Etiology of Smoking-induced Inflammatory Lung Disease. American journal of respiratory and critical care medicine. 2016;193:652–661. doi: 10.1164/rccm.201506-1196OC. [DOI] [PMC free article] [PubMed] [Google Scholar]
- 39.Bhatt SP, et al. beta-Blockers for the prevention of acute exacerbations of chronic obstructive pulmonary disease (betaLOCK COPD): a randomised controlled study protocol. BMJ Open. 2016;6:e012292. doi: 10.1136/bmjopen-2016-012292. [DOI] [PMC free article] [PubMed] [Google Scholar]
- 40.Yang L, et al. Mechanisms of Vascular Dysfunction in COPD and Effects of a Novel Soluble Epoxide Hydrolase Inhibitor in Smokers. Chest. 2017;151:555–563. doi: 10.1016/j.chest.2016.10.058. [DOI] [PMC free article] [PubMed] [Google Scholar]
- 41.O’Donnell DE, D’Arsigny C, Fitzpatrick M, Webb KA. Exercise hypercapnia in advanced chronic obstructive pulmonary disease: the role of lung hyperinflation. Am J Respir Crit Care Med. 2002;166:663–668. doi: 10.1164/rccm.2201003. [DOI] [PubMed] [Google Scholar]
- 42.Gagnon P, et al. Influences of spinal anesthesia on exercise tolerance in patients with chronic obstructive pulmonary disease. Am J Respir Crit Care Med. 2012;186:606–615. doi: 10.1164/rccm.201203-0404OC. [DOI] [PubMed] [Google Scholar]
- 43.Gevenois PA, et al. The effects of age, sex, lung size, and hyperinflation on CT lung densitometry. AJR Am J Roentgenol. 1996;167:1169–1173. doi: 10.2214/ajr.167.5.8911175. [DOI] [PubMed] [Google Scholar]
- 44.Miller MR, et al. Standardisation of spirometry. The European respiratory journal: official journal of the European Society for Clinical Respiratory Physiology. 2005;26:319–338. doi: 10.1183/09031936.05.00034805. [DOI] [PubMed] [Google Scholar]
- 45.Wanger J, et al. Standardisation of the measurement of lung volumes. The European respiratory journal: official journal of the European Society for Clinical Respiratory Physiology. 2005;26:511–522. doi: 10.1183/09031936.05.00035005. [DOI] [PubMed] [Google Scholar]
- 46.Macintyre N, et al. Standardisation of the single-breath determination of carbon monoxide uptake in the lung. The European respiratory journal: official journal of the European Society for Clinical Respiratory Physiology. 2005;26:720–735. doi: 10.1183/09031936.05.00034905. [DOI] [PubMed] [Google Scholar]
- 47.Hankinson JL, Odencrantz JR, Fedan KB. Spirometric reference values from a sample of the general U.S. population. American journal of respiratory and critical care medicine. 1999;159:179–187. doi: 10.1164/ajrccm.159.1.9712108. [DOI] [PubMed] [Google Scholar]
- 48.Crapo RO, Morris AH. Standardized single breath normal values for carbon monoxide diffusing capacity. Am Rev Respir Dis. 1981;123:185–189. doi: 10.1164/arrd.1981.123.2.185. [DOI] [PubMed] [Google Scholar]
- 49.Crapo RO, Morris AH, Clayton PD, Nixon CR. Lung volumes in healthy nonsmoking adults. Bull Eur Physiopathol Respir. 1982;18:419–425. [PubMed] [Google Scholar]
- 50.American Thoracic, S. & American College of Chest, P. ATS/ACCP Statement on cardiopulmonary exercise testing. American journal of respiratory and critical care medicine167, 211–277, 10.1164/rccm.167.2.211 (2003). [DOI] [PubMed]
- 51.Borg GA. Psychophysical bases of perceived exertion. Med Sci Sports Exerc. 1982;14:377–381. [PubMed] [Google Scholar]
- 52.Jones NL, Makrides L, Hitchcock C, Chypchar T, McCartney N. Normal standards for an incremental progressive cycle ergometer test. Am Rev Respir Dis. 1985;131:700–708. doi: 10.1164/arrd.1985.131.5.700. [DOI] [PubMed] [Google Scholar]
Associated Data
This section collects any data citations, data availability statements, or supplementary materials included in this article.