Abstract
Objectives:
To evaluate the possible value of the perfusion index (PI) as a tool for pain assessment.
Methods:
This prospective, observational study was performed with 89 patients underwent surgery with general anesthesia. The patients with visual analog scale (VAS)>3 were grouped as M1, and patients with VAS≤3 and performed morphine were grouped as M2. After surgery patients with VAS>3 were given 2mg morphine. Patients with VAS>3 were given increments of intravenous morphine (2 mg) at 20 minute intervals until VAS<3. The correlation and difference between PI and VAS score values were evaluated before and after analgesic administration.
Results:
Significant changes were found in both PI values and VAS scores between M1 and M2 groups (2.80±0.77, 3.97±0.94, p<0.001; 6.60±1.20, 2.74±0.46, p<0.001) Despite no correlation was found between PI values and VAS scores of M1 and M2 groups, weak negative correlation was detected between differences in PI values and VAS scores among groups (r=-0.255, p=0.016).
Conclusion:
Perfusion index is a parameter that can be used in the assessment of postoperative pain and responses to analgesics.
Pain is an emotional condition that causes an increase in sympathetic tone.1 Pain develop due to surgical incisions and invasive procedures in the postoperative period. The onset of excruciating pain, via an increase in stress hormones, causes deterioration to increases the demand for oxygen and vasoconstriction.2
Patients’ pain should be evaluated correctly for timely treatment of postoperative pain. Scales such as the VAS and numeric rating scale (NRS) are used to assess pain intensity postoperatively. In order to use these scales, patients need to be able to understand what is said to them and to express themselves.3 But this can not be carried out for individuals with communication problems. Detection of the relationship between the PI and pain may enable the assessment of these patients’ pain.
The peripheral PI is derived from the photoelectric plesthysmographic signal of pulse oximetry and the rate of pulsatile flow (arterial component) to non-pulsatile flow (other tissues). Changes in the pulsatile flow point to changes in the peripheral perfusion.4 These changes occur due to changes in the arterial and venous vascular tone.5 The relationship between pain and PI is the base of our hypothesis in this study. Studies exploring the relationship between the peripheral PI and pain in postoperative patients are very limited, and the effects of pain on the PI have not been fully examined.6,7 The PI can be a noninvasive and easy method that can be used in evaluating pain and monitoring the effectiveness of analgesia. Our aim in this study is to evaluate the relationship between pain and the PI, and to show that the PI can be used to monitor pain in postoperative patients.
Methods
A prospective, observational study was performed in Gaziosmanpasa University Hospital in Tokat, Turkey, after obtaining the approval of the Ethical Committee (17-KAEK-007) and registering with clinicaltrials.gov (Grant number: NCT03151369). This study was performed in patients that underwent surgery in Gaziosmanpasa University Hospital in Tokat, Turkey, from April 2017 to February 2018. This study was conducted according to the principles declaration of Helsinki and all patients provided written consent. Patients included in the study were 18-65 years of age, American Society of Anesthesiologists (ASA) score of 1-2, grade 2-3 surgeries including cystoscopy, arthroscopy, inguinal hernia repair, and hysterectomy, operated in elective requirements under general anesthesia, and were able to communicate and cooperate with the medical staff. Patients with cardiac, respiratory, neurological, and psychiatric problems, patients with chronic pain complaints and morphine contraindications; systolic blood pressure (SBP)<100 mmHg and respiration rate (RR)<10/min, were excluded from the study.
General anesthesia induction was performed intravenously (IV) with 1mcg/kg of fentanyl, 2mg/kg propofol, 0.6mg/kg rocuronium bromide, and a volatile anesthetic sevoflurane. The patients were intubated (endotracheal tube or supraglottic airways). One minimum alveolar concentration (MAC) and a 50/50 O2 Air mixture was used in the maintenance of the anesthesia. These patients had operations under general anesthesia and were given 0.01mg/kg morphine intraoperatively. At the end of the operation, patients were extubated in the operating room and were taken to the recovery room.
All patients that were taken to the recovery room after surgery were monitored by electrocardiogram, pulse oximetry, and automatic noninvasive blood pressure (NIBP). Pain severity was measured by the VAS (0=for no pain at all and 10=for the worst imaginable pain). Sato et al,8 showed that PI is a significant tool to assess stress response in patients with laparoscopic surgery under remifentanyl anesthesia. The PI values of the right index finger with a Masimo pulse co-oximeter probe (Radical 7 pulse co-oximetry; Masimo Corporation, Irvine, California, USA) of these patients were also recorded. After surgery patients with an Aldrete recovery score>10 and VAS value≥3 were classified as Group M1. These patients were given 2mg morphine. After 20 minutes, the pain was assessed again. This procedure was repeated until VAS<3 and PI, blood pressure, pulse, and respiratory rate values of these patients after morphine were categorized as Group M2. At the end of the study with changes between pre-analgesic and post-analgesic values of PI, VAS, blood pressure, heart rate, respiratory rate, and correlation both intragroup and intergroup of PI and VAS score differences were evaluated. The aim of this study is to show the relationship between PI and pain intensity.
A pilot study was conducted in postoperative patients on March 2017 and revealed a PI value of 2.7±1.3, and assuming an increase by 15% on this value after morphine administration (accepting type I error of 0.05 and a power of 0.80) showed that a total of 83 patients were required to find a statistically significant difference (http://clincalc.com/stats/samplesize.aspx).9
Qualitative values are expressed as mean and standart deviation, where qualitative data are presented as a percentage. Kolmogorov-Smirnov test was performed to test the normality of the data. Relationship between VAS and PI before and after morphine administration were analyzed using Pearson correlation analysis. Paired-samples T-test was used to compare the VAS and PI differences before and after morphine administration. Data analysis was performed by Statistical Package for Social Sciences (SPSS) version 20.0 (IBM Corp., Armonk, NY, USA). A p-value<0.05 was considered significant.
Results
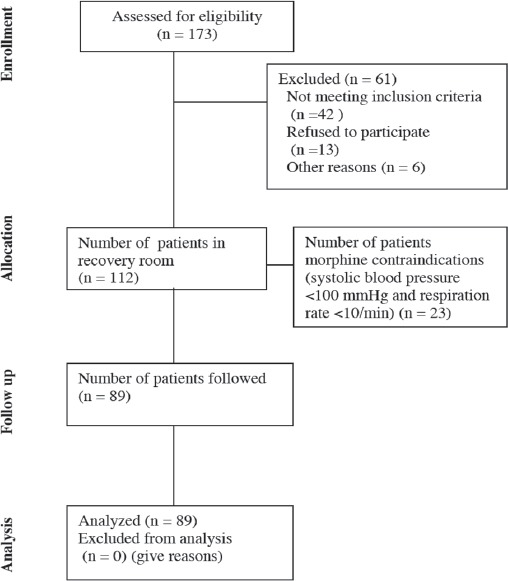
The study included 89 patients who met the study criteria (Figure 1).
Figure 1.

Flow chart of 89 patients who met the study criteria
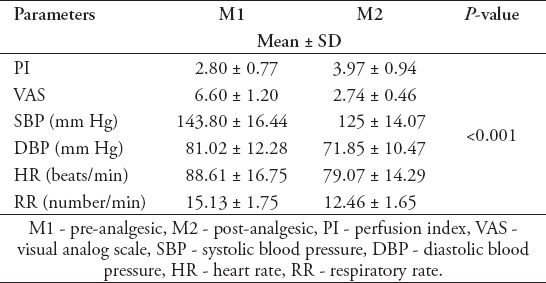
Table 1 shows the ages of the patients (43.31±14.40), gender distribution of the patients (65 women and 24 men), and detected minimum and maximum values of PI, VAS, blood pressure, heart rate, and respiration rate of these patients. Axillary body temperatures of patients were measured: 35.78±0.22 for M1 and 36.01±0.31 for M2 (p>0.05).
Table 1.
Demographic data and patient characteristics, gender (N=65/24).

There was a statistically significant difference between pre-analgesic (M1) and post-analgesic (M2), PI values (2.80±0.77, 3.97±0.94, p<0.001). Similarly, there was a significant statistical difference between the VAS scores (6.60±1.20, 2.74±0.46, p<0.001). Significant differences have been detected between M1 (pre-analgesic) and M2 (post-analgesic) SBP=143.80±16.44, 125.92±14.07, p<0.001, diastolic blood pressure(DBP)=81.02±12.28, 71.85±10.47, p<0.001, heart rate (HR)=88.61±16.75, 79.07±14.29, p<0.001, and RR=15.13±1.75, 12.46±1.65, p<0.001(Table 2).
Table 2.
The measured parameter at M1 and M2, and their differences between M1 and M2.

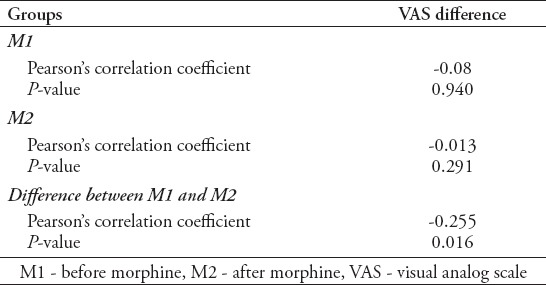
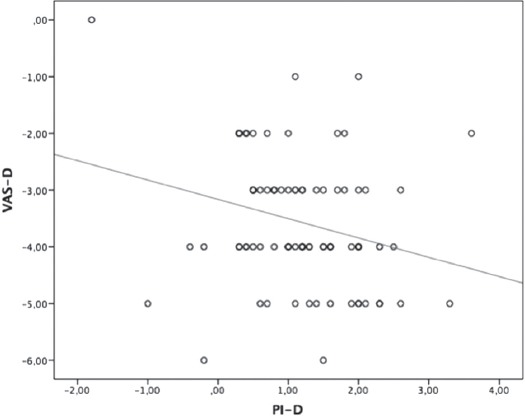
There was no correlation between PI-VAS values in M1 (r=-0.08, p=0.940) and between PI-VAS values in M2 (r=-0.113, p=0.291 (Table 3). The weak negative correlation has been found between the values PI-D (PIM1-PIM2) and VAS-D (VASM1-VASM2) (r=-0.255, p=0.016 (Figure 2).
Table 3.
Correlation of the differences in the visual analog scale (N=89).

Figure 2.

Correlation between the values VAS-D and PI-D. VAS - visual analog scale, VAS-D - VAS value of M1-VAS valueof M2, PI - perfusion index, PI-D - PI value of M1-PI value of M2, (p=0.016, r=-0.255).
Discussion
We found a significant difference between pre-analgesic and post-analgesic PI values, and VAS scores.
New generation pulse oximeters, such as Massimo, provide reliable measurement opportunities for physicians regardless of hypotension, hypothermia, and patient motion. Signals vary depending on the blood flow with this technology rather than oxygen saturation. The PI is the ratio of pulsatile flow to non-pulsatile flow in the monitored side. Therefore, changes in the vascular tone affect the PI.10
There are multiple studies available exploring the relationship between PI and pain and found that a PI decrease occurs due to painful stimulus.6 Similarly, in a different study that evaluated changes in the PI due to painful noxious electrical stimulation on 70 healthy volunteers revealed a PI decrease due to the painful stimulation.11 Hasanin et al,12 reported that there is a difference between PI values, SBP, DBP, HR, and pain intensity before and after the pain created by positioning the intensive care unit (ICU) patients. Although these findings are consistent with our results, there is a difference between the scales that assess patients’ pain severity. While the VAS used in our study was based on patients’ own statements, behavioral pain scale-non-intubated (BPS-NI) that has been used in the other study is based on patients’ facial expressions, upper limb movement, and changes in mechanical ventilator compliance due to pain stimulation. Similar to the study carried out by Hasanin et al,12 there was no correlation detected between intergroup PI values and severity of pain. In our study we would have expected a correlation between PI-VAS values in M1 and in M2. However no difference was detected. This difference may not appear due to the fact that PI and VAS values are very close to each other.
Unlike pain, most anesthetic procedures produce vasodilation. It is known that a successful peripheral block causes sympathetic nerves to be blocked and in the same side extremity, vasodilation, and temperature rise occur. In previous studies, the PI has been recognized as a useful technique in the assessment of block effectiveness in regional anesthesia.13,14 In fact, evidence of a PI increase due to vasodilation by regional anesthesia in these studies supports the PI decrease due to pain which has a vasoconstrictive effect. The PI indicates the ratio of pulsatile flow to non-pulsatile flow and it affects vascular tone. Depending on the pain, the autonomic nervous system is activated, causing vasoconstriction.6 Hamunen et al,15 showed that pain causes autonomic nervous system activation and increased heart rate. It has been shown in this study that the PI decreases as the severity of pain increases; conversely, with analgesics applied, the PI increases due to a decrease in pain. It has been shown that autonomic activation decreases due to the use of analgesic, and there is a difference between pre-analgesic and post-analgesic PI. Perfusion index is an indicator of peripheral circulation. Pain particularly after surgery may disrupt peripheral circulation thus leading delayed recovery. This situation can be evident in patients with critical condition or communication problems.
One limitation of this study was that sedation scores could be inspected in this study. However, some studies have shown that pain intensity is conveyed to brainstem regardless of sedation degree.16 Besides, the sedative effect of morphine is apparent in high doses which is over 10mg.17 The mean morphine dose was 3.1±1.6mg.
In conclusion, this study showed the relation between PI and pain intensity; that the increase in pain intensity causes higher PI values.
Acknowledgment
The authors would like to thank Scribendi (www.scribendi.com) for the English language editing.
Footnotes
References
- 1.Ahmad AH, Zakaria R. Pain in Times of Stress. Malays J Med Sci. 2015;22:52–61. [PMC free article] [PubMed] [Google Scholar]
- 2.Sigakis MJ, Bittner EA. Ten Myths and Misconceptions Regarding Pain Management in the ICU. Crit Care Med. 2015;43:2468–2478. doi: 10.1097/CCM.0000000000001256. [DOI] [PubMed] [Google Scholar]
- 3.Fillingim RB, Loeser JD, Baron R, Edwards RR. Assessment of Chronic Pain: Domains, Methods, and Mechanisms. J Pain. 2016;17:T10–T20. doi: 10.1016/j.jpain.2015.08.010. [DOI] [PMC free article] [PubMed] [Google Scholar]
- 4.Lima A, Bakker J. Clinical monitoring of peripheral perfusion: there is more to learn. Crit Care. 2014;18:113. doi: 10.1186/cc13738. [DOI] [PMC free article] [PubMed] [Google Scholar]
- 5.Rasmy I, Mohamed H, Nabil N, Abdalah S, Hasanin A, Eladawy A, et al. Evaluation of Perfusion Index as a Predictor of Vasopressor Requirement in Patients with Severe Sepsis. Shock. 2015;44:554–559. doi: 10.1097/SHK.0000000000000481. [DOI] [PubMed] [Google Scholar]
- 6.Raouf Mohameda SA, Mohameda NN, Rashwanb D. Pulse co-oximetry perfusion index as a tool for acute postoperative pain assessment and its correlation to visual analogue pain score. Research and Opinion in Anesthesia & Intensive Care. 2015;2:62–67. [Google Scholar]
- 7.van Genderen ME, Paauwe J, de Jonge J, van der Valk RJ, Lima A, Bakker J, et al. Clinical assessment of peripheral perfusion to predict postoperative complications after major abdominal surgery early: a prospective observational study in adults. Crit Care. 2014;18:R114. doi: 10.1186/cc13905. [DOI] [PMC free article] [PubMed] [Google Scholar]
- 8.Sato M, Kurosawa A, Sasakawa T, Kunisawa T, Takahata O, Iwasaki H. [Evaluation of the Effects of Remifentanil Doses on Hemodynamics and Perfusion Index at the Onset of Pneumoperitoneum during Laparoscopic Surgery] Masui. 2016;65:573–577. [Japanese] [PubMed] [Google Scholar]
- 9.ClinCalc LLC. Sample Size Calculator. Determines the minimum number of subjects for adequate study power. [[cited 2018]]. Available from URL: http://clincalc.com/stats/samplesize.aspx .
- 10.Kowalczyk M, Fijalkowska A, Nestorowicz A. New-generation pulse oximetry for the assessment of peripheral perfusion during general anesthesia–a comparison between propofol and desflurane. Anesthesiol Intensive Therapy. 2013;45:138–144. doi: 10.5603/AIT.2013.0029. [DOI] [PubMed] [Google Scholar]
- 11.Nishimura T, Nakae A, Shibata M, Mashimo T, Fujino Y. Age-related and sex-related changes in perfusion index in response to noxious electrical stimulation in healthy subjects. J Pain Res. 2014;7:91–97. doi: 10.2147/JPR.S57140. [DOI] [PMC free article] [PubMed] [Google Scholar]
- 12.Hasanin A, Mohamed SAR, El-Adawy A. Evaluation of perfusion index as a tool for pain assessment in critically ill patients. J Clin Monit Comput. 2017;31:961–965. doi: 10.1007/s10877-016-9936-3. [DOI] [PubMed] [Google Scholar]
- 13.Yamazaki H, Nishiyama J, Suzuki T. Use of perfusion index from pulse oximetry to determine efficacy of stellate ganglion block. Local Reg Anesth. 2012;5:9–14. doi: 10.2147/LRA.S30257. [DOI] [PMC free article] [PubMed] [Google Scholar]
- 14.Abdelnasser A, Abdelhamid B, Elsonbaty A, Hasanin A, Rady A. Predicting successful supraclavicular brachial plexus block using pulse oximeter perfusion index. Br J Anaesth. 2017;119:276–280. doi: 10.1093/bja/aex166. [DOI] [PubMed] [Google Scholar]
- 15.Hamunen K, Kontinen V, Hakala E, Talke P, Paloheimo M, Kalso E. Effect of pain on autonomic nervous system indices derived from photoplethysmography in healthy volunteers. Br J Anaesth. 2012;108:838–844. doi: 10.1093/bja/aes001. [DOI] [PubMed] [Google Scholar]
- 16.Kang H, Nakae A, Ito H, Vitayaburananont P, Minamoto T, Ikeda T, et al. Effects of sedation on subjective perception of pain intensity and autonomic nervous responses to pain: A preliminary study. PLoS One. 2017;12:e0183635. doi: 10.1371/journal.pone.0183635. [DOI] [PMC free article] [PubMed] [Google Scholar]
- 17.Aubrun F, Mazoit JX, Riou B. Postoperative intravenous morphine titration. Br J Anaesth. 2012;108:193–201. doi: 10.1093/bja/aer458. [DOI] [PubMed] [Google Scholar]


