

SUMMARY
Targeting autophagy in cancer cells and in the tumor microenvironment are current goals of cancer therapy. However, components of canonical autophagy play roles in other biological processes, adding complexity to this goal. One such alternative function of autophagy proteins is LC3-associated phagocytosis (LAP), which functions in phagosome maturation and subsequent signaling events. Here we show that impairment of LAP in the myeloid compartment, rather than canonical autophagy, induces control of tumor growth by tumor-associated macrophages (TAM) upon phagocytosis of dying tumor cells. Single cell RNAseq analysis revealed that defects in LAP induce pro-inflammatory gene expression and trigger STING-mediated type I interferon responses in TAM. We found that the anti-tumor effects of LAP impairment require tumor-infiltrating T cells, dependent upon the STING and the type I interferon response. Therefore, autophagy proteins in the myeloid cells of the tumor microenvironment contribute to immune suppression of T lymphocytes by effecting LAP.
Keywords: LC3-associated phagocytosis, autophagy, tumor-associated macrophages, tumor microenvironment, type I interferon, macrophage polarization, efferocytosis, immune tolerance, STING
Graphical Abstract

INTRODUCTION
The role of autophagic processes in tumor cells and in the heterogeneous components of the tumor microenvironment, such as stromal, endothelial, and immune cells, is complex, most likely reflecting the intricate network of the spatiotemporal interactions between the different cell types (Amaravadi et al., 2016; Kimmelman and White, 2017). In early stages of tumorigenesis, autophagy plays a protective role against the emergence of malignant cells (Guo et al., 2013), possibly by different mechanisms, such as suppression by p62 of tumor promoting signals, protection against genomic stability, and control of early infiltration of regulatory T cells (Mathew et al., 2009; Mathew et al., 2007; Rao et al., 2014). However, the same components of the autophagy machinery can facilitate tumor progression at later times (Rao et al., 2014). Autophagy in the tumor microenvironment can provide essential nutrients, amino acids, and nucleotides to the tumor, facilitating tumor growth (Sousa et al., 2016).
Previously, we and others demonstrated that a non-canonical function of autophagy proteins, LC3-associated phagocytosis (LAP), couples the processing of engulfed particles, including pathogens, immune complexes, and dying cells, to regulation of macrophage immune responses (Henault et al., 2012; Martinez et al., 2011; Martinez et al., 2016; Martinez et al., 2015). During LAP, recruitment of components of the autophagy machinery to the phagosome catalyzes the lipidation of LC3/GABARAP-family proteins (herein, “LC3”) to phosphatydilethanolamine in the phagosomal membrane and induces phagosome maturation and cargo degradation (Martinez et al., 2015; Sanjuan et al., 2007). LAP is induced by engagement, at the phagosome, of TLR 1/2, TLR2/6, or TLR4 (Sanjuan et al., 2007), Fc-receptors (Henault et al., 2012; Huang et al., 2009), and the apoptotic cell receptor, TIM4 (Martinez et al., 2011). Unlike canonical autophagy, LAP does not require the components of the pre-initiation complex that trigger autophagy in response to nutrient stress (ULK1, FIP200, ATG13) but requires a unique Beclin-1 (BECN1) and VPS34 initiation complex that lacks ATG14 but contains Rubicon (RUBCN) (Florey et al., 2011; Martinez et al., 2011; Martinez et al., 2015).
LAP occurs in macrophages (Sanjuan et al., 2007), conventional dendritic cells (Martinez et al., 2016), plasmacytoid dendritic cells (Henault et al., 2012), and epithelial cells (Florey et al., 2011; Kim et al., 2013). LAP has been implicated in innate immune responses to different classes of pathogens (Sarkar, et al, 2017; Chu, et al., 2017; Martinez, et al., 2015; Tam, et al., 2014) and in effective recycling of all-trans retinoic acid from shed photoreceptors in the retinal pigment epithelium (Kim et al., 2013). LAP functions in the engulfment of dying (Martinez et al., 2011) and living (Florey et al., 2011) cells, and defects in this activity promote a lupus-like condition (Martinez et al., 2016). Engagement of LAP suppresses inflammatory responses upon engulfment of dying cells in vitro (Martinez et al., 2011) and in vivo (Martinez et al., 2016).
Here we sought to determine the importance of autophagic processes in the myeloid compartment of the tumor microenvironment by genetically ablating several autophagy components. We found that deficiency in components of LAP, but not canonical autophagy, specifically in myeloid cells, restricts tumor growth. We observed that LAP regulates the polarization of tumor-associated macrophages (TAM) towards immunosuppressive functions, and inhibits a STING-dependent type I interferon response in TAM, which is required for anti-tumor effects of LAP impairment. The effects of LAP deficiency on tumor growth were associated with increased activation of T lymphocytes in the tumor microenvironment, and depletion of T cells negated the anti-tumor effects. Therefore, the regulation of myeloid cell function by LAP suppresses T cell function, thereby promoting tumor growth.
RESULTS
LAP in myeloid cells promotes tumor growth
To discriminate between the roles of LAP and canonical autophagy in tumor-infiltrating macrophages, we employed conditional ablation of several genes using lysozyme M (LysM/Lyz2)-Cre-lox recombination, which affects monocytes, macrophages, and CD11b+ dendritic cells but not CD11c+ dendritic cells or T cells (Abram et al., 2014; Martinez et al., 2016). Previously, we demonstrated that myeloid cells in mice in which Beclin-1 (BECN1), VPS34, ATG5, ATG7, or ATG16L1 were ablated by this approach lack both conventional autophagy and LAP in response to TLR engagement (Martinez et al., 2015) or engulfment of dying cells (Martinez et al., 2016) (Fig. S1A, B). In contrast, myeloid cells deficient in FIP200, ULK1, or ATG14 lack autophagy but are fully competent for LAP, while such cells from animals deficient for Rubicon (RUBCN) or NADPH oxidase 2 (NOX2) lack LAP but not autophagy (Fig. S1A, B) (Martinez et al., 2015).
We observed that the growth of subcutaneously engrafted murine B16F10 melanoma was suppressed in LysM-Cre+ Becn1f/f and Atg5f/f immunocompetent C57BL/6 mice (Fig. 1 A). This protective effect was also observed in LAP-deficient Rubcn−/− mice but not in LAP-sufficient LysM-Cre+ Fip200f/f or Atg14f/f animals (Fig. 1A). Similar results were obtained with engraftment of Lewis lung carcinoma (LLC, Fig. 1B) or MC38 adenocarcinoma (Fig. S1C). Notably, deficiency in several components of LAP (VPS34, ATG5, ATG7, ATG16L1, RUBCN and NOX2) also reduced growth of B16 melanoma in the lungs following intravenous injection of the tumor cells, an effect not observed in the absence of proteins required for canonical autophagy (ULK1, FIP200, ATG14) (Fig. 1C).
Figure 1. LAP in myeloid cells promotes tumor growth.

A. Tumor growth in wild-type and deficient littermates subcutaneously injected with B16F10 cells (Atg14f/f Cre− n=3, Cre+ n=4 mice/ Fip200f/f Cre− n=4, Cre+ n=6 mice/ Becn1f/f Cre− n=4, Cre+ n=5 mice/ Atg5f/f Cre− n=4, Cre+ n=5 mice/ Rubcn+/+ n=7, Rubcn− /− n=4 mice). Color scheme represents autophagy-deficient, LAP-sufficient (red), autophagy-deficient, LAP-deficient (green) and autophagy-sufficient, LAP-deficient (blue) mice.
B. Tumor growth in wild-type and deficient littermates subcutaneously injected with LLC cells (Fip200f/f Cre− n=7, Cre+ n=10 mice/ Becn1f/f Cre− n=4, Cre+ n=4 mice/ Atg7f/f Cre− n=4, Cre+ n=5 mice/ Rubcn+/+ n=3, Rubcn−/− n=4 mice). Colors as in (A).
A-B. Data are expressed as mean ±SEM. Significance was calculated with ANOVA. Data are representative of two independent experiments per genotype.
C. Micrometastatic lesions on the lungs of wild-type and deficient littermate mice intravenously injected with B16F10 cells. Data are pooled from two separate experiments. Dots represent the total number of lesions per mouse, line indicates mean ±SEM. Significance was calculated with Student’s t-test. Colors as in (A).
D. Schematic of the K-rasLSL-G12D, p53f/f bone-marrow chimeric mice transplanted with bone-marrow cells from either Rubcn+/+ or Rubcn−/− donor mice.
E. Quantification of tumor burden by MRI (expressed as % of total lobe volume) in K-rasLSL-G12D, p53f/f chimeras inoculated with Adv-cre. Data are pooled from two separate experiments. Dots represent data for each individual mouse (n= 10 mice per genotype), line indicates mean ±SEM. Significance was calculated using Student’s t-test.
F. Representative MRI images from the left lung lobe of the indicated K-rasLSL-G12D, p53f/f bone-marrow chimera.
G. Representative micrographs of H&E staining of the right lung cranial lobe for the indicated K-rasLSL-G12D, p53f/f bone-marrow chimera. Scale bar = 1 mm.
*p<0.05, **p<0.01, ***p<0.001, ****p<0.0001.
See also Figure S1.
Because some components of the autophagy pathway, not involved in LAP, failed to compromise tumor growth, we examined the impact of the deletions on canonical autophagy, using accumulation of p62 as a marker of defective autophagy (Pankiv et al., 2007) (Fig. S1B). Further, we confirmed that LysM-Cre reduced protein expression of each conditionally targeted gene (Fig. S1B). Other than RUBCN, which, as expected, is not required for autophagy (Matsunaga et al., 2009; Zhong et al., 2009), myeloid cells lacking any components required for autophagy displayed elevated p62 levels. Therefore, the failure of deletion of some autophagy components (e.g., FIP200, ATG14) to impact tumor growth is not a result of a failure to compromise canonical autophagy in myeloid cells.
To extend these findings to a genetic model of tumorigenesis, we employed animals expressing one copy of a loxp-STOP-loxp (LSL) oncogenic mutant K-ras (K-rasLSL-G12D) transgene in combination with conditional ablation of p53 (p53f/f) to induce non-small-cell lung carcinoma (NSCLC) by Cre mediation recombination (DuPage et al., 2009; Johnson et al., 2001). Mice were transplanted with Rubcn+/+ or Rubcn−/− bone marrow, and subsequently subjected to inhalation of adenovirus particles expressing Cre (Adv-Cre) (Fig. 1D). As in the heterotopic tumor models, ablation of RUBCN in the hematopoietic compartment compromised tumor growth in this system (Fig. 1E–G).
Several components of the autophagy pathway (e.g., BECN1, VPS34, UVRAG) have roles in endosome trafficking (Itakura et al., 2008; Jaber et al., 2012; Jaber et al., 2016; McKnight et al., 2014) . As RUBCN is a component of this complex in LAP (Martinez, et al., 2015), we examined several types of endosome formation and function. Lack of RUBCN in macrophages had no effect on endocytosis of transferrin or immune complexes (Fig. S1D–F), macropinocytosis of dextran (Fig. S1G), endosome maturation (Fig. S1H), or degradation of EGFR (Fig. S1I). Therefore, based on the role of RUBCN and the pattern of requirement (or not) of autophagy proteins, our results support the conclusion that LAP, but not canonical autophagy, in myeloid cells promotes solid tumor growth.
LAP regulates TAM function
Tumor-infiltrating macrophages (TAM) are a heterogeneous population mostly derived from recruited Ly-6Chi Ly-6G− circulating monocytes (also known as monocytic myeloid-derived suppressor cells, Mo-MDSC (Movahedi et al., 2008)) that express MHC-II upon maturation (Movahedi et al., 2010) (Fig. S2). LAP or autophagy deficiency in the myeloid compartment did not alter overall infiltration of myeloid cells (CD45+ CD11b+), granulocytic MDSC (PMN-MDSC (Movahedi et al., 2008), CD11b+ Ly-6G+ Ly-6Cint) or Mo-MDSC (CD11b+ Ly-6G− Ly-6Chigh) (Fig. 2 A–C). However, ubiquitous RUBCN deficiency or ablation of LAP in myeloid cells increased surface expression of the inflammatory marker CD86 (Murray et al., 2014) in mature Ly6C− MHC-II+ TAM (Fig. 2D). In contrast, surface expression of CD206 (Mrc1), a marker associated with anti-inflammatory, or M2 (Stein et al., 1992) (Murray et al., 2014), macrophage activation was reduced in the LAP-deficient mature TAM (Fig. 2 E). A similar effect was observed in the K-rasLSL-G12D p53f/f chimeras (Fig. 1D), where expression of CD206 was decreased in TAM from recipients of RUBCN-deficient versus -sufficient bone marrow, without differences in the number of TAM in the tumors (Fig. 2F–I). These results suggest that LAP regulates TAM polarization into anti-inflammatory M2 cells.
Figure 2. LAP regulates TAM function.
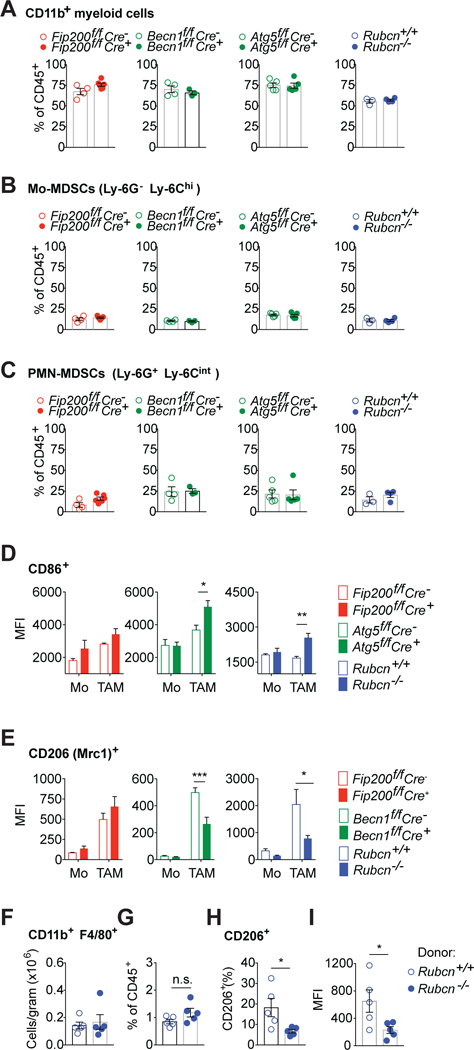
A-C. Percentage of total (A), monocytic (B) and granulocytic (C) myeloid cells within the CD45+ population of tumor infiltrating cells isolated from LLC tumors engrafted in Rubcn−/−, Fip200f/f Cre+, Becn1f/f Cre+, Atg7f/f Cre+ and respective littermate controls, estimated by flow cytometry. Data are expressed as individual data points (n = 3–5 mice per genotype as shown) and mean bar ±SEM.
D-E. MFI of CD86 (D) and CD206 (E) expression on the surface of monocytes (Mo) and mature TAM (TAM) isolated from LLC tumor engrafted into the indicated wild-type and deficient littermates (n=4 per group), measured by flow cytometry. Data are expressed as mean ±SEM. Significance was calculated with ANOVA.
F-G. Absolute number (F) and percentage (G) of macrophages (CD45+ Ly-6G− CD11b+ F4/80+) in the lungs of K-rasLSL-G12D, p53f/f bone-marrow chimeras, estimated by flow cytometry.
H-I. Percentage (H) and MFI (I) of CD206 expression on the surface of macrophages in the lungs of K-rasLSL-G12D, p53f/f bone marrow chimeras (n= 5 mice per group), measured by flow cytometry.
F-I. Data are expressed as individual data points and mean bar ±SEM. Significance was calculated with Student’s t-test.
A-I. Data are representative of two independent experiments per genotype.
*p<0.05, **p<0.01, ***p<0.001
See also Figure S2.
Type I interferon responses in LAP-deficient TAM promote tumor suppression
To further explore the differences between LAP-competent and LAP-deficient TAM, we sorted CD11b+ Ly-6G− (non-granulocytic) myeloid cells from LLC engrafted in Rubcn+/− and Rubcn−/− mice, and obtained single cell RNAseq (scRNAseq) profiles. Unsupervised cluster analysis using nonlinear dimensionality reduction (t-distributes stochastic neighbor embedding, t-SNE) revealed differences in the global gene expression profiles of Rubcn+/− and Rubcn−/− TAM and identified clusters of cells with unique genetic signatures (Fig. S3 A, B). We identified clusters that were likely to represent TAM, based on consistent expression of F4/80 (Mafb), Ly-6C (Ly6c2), and MHC-II (H2Aa). TAM expressing F4/80, high levels of Ly-6C and low levels of MHC-II were defined as monocytic TAM; F4/80 positive cells expressing lower levels of Ly-6C were defined as mature TAM and further discriminated into MHC-IIhi and MHC-IIlo subpopulations (Movahedi et al., 2010) (Fig. S3 B, C). Two populations of F4/80lo Flt3+, MHC-IIhi cells (likely dendritic cells) were also distinguishable (Fig. S3 B, C). Based on F4/80, Ly-6C and MHC-II, we identified 7 clusters of immature monocytic and mature TAM that were distinct in their distribution of subpopulations in Rubcn+/− and Rubcn−/− mice (Fig. 3 A–D, Fig. S3 D, E). Among those, we observed a unique cluster of mature TAM (Ly-6Clo MHC-IIhi; cluster 5) primarily composed of Rubcn−/− cells with lower expression of M2 markers (Mrc1 and Arginase-1), supporting the idea that LAP permits anti-inflammatory TAM function (Fig. 3 E). The gene expression profile of this cluster also revealed a prominent type I interferon-induced gene expression signature (Fig. 3F, G). We also observed increased expression of type I IFN target genes in monocytic (Ly-6Chi MHC-IIlo, cluster 2) Rubcn−/− TAM (Fig. 3F). These subpopulations were responsible for an overall increase in the expression of type I IFN-inducible genes in LAP-deficient TAM (Fig. 3H). This type I IFN signature was largely absent from other cell populations we analyzed. (Fig. S3F).
Figure 3. LAP-deficiency induces differential gene expression in TAM.

A. tSNE plots of the expression profiles for monocytes and mature TAM from Rubcn+/− (red) or Rubcn−/− (blue) tumor-infiltrating myeloid cells isolated from LLC subcutaneous grafts. Each circle represents an individual cell.
B. Same as (A) but colors represent cells clustered together based on similarity of global gene expression.
C. tSNE plots showing the normalized absolute UMI count (log2) of categorizing markers (Mafb, Ly6c2, H2Aa) of monocytes and mature TAM for the clusters in (B).
D. Quantification of proportion of Rubcn+/− (red) and Rubcn−/− (blue) cells composing clusters in (B).
E. Expression of Mrc1 and Arginase1 in single myeloid cells for the clusters in (B).
F. Heat map showing the proportion of cells expressing type I IFN pathway target genes (GO term type I interferon pathway, access number GO:0060337, was used for categorization) for the clusters in (B). Clusters are shown in columns and genes in rows.
G. Gene ontology (GO) and Jensen assignments of top 100 uniquely expressed genes in cluster 5 of (B). Dash lines indicate p<0.001.
H. qPCR of type I IFN target genes in isolated Rubcn−/− (n=4 mice) tumor-infiltrating myeloid cells relative to Rubcn+/+ (n=5 mice) counterparts. Data are expressed as individual data points and mean bar ±SEM. Significance was calculated with Student’s t-test, *p<0.05. Data are representative of two independent experiments.
See also Figure S3.
Impaired LAP of engulfed dying tumor cells triggers type I IFN signaling in TAM
Tolerogenic signals produced upon engulfment of dying tumor cells have been suggested to be an important driver of macrophage-mediated suppression of adaptive tumor-infiltrating lymphocytes (TIL), ultimately promoting immune tolerance to the tumor (Garg and Agostinis, 2017). We have previously shown that LAP is required for efficient digestion of phagocytosed dying cells by macrophages and that defects in LAP culminate in the production of inflammatory cytokines in response to accumulated cell corpses (Martinez et al., 2011; Martinez et al., 2016). We thus hypothesized that engulfment of dying cells may account for LAP-dependent control of TAM function in the tumor microenvironment. To that end, we generated an LLC line that stably expresses fluorescent spectrin (LLC mCherry-spectrin cells), a component of cytoskeleton anchored to the cell membrane and thus retained in the cytosol upon cell death (Wang et al., 1996). LLC mCherry-spectrin cells were engrafted in mice transgenically expressing green fluorescent protein (GFP)-tagged LC3. Clearance and LAP of dying tumor cells was observed by confocal microscopy in CD11b+ tumor-infiltrating cells, in which GFP-LC3 was present at the membranes of phagosomes containing cell corpses (Fig. 4 A). We implanted LLC with mCherry-spectrin in Rubcn+/− and Rubcn−/− mice, sorted mCherry+ TAM and assessed the expression of inflammatory genes by quantitative PCR. Supporting our findings from scRNAseq, RUBCN-deficient TAM that had engulfed dying tumor cells displayed increased expression of type I IFN target genes, as well as pro-inflammatory II-1β (Fig. 4 B). Expression of Ifnβ was also increased in Rubcn−/− TAM (Fig. 4 B), supporting the idea that LAP inhibits the production of type I IFN in TAM in response to engulfment of dying tumor cells.
Figure 4. Impaired LAP of engulfed dying tumor cells triggers type I IFN signaling in TAM.

A. Confocal image of harvested subcutaneous mCherry-spectrin+ (red) LLC tumor engrafted in GFP-LC3Tg wild-type mouse. Tumor section was stained with anti-CD11b (blue). Arrows point to GFP-LC3+ phagosomes containing LLC debris. Scale bar = 10 μm.
B. qPCR of the expression of type I IFN target genes and Ifn β in tumor-associated myeloid cells that engulfed LLC tumor cells (mCherry-spectrin+) isolated from Rubcn+/− and Rubcn−/− mice (n=3 mice per genotype). Data are expressed as mean ±SEM.
C. Volcano plot for log2 fold change (LFC) in the expression of genes in Rubcn−/− versus Rubcn+/+ bone marrow-derived macrophages (BMDM) cultured with apoptotic thymocytes for 16 hours. Representative genes associated with M1 TAM phenotype are in blue, type I IFN targets are in green. Horizontal dashed line corresponds to an adjusted p value of 0.01 and vertical dashed line to logFC of 0.33.
D. MFI of the expression of CD206 (CD11b+ CD206+) on the surface of untreated control BMDM (cntrl) or BMDM stimulated with apoptotic thymocytes for 24 hours, as measured by flow cytometry. Data are expressed as mean ±SEM of triplicate BMDM samples.
E. Quantification of the engulfment of apoptotic mCherry-spectrin+ LLC cells by Tim4+/+ and Tim4−/− BMDM, measured by flow cytometry. The percentage of engulfment (CD11b+ mCherry+ double-positive cells) was normalized to Tim4+/+ BMDM. Data are expressed as mean ±SEM of triplicate BMDM samples.
F. Quantification of LAP in Tim4+/+ and Tim4−/− GFP-LC3Tg BMDM cultured with apoptotic mCherry-spectrin+ LLC cells by flow cytometry. The MFI of GFP-LC3 in CD11b+ mCherry+ double-positive cells was normalized to untreated control BMDM. Data are expressed as mean ±SEM of triplicate BMDM samples.
G. Micrometastatic lesions on the lungs of Tim4−/− and littermate Tim4+/+ mice intravenously injected with B16F10 cells. Dots represent the total number of lesions per mouse, line indicates mean ±SEM
H. Tumor growth in Tim4+/− (n=6 mice) and Tim4−/− deficient (n=8 mice) littermates injected with LLC cells subcutaneously. Data are expressed as mean ±SEM.
I. Tumor growth in Tim4+/− (n=5), Tim4−/− (n=5) and Tim4−/− Rubcn−/− (n=3) mice injected with LLC cells subcutaneously. Data are expressed as mean ±SEM.
B-I. Significance was calculated with Student’s t-test (B, D-G) or ANOVA (H, I).
*p<0.05, **p<0.01, ***p<0.001, ****p<0.0001. Data are from one (C, G) or are representative of at least two independent experiments (B, D-F, H-I).
See also Figure S4.
We further investigated a direct link between LAP deficiency and the response to dying cells in vitro using bone marrow-derived macrophages (BMDM). RNA sequencing (RNAseq) analysis identified increased expression of genes associated with a pro-inflammatory M1 macrophage polarization and of type I IFN-inducible genes in Rubcn−/− BMDM stimulated with apoptotic cells, as compared to responses of wild type BMDM (Fig. 4 C). Gene Set Enrichment Analysis of the differentially expressed genes also revealed overall positive regulation of inflammatory responses in Rubcn−/− BMDM, as well as induction of IL-6, TNF-α and IFNγ-dependent signaling pathways (Fig. S4). Metabolic reprogramming toward HIF-1α-dependent glycolysis has been identified as a driver of macrophage inflammatory activation (Tannahill et al., 2013). Interestingly, both glycolysis-and hypoxia-associated genes were also induced in Rubcn−/− BMDM upon engulfment of dying cells, suggesting that LAP may coordinate metabolic reprogramming that drives macrophage inflammatory activation in response to dying cells (Fig. S4). Consistent with our observations of TAMs, engulfment of dying cells also induced expression of CD206, as described (Gonzalez et al., 2017; Soki et al., 2014) which was compromised in RUBCN-deficient BMDM (Fig. 4D).
Efficient engulfment of dying cells by macrophages requires recognition of phosphatidylserine exposed in the surface of dying cells by the T-cell immunoglobulin mucin protein 4 (TIM-4) (Miyanishi et al., 2007), and this participates in the induction of LAP (Martinez, et al., 2011) (Fig. 4 E, F). We observed that TIM4 deletion reduced the growth of metastatic B16F10 melanoma (Fig. 4 G) and engrafted LLC (Fig. 4 H). This effect was not altered by additional deletion of RUBCN (Fig. 4 I), suggesting that TIM4 and RUBCN may function in the same pathway. Overall, these results support a role for LAP in orchestrating an anti-inflammatory phenotype in macrophages in response to the engulfment of dying cells, suggesting that phagocytosis of dying tumor cells is a mechanism through which LAP regulates TAM function in the tumor microenvironment.
A STING-dependent IFN response is required for the anti-tumor effects of LAP deficiency in the tumor microenvironment
We next examined the role of the type I IFN response in LAP-deficient animals. Mice deficient in myeloid ATG5 or ATG7 again displayed delayed growth of implanted carcinoma cells, and this effect was completely lost when these animals were also ubiquitously defective in Interferon Alpha/Beta Receptor 1, IFNAR (Fig. 5A, B). Therefore, the type I IFN response is required for the anti-tumor effects of LAP-deficiency that we observed.
Figure 5. STING and type I IFN promote anti-tumor responses in the absence of LAP.

A. Tumor growth in Atg7f/f Cre− (n=7), Atg7f/f Cre+ (n=4), Atg7f/f Cre− Ifnar−/− (n=10), Atg7f/f Cre+ Ifnar−/− (n=10) mice injected with LLC cells subcutaneously. Data are expressed as mean ±SEM.
B. Tumor growth in Atg5f/f Cre− (n=6), Atg5f/f Cre+ (n=5), Atg5f/f Cre− Ifnar−/− (n=6), Atg5f/f Cre+ Ifnar−/− (n=9) mice injected with LLC cells subcutaneously. Data are expressed as mean ±SEM.
C-E. qPCR of the expression of Ifnβ in Rubcn+/+, Rubcn−/− and Rubcn−/− Tmem173−/− BMDM untreated (Cntrl), transfected with 1μg/ml LLC tumor cell DNA for 8h (C) or co-cultured with apoptotic LLC cells (BMDM/LLC 1:2 ratio) (D) or apoptotic thymocytes (BMDM/thymocyte 1:10 ratio) (E) for 20 h. Data are expressed as mean ±SEM of triplicate BMDM samples.
F. Tumor growth in Rubcn+/+ (n=4), Rubcn−/− (n=4) and Rubcn−/− Tmem173−/− (n=7) mice injected with LLC cells subcutaneously. Data are expressed as mean ±SEM.
G. Tumor growth in Tmem173+/+ (n=8), Tmem173−/− (n=4) and Rubcn−/− Tmem173−/− (n=6) mice injected with LLC cells subcutaneously. Data are expressed as mean ±SEM.
H. Tumor growth in Atg5f/f Cre− (n=5), Atg5f/f Cre+ (n=5), Atg5f/f Cre+Tmem173−/− (n=8), mice injected with LLC cells subcutaneously. Data are expressed as mean ±SEM.
I-J. MFI of CD206 expression on the surface of monocytes (Mo) and mature TAM (TAM), as assessed by flow cytometry. Cells were isolated from subcutaneous LLC tumor engrafted into Rubcn+/+, Rubcn−/− and Rubcn−/− Tmem173−/− (I) or Atg5f/f Cre−, Atg5f/f Cre+ and Atg5f/f Cre+Tmem173−/− (n=4–5 mice per group as shown). Data are expressed as mean ±SEM. A-J. Data are representative of two independent experiments.
Significance was calculated with ANOVA. *p<0.05, **p<0.01, ***p<0.001, ****p<0.0001.
The activation of the cytosolic DNA sensor STING induces type I IFN, but this does not occur upon engulfment of dying cells (Ahn et al., 2018; Corrales et al., 2015; Woo et al., 2014). Strikingly, we found that while transfection of DNA into Rubcn+/+ or Rubcn−/− macrophages similarly induced type I IFN expression (Fig. 5C), the engulfment of carcinoma cells or apoptotic thymocytes induced type I IFN expression only in LAP-deficient macrophages (Fig. 5D, E). This effect of engulfment of apoptotic cells in LAP-deficient macrophages was not observed in the macrophages lacking both RUBCN and STING (encoded by Tmem173). Therefore, LAP prevents the activation of STING upon engulfment of apoptotic cells.
We then examined the role of STING in the effects of LAP-deficiency on tumor growth. Mice lacking RUBCN (Fig. 5F) displayed delayed growth of LLC tumors, but this effect was lost upon ablation of STING. Deletion of STING did not affect tumor growth, and further deletion of RUBCN in STING-deficient mice had no effect (Fig. 5G). Similar results were obtained for animals lacking myeloid ATG5 (Fig. 5H). Furthermore, decreased expression of CD206 in the TAMs from these LAP-deficient animals was not observed in the absence of STING (Fig. 5 I, J). Therefore, the effect of LAP-deficiency on tumor growth and TAM polarization are dependent upon STING.
LAP in TAM suppresses T cell function in the tumor microenvironment
We next assessed whether tumor suppression in the absence of LAP required the activation of tumor infiltrating lymphocytes (TIL). We found that CD8+ TIL from LLC-bearing LysM-Cre+ Atg7f/f, but not LysM-Cre+ Fip200f/f mice were markedly more activated, producing higher levels of IFN-γ than their wild type mice (Fig. S5 A and Fig. 6 A, B). CD4+ T cells also showed higher activation and production of IFNγ in tumors from myeloid ATG5-deficient mice, but not in myeloid FIP200-deficient mice (Fig. S5 A and Fig. 6 C, D). Similar results were obtained for CD8+ and CD4+ TIL isolated from tumors implanted in Rubcn−/− in comparison to Rubcn+/+ animals (Fig. 6 B, D) and in CD8+ T cells in the lungs of K-rasLSL-G12D p53f/f animals transplanted with Rubcn−/− bone marrow (Fig. 6 E–G). Moreover, CD8+ T cells isolated from tumors implanted in LAP-deficient Rubcn−/− mice also produced higher levels of granzyme B (Fig. S5 B). CD8+ and CD4+ TIL isolated from B16F10 tumors similarly displayed an increased activation of effector function in animals lacking LAP (Fig. S6 A, B). Of note, ablation of LAP in TAM did not affect the infiltration or distribution of TIL, but instead modulated their function in the tumor microenvironment (Fig. 6 E, F; Fig. S5 C–E and Fig. S6 C, D). Further, we did not observe any impact of RUBCN deficiency on the infiltration of CD4+ Foxp3+ regulatory T cells (Fig. S5 F). Despite the increased activation of T cells in the tumor microenvironment of ATG5-deficient mice, we observed no differences in numbers of T cells expressing the exhaustion markers PD1 and TIM3 (Fig. S5 G).
Figure 6. LAP in TAM suppresses T cell function in the tumor microenvironment.

A. Representative flow cytometry plots of CD8+ IFNγ+ T cells (gated on CD45+ NK1.1− B220− CD8+), isolated from subcutaneous LLC tumors engrafted in wild-type and deficient mice as indicated.
B. Percentage (upper panels) and MFI (lower panels) of IFNγ+ in CD8+ TIL (n=4–5 mice per genotype as shown). Data are expressed as individual data points and mean bar ±SEM.
C. Representative flow cytometry plots of IFNγ+ CD4+ T cells (gated on CD45+ NK1.1− B220− CD4+), isolated from subcutaneous LLC tumors engrafted in wild-type and deficient mice as indicated.
D. Percentage (upper panels) and MFI (lower panels) of IFNγ+ in CD4+ TIL (n=4–5 mice per genotype as shown). Data are expressed as individual data points and mean bar ±SEM.
E-F. Absolute number (E) and percentage (F) of CD8+ T cells (CD45+ TCRβ+ CD8+) in the lungs of K-rasLSL-G12D, p53f/f bone-marrow chimeras, estimated by flow cytometry (n =5 mice per group). Data are expressed as individual data points and mean bar ±SEM.
G. Percentage of IFNγ+ CD8+ T cells in the lungs of K-rasLSL-G12D, p53f/f bone-marrow chimeras, as assessed by flow cytometry (n=5 mice per genotype). Data are expressed as individual data points and mean bar ±SEM.
H. Tumor growth in Atg5f/f Cre- and Atg5f/f Cre+ mice upon depletion of T cells. Mice were injected with LLC cells subcutaneously and T cells were depleted with anti-CD4, anti-CD8 or treated with isotype control antibodies (Cre-, n=4, Cre+ n=5, mice per treatment). Data are expressed as mean ±SEM.
I. Tumor growth in Rubcn+/+ and Rubcn−/− mice upon depletion of CD8+ T cells. Mice were injected with LLC cells subcutaneously and T cells were depleted with anti-CD8 or treated with isotype control antibodies (n=5 mice per treatment). Data are expressed as mean ±SEM.
J. Percentage of IFNγ+ production in CD8+ T cells isolated from subcutaneous LLC tumors engrafted in Atg7f/f Cre-/Cre+ and Atg7f/f Cre-/Cre+ Ifnar−/− mice, by flow cytometry (n=3–5 mice per genotype as shown). Data are expressed as individual data points and mean bar ±SEM.
K, L. Flow cytometry analysis of IFNγ+ (K) and Granzyme B (L) production in CD8+ T cells isolated from subcutaneous LLC tumors engrafted in Rubcn+/+, Rubcn−/− and Rubcn−/− Tmem173−/− mice (n=3–4 mice per genotype as shown). Data are expressed as mean bar and individual data points; error bars represent s.e.m.
M. Percentage of IFNγ+ production in CD8+ T cells isolated from subcutaneous LLC tumors engrafted in Atg5f/f Cre−, Atg5f/f Cre+ and Atg5f/f Cre+ Tmem173−/− mice, by flow cytometry (n=4 mice per genotype). Data are expressed as individual data points and mean bar ±SEM.
A-G, J-M. Data are representative of two independent experiments. Significance was calculated using Student’s t-test (B, D-G) or ANOVA (J-M); *p<0.05, **p<0.01, ***p<0.001.
See also Figures S5 and S6.
To test the role of activated T cells in the anti-tumor effects of LAP-deficiency, we depleted T lymphocytes following tumor implantation by injection of anti-CD4 or anti-CD8 antibodies, which effectively depleted CD4+ and CD8+ T cells, respectively (Fig. S5H). Importantly, antibody-mediated, acute depletion of either CD4+ or CD8+ T cells impaired tumor suppression in LAP-deficient mice (Fig. 6 H, I and Fig. S5 I). These results indicate that T cell-mediated elimination of tumor cells is required for the tumor suppressive effects of LAP deficiency. Finally, we tested whether type I IFN signaling was required for the regulation of T cell function by LAP-deficient myeloid cells, as STING-dependent type I IF responses (Ahn et al., 2018; Corrales et al., 2015; Woo et al., 2014). We observed that the higher production of IFNγ by CD8+ T cells isolate from LLC tumors implanted in LAP-deficient LysM-Cre+ Atg7f/f mice was dependent on IFNAR (Fig. 6 J) and in LAP-deficient Rubcn−/− or LysM-Cre+ Atg5f/f mice was dependent on STING (Fig. 6 K–M). This result supports the idea that STING-dependent type I IFN responses in LAP-deficient TAM promote tumor elimination by regulating T cell function.
Our findings support a model in which engulfment of dying cells through LAP defines anti-inflammatory polarization of macrophages in the tumor microenvironment, which as a result suppresses T cell function and thus promotes tumor tolerance. In the absence of LAP, TAM polarize toward inflammatory gene expression and trigger a STING-dependent type I IFN response, which promotes T cell effector function to restrict tumor growth.
DISCUSSION
Our studies on the role of LAP in the tumor microenvironment rely on genetic dissection of LAP-associated components in the myeloid compartment. Our conclusion that it is LAP rather than canonical autophagy in TAM that influences anti-cancer T cell responses is based on the pattern of effects, examining ablation of genes involved in both LAP and autophagy (e.g., Becn1, Atg5, Atg7), genes involved in autophagy but not LAP (e.g., Fip200, Atg14), and genes involved in LAP but not autophagy (e.g., Rubcn, Nox2). While our results support a role for LAP rather than autophagy, it remains formally possible that these components function in another biological process that does not involve phagocytosis. Our findings, however, that ablation of the engulfment receptor TIM4 has similar effects, which are not enhanced by additional ablation of RUBCN, and that several endosomal processes are not influenced by ablation of RUBCN, further support our conclusion that it is the engulfment of dying tumor cells, and the subsequent engagement of LAP, that promotes tumor immune tolerance.
In a system of Kras-driven lung oncogenesis, global ablation of ATG7 (required for both canonical autophagy and LAP) in both tumor and normal tissue restricted tumor growth to a greater extent than tumor-specific ablation suggesting a role of host autophagy in promoting tumor growth (Karsli-Uzunbas et al., 2014). Similarly, ablation of autophagy in the microenvironment of pancreatic cancer (by inducible expression of a dominant negative ATG4, required for both autophagy and LAP) impacts tumor growth (Sousa et al., 2016; Yang et al., 2018). While the role of adaptive immunity in these effects was not directly examined, it is possible that ablation of LAP in cells of the tumor microenvironment contributed to these results. Depletion of ATG7 in genetically-induced melanoma was observed to promote anti-cancer T cell responses (Michaud et al., 2014). Although ATG7 is involved in both canonical autophagy and LAP (Sanjuan et al., 2007), this raises the possibility that LAP may also occur and influence immunomodulatory signaling in tumor cells, as suggested for other cancers (Kim and Overholtzer, 2013).
A recent study ablated VPS34 (required for both LAP and autophagy) using CD11c-Cre, which is active in CD8+ dendritic cells (CD8+ DC) that present tumor antigens to CD8+ T cells (Parekh et al., 2017). In this particular setting, they found a general loss of CD8+ DC, a reduction in cross-priming, and increased lung metastases in animals injected intravenously with B16F10 cells. We have observed no such loss of CD8+ DC in animals lacking RUBCN (Martinez et al., 2016), and therefore this effect was unlikely to be due to loss of LAP. In contrast to CD11c-Cre, LysM-Cre is not active in CD8+ DC (Martinez et al., 2016), and therefore it is likely that the effects we observed upon ablation of genes shared by autophagy and LAP pathways (including VPS34) may have depended on “sparing” CD8 + DC from the depleting effects of autophagy deficiency.
While our studies implicate LAP in TAM in preventing anti-cancer immunity, it remains possible that other cell types can also participate in this effect. LysM-Cre, used in our studies, is penetrant in other myeloid cell types, and our studies do not rule out roles for other myeloid cells. While we failed to observe an IFN signature in tumor-infiltrating CD11b+ cells other than monocytes and TAM, it remains possible that other cell types also produce IFN upon LAP ablation. Further, it will be interesting to assess effects of ablation of LAP in other cells of the tumor microenvironment.
While STING function can be restricted by autophagy (Prabakaran et al., 2018), if this mechanism were responsible for increased IFN signaling in our system, we should have expected effects of deletion of autophagy specific components, which we did not observe. Instead, we found evidence that STING is activated in LAP-deficient cells that have engulfed apoptotic cells, and that this is required for the anti-tumor effects. We speculate that the degradation of the DNA of engulfed tumor cells by LAP-dependent lysosomal fusion prevents STING activation. Consistent with this idea, animals lacking lysosomal DNAse II display lethal interferonopathy dependent on STING (Ahn et al., 2012).
Type I IFN signaling promotes CD8+ T cell function, expansion, and memory during viral responses (Kohlmeier et al., 2010; Kolumam et al., 2005), and a similar mechanism may function in tumors. Despite the presence of active anti-cancer T cell immunity in LAP-deficient animals, we observed no differences in expression of the expression of the exhaustion markers, PD-1 and TIM-3 in TIL. Of note, a significant portion of the anti-viral responses during LCMV or influenza infection are mediated by CD8+ T cells expressing PD-1 and TIM-3 (Rutigliano et al., 2014; Sharma et al., 2011), and thus it is possible that type I IFN signaling promotes activity in these cells, and may represent acute responses of infiltrating T cells prior to exhaustion.
Our study suggests that targeting LAP-specific proteins may be a potential therapeutic strategy. Interfering with LAP may allow a “reprogramming” of the function of tumor-associated macrophages to promote the elimination of cancer cells without interfering with canonical autophagy processes that contribute to tumor suppression by other components of the tumor microenvironment, perhaps including lymphocyte function and antigen presentation.
STAR METHODS
CONTACT FOR REAGENT AND RESOURCE SHARING
Further information and requests for resources and reagents should be directed to and will be fulfilled by the Lead Contact, Douglas Green (douglas.green@stjude.org).
EXPERIMENTAL MODEL AND SUBJECT DETAILS
Mice
Atg7f/f mice (kindly provided by Masaaki Komatsu at The Tokyo Metropolitan Institute of Medical Science) were bred to LysM-Cre+ mice (kindly provided by Peter Murray, St. Jude Children’s Research Hospital). Rubcn−/− mice were previously generated in C57BL/6 background using CRISPR/Cas9 gene editing technology (Martinez et al., 2015). Ifnar−/− were purchased from Jackson Laboratories and crossed to Atg7f/f LysM-Cre+/−. Tmem173−/− were purchased from Jackson Laboratories and crossed to Atg5f/f LysM-Cre+ and Rubcn−/− mice. Nox2−/− were purchased from Jackson Laboratories. Other mice were kindly provided: Ulk1−/− (Mondira Kundu, St. Jude Children’s Research Hospital), Becn1f/f LysM-Cre+ (Edmund Rucker, University of Kentucky), Atg5f/f LysM- Cre+ (Thomas A. Ferguson, Washington University), Fip200f/f LysM-Cre+ (Jun-Lin Guan, University of Michigan), Atg14f/f LysM-Cre+ and Atg16l1f/f LysM-Cre+ (Herbert Virgin, Washington University), Vps34f/f LysM-Cre+ (Richard Flavell, Yale University), Tim4−/− mice (Vijay Kuchroo, Harvard University) and K-rasLSL-G12D p53f/f (Mark Hatley, St. Jude Children’s Research Hospital). All mice but K-rasLSL-G12D p53f/f were previously crossed to C57BL/6 GFP-LC3Tg mice (Martinez et al., 2016).
Age and sex matched cohorts of females (8 weeks old) and males (6 weeks old) littermates were used in subcutaneous tumor graft experiments. For tumor metastasis, 12 weeks old females and 10 weeks old males were used. Appropriate littermate controls were used in all experiments. The St. Jude Institutional Animal Care and Use Committee approved all procedures in accordance with the Guide for the Care and Use of Animals. All mice were housed in pathogen-free facilities, in a 12-hour light/dark cycle in ventilated cages, with chow and water supply ad libitum.
Cells
Lewis carcinoma cell line (LLC, derived from C57BL/6, sex information not available) were purchased from ATCC. MC38 adenocarcinoma cell line (derived from female C57BL/6) and B16-F10 melanoma cell line (derived from male C57BL/6) were kindly provided by Hongbo Chi (St. Jude Children’s Research Hospital). RAW264.7 cells (derived from male BALB/C) were obtained from ATCC. Cells were maintained in complete DMEM media (10% fetal bovine serum (FBS), 200 mM L-glutamine and 100 units/ml penicillin-streptomycin). All the cell lines used in tumor studies were confirmed as mycoplasma negative using MycoAlert Mycoplasma Detection kit (Lonza).
For preparation of bone marrow-derived macrophages (BMDM), sex-paired cohorts of male or female mice at 6 to 12 weeks of age were euthanized and bone marrow cells were harvested from the femurs and differentiated in DMEM (Gibco) containing 20% FBS, 200 mM L-glutamine, 100 units/ml penicillin-streptomycin, 20 ng/ml recombinant human M-CSF (Biolegend) for 6 days. BMDM were harvested and seeded on tissue culture plates 1 day before stimulation and maintained in complete DMEM media. All cells used in this study were cultivated at 37° C with 5% CO2.
METHOD DETAILS
Generation of Cell lines
LLC expressing mCherry-spectrin (LLC-mCherry-spectrin) were produced by retroviral transduction with retroviral plasmid expressing mCherry-spectrin (pMX-mCherry-spectrin-IRES-blasticidin). β-spectrin PH (pleckstrin homology) domain (Wang et al., 1996), a kind gift from Gerry Shaw (University of Florida), was cloned in a pMX-IRES-blasticidin (Cell Biolabs) vector expressing mCherry in tandem using MluI and NotI. The Phoenix-AMPHO cells (ATCC) maintained in complete DMEM media were used to package retroviruses.
RAW264.7 Rubcn−/− were generated by CRISPR-Cas9 technology by transient transfection with two different pSpCas9(BB)-2A-GFP (PX458) (Addgene, a gift from Feng Zhang) constructs. Oligonucleotide pairs Rubcn-sgRNA1 (position 32858866–32858885 of C57BL/6 chromosome 16) and Rubcn-sgRNA2 (position 32824711–2824730 of C57BL/6 chromosome 16) were annealed and cloned with BbsI. GFP+ transfected cells were single-cell sorted, and deletion was confirmed by sequencing.
Heterotopic graft tumor models
1.0 × 10⁵ LLC cells, 2.5 × 10⁵ B16F10 cells and 5.0 × 10⁵ MC38 cells were injected subcutaneously into the middle lower back of the mice. Mice were identified by ear tag and experimenters were blinded to their genotype. Tumor growth was measured using a digital caliper and tumor volume was estimated as length x width2 × 0.5 (Euhus et al., 1986; Tomayko and Reynolds, 1989). Tumor metastasis was assessed by tail vein injection of 1.0 × 10⁵ B16F10 cells. Mice were euthanized 21 days post-injections, their lungs excised and all visible tumor spots onto the surface of all lobes were counted.
T cell depletion
200 µg/mouse of rat anti-CD4 (clone GK1.5 BioXCell), rat anti-CD8 (clone 2.43 BioXCell) or rat IgG2b anti-KLH isotype control (clone LTF2 BioXCell) antibodies diluted in phosphate-buffered saline (PBS) were intraperitoneally injected every 5 days, starting at the day prior to inoculation of tumor cells.
Flow cytometry analysis and purification of graft tumor-infiltrating immune cells
For isolation of graft LLC and B16F10 tumor infiltrating immune cells, 14–16 days after implantation mice were euthanized and tumors were harvested. For LLC grafts, extracted tumors were minced and placed in digestion media (Hank’s buffer (Gibco) supplemented with 75 μg/ml Liberase TM (Roche) and 1mg/ml Deoxyribonuclease I (Worthington) for 30 min incubation at 37°C 5% CO 2. RPMI (Gibco) supplemented with 10% fetal bovine serum and 0.1% β-mercaptoethanol was added to digestion reaction, cells were then dissociated with a syringe plunger and by pipetting up and down and passed through a 70 μM strainer, followed by lysis of red blood cells. B1610 tumors were directly dissociated with a syringe plunger, pipetted up and down and passed through a 70 μM strainer. Tumor cells were then washed, and collected at the 40%−80% interface of a Percoll gradient.
For flow cytometry, single cell suspensions were first blocked with anti-mouse CD16/CD32 (Fc Block BD Biosciences) at room temperature for 5 minutes prior to staining. Surface antigens were stained with antibodies for 10 minutes on ice. Cells were also stained with Zombie Violet Viability kit (Biolegend) according to manufacturer’s instructions for discrimination of dead cells and cell debris. For assessment of IFNγ and granzyme-B production by TIL, purified cells were incubated with ionomycin (1 μg/ml) and phorbol myristate acetate (PMA, 20 ng/ml) for 4 h at 37 °C 5% CO2 in the presence of protein transport inhibitor (GolgiStop, BD Biosciences). Surface staining was carried out as described above; cells were fixed and permeabilized using Intracellular Fixation & Permeabilization Buffer Set (eBiosciences) and intracellular staining carried out according to the manufacturer’s instructions. V500 anti-CD45 (clone 30-F11), BV570 anti-CD11b (clone M1/70), APC anti-CD86 (clone GL-1), Alexa Fluor anti-MHC II (clone M5/114.15.2), PE Dazzle 594 anti-CD206 (clone C068C2), PE anti-Ly6G (clone 1A8), Pacific Blue anti-Ly6C (cloneHK1.4), PE-Dazzle 594 anti-NK1.1 (clone PK136), BV605 anti-B220 (cloneRA23–6B), Pacific Blue anti-CD4 (clone RM4–5), APC eFluor 780 anti-CD8 (clone 53–6.7), PE anti-Granzyme B (clone 16G6), PerCp-Cy5.5 anti-IFNγ (clone XMG1.2) , PE-Cy7 anti-Foxp3 (clone FJK-16s), PE-Cy7 anti-Tim3 (clone RMT3–23), APC rat anti-PD-1 (clone J43) were used. Flow analysis was performed in a SP6800 Spectral Cell Analyzer (Sony) and data processing was performed using FlowJo software (FlowJo, LLC). MFI values are expressed as the product of the frequency of a subset and its mean fluorescent intensity (Darrah et al., 2007).
For purification of myeloid infiltrating cells, surface antigens were stained with antibodies for 10 minutes on ice (using V450 anti-CD11b, PerCP-Cy5.5 anti-Ly-6G, PerCP-Cy5.5 anti-SiglecF and PerCP-Cy5.5 anti-NK1.1) and sorting of CD11b+ Ly-6G− Siglec-F− NK1.1− fraction was performed in an iCyte Reflection system.
Quantitative PCR of myeloid infiltrating cells
For quantitative PCR, total RNA was isolated from purified myeloid infiltrating cells with RNeasy Micro kit (QIAGEN) and cDNA was synthesized with Reverse Transcription Supermix (Bio-Rad). cDNA was pre-amplified using PreAmp Supermix (Bio-Rad). Quantitative amplification was performed with Universal SYBR Green (Bio-Rad) in an ABI Prism 7900-HT system (Applied Biosystems). Primers used (Gbp2, Ifit3, Ifnb, Il1b, Stat1) are list on Key Resources Table.
Imaging of graft tumors
For in situ analysis of graft tumor by microscopy, subcutaneous LLC tumors were excised 14 days after implantation and fixed for 24 hours using 2% PFA in PBS containing 0.3% Triton-100 and 0.1% DMSO. Samples were cryoprotected using 20% sucrose in PBS prior to cryosectioning. Slides were blocked with 1% BSA and 0.05% Tween-20 in Tris-buffered saline (TBS, 20mM Tris, pH 8.0, 100mM NaCl) for 1 hour at room temperature prior to overnight incubation in blocking buffer containing primary antibodies Alexa Fluor 647-conjugate rat anti-CD11b (clone M1/70; Biolegend), rabbit anti-mCherry (Abcam) or rat anti-CD3 (clone 17A2, Fisher) labelled with CF543 (Biotium) as indicated in the legend of the figures, at 4°C. Slides were washed in TBS before application of secondary antibody (Biotium) for 1 hour at room temperature prior to mounting with Prolong gold hardset media containing DAPI (Thermofisher). For Fig. 4A, samples were imaged using a Marianas spinning disk confocal microscope (Intelligent Imaging Innovations) equipped with a 40X 1.3NA objective and EMCCD camera, and analyzed using Slidebook 6 software (Intelligent Imaging Innovations). For Fig. S5B, Images were acquired with Nikon TiE microscope using a 25X, 0.75 NA Plan Apo objective. Multiple images at adjacent positions were acquired with a 10% overlap and stitched in postprocessing to create an enlarged format frame. Analysis was performed using NIS Elements (Nikon Instruments Inc.), wherein the number of CD3 objects were determined by intensity thresholding.
Generation of K-rasLSL-G12D p53f/f chimeras
For K-rasLSL-G12D p53f/f bone marrow chimeras, 1.0 × 10⁶ bone marrow cells from Rubcn+/+ or Rubcn−/− were adoptively transferred through retro-orbital injection into lethally irradiated 4 weeks old female and male K-rasLSL-G12D p53f/f littermates. Recipient mice were irradiated at 800 RAD one day before, and an additional 400 RAD on the morning of the transfer. Donor mice were euthanized and bone marrow cells were harvested from the femurs. Red blood cells were lysed, and remaining cells were washed, passed through a 0.45 μm cell strainer, counted and resuspended in sterile PBS prior to transfer. The animals were given amoxicillin-supplemented water (50 mg/ml) for two weeks after irradiation and bone marrow transfer to prevent potential infection. At 8 weeks of age, tumorigenesis was induced in the recipient mice by inhalation of 2.5 × 10⁷ PFU adenovirus-Cre particles (Adv-Cre) (University of Iowa Viral Vector Core).
Analysis of K-rasLSL-G12D p53f/f chimeras
For analysis of tumors from K-rasLSL-G12D p53f/f chimeras, mice were euthanized at 16 weeks of age (8 weeks after tumor induction by Adv-Cre). The lungs were excised, the left middle lobe isolated for cell isolation and the other lobes inflated by intra-tracheal injection of fixative (2% PFA in PBS containing 0.3% Triton-100 and 0.1% DMSO). The left lobe was then excised for ex vivo MRI, and the right cranial lobe was processed for cryosectioning as described above, followed by standard H&E staining procedure. For Fig. 1G, samples were imaged with a Leica S9i steroscope. Ex-vivo MRI was performed with a 7 T Bruker ClinScan system (Bruker BioSpin MRI GmbH, Germany) equipped with a 12S gradient coil. A 2-channel surface coil was used for MR imaging. Each specimen was placed in 10% agarose gel for MR data acquisition. 3D T1-weighted Fast Low Angle SHot (FLASH) images were acquired (TR/TE = 500/5.04 ms, FOV = 20.6 ×30mm, matrix = 528 × 768, number of acquisitions = 32, thickness = 0.07 mm, scan time = 9.5 – 13.1 hr, depending on the number of slices which varied between 64–88). Segmentation of individual lesions and final tumor volume measurements were obtained using OsiriX MD (Pixmeo, Switzerland). For cell isolation and flow cytometry analysis, excised lung lobes were placed in digestion media and mechanically disrupted using gentleMACS Dissociator (Miltenyi Biotec). Cells were passed through a 70 µM strainer, followed by lysis of red blood cells. Cells were treated and stained for flow cytometry as described above. V500 anti-CD45 (clone 30-F11), BV570 anti-CD11b (clone M1/70), PE-Cy7 anti-Ly6G (clone 1A8), APC anti-F4/80 (clone M1/70), PE Dazzle 594 anti-CD206 (clone C068C2), APC e-Fluor 780 anti-TCRβ (clone H57–597), Pacific Blue anti-CD4 (clone RM4–5), Alexa Fluor 700 anti-CD8 (clone 53–6.7), APC anti-IFNγ (clone XMG1.2) were used. Flow analysis was performed in a SP6800 Spectral Cell Analyzer (Sony) and data processing was performed using FlowJo software (FlowJo, LLC). All cells were initially gated as Total cells/Live cells (Zombie Violet−)/Single cells prior to further gating. MFI values are expressed as the product of the frequency of a subset and its mean fluorescent intensity (Darrah et al., 2007).
In vitro experimental procedures
For immunoblot analysis of p62 degradation, BMDM (5.0 × 10⁵) were treated with bafilomycin (50 nM) for 5 hours. The cells were then washed with PBS and lysed in RIPA buffer (10 mM Tris-HCl, pH 7.4, 1 mM EDTA, 150 mM NaCl, 1% Nonidet P-40, 1% deoxycholate, and 0.1% SDS) supplemented with protease inhibitor cocktail (Roche). Precleared lysates and supernatants were boiled in Laemmli buffer, resolved by SDS-page, and transferred to 0.45-µm nitrocellulose membranes. Rabbit anti-p62 (Sigma), rabbit anti-ATG14/FIP200/BECN1/VPS34/ATG5/ATG7/RUBCN (all from Cell Signaling), mouse anti-ATG16L1 (MBL) and HRP-conjugated goat anti-actin (Santa Cruz), and species-specific horseradish-conjugated secondary antibodies were used for antigen detection. Immunoblot for detection of RUBCN in RAW264.7 cells were performed likewise.
Trafficking assays in BMDM by imaging were performed as follows. BMDM (5.0 × 10⁵) were plated in 4 well chamber slides (IBIDI). For transferrin endocytosis assay, BMDM were pre-incubated at 37°C in serum free DMEM for 3 0 min. Transferrin Alexa Fluor 568 conjugate (Invitrogen) were added (50 μg/ml) and the cells were incubated at 37°C for 30 min. Cells were washed sequentially with PBS pH 5.5 and pH 7.4 prior to fixation with 4% paraformaldehyde. For IgG complex endocytosis assay, human IgG (Sigma) aggregates were prepared by incubating 10 mg/ml at 62°C for 20 min., followed by removal of aggregated IgG by centrifugation. BMDM were incubated with IgG complexes (1 mg/ml) for 30 min. Cells were washed with PBS, fixed and permeabilized with 0.1% Triton X-100 prior to staining with APC anti-human IgG Fc antibody (clone HP6017, Biolegend). For Dextran pinocytosis assay, BMDM were incubates with Texas Red-labelled Dextran 10,000 mW (Invitrogen) (500 μg/ml) for 30 min, washed with PBS and fixed. All samples were stained with Alexa Fluor 488 wheat germ agglutinin (Invitrogen) and Hoechst 33258 (Invitrogen) prior to imaging. Samples were imaged using a Marianas spinning disk confocal microscope (Intelligent Imaging Innovations) equipped with a 100X,1.45 NA objective and EMCCD camera, and analyzed using Slidebook 6 software (Intelligent Imaging Innovations).
Trafficking assays in wild-type and Rubcn−/− RAW264.7 cells were performed as follows. For transferrin endocytosis, cells were plated and treated as described above. For endosome maturation assay, RAW264.7 cells (5.0 × 10⁵) plated in chamber slides were loaded with Dextran Oregon Green 488 (500 ng/ml) (Invitrogen) overnight, washed with PBS and chased for 4 h in complete media prior to addition of DQ-Red BSA (Invitrogen) (10 μg/ml) for 1 h. The cells were then washed with PBS, topped with fresh media and immediately imaged by confocal microscopy. For EGF receptor degradation assay, RAW cells were pre-incubated in serum free media overnight. Recombinant EGF (Millipore) diluted in serum free media (100 ng/ml) was added to the BMDM, and samples were washed and lysed in RIPA buffer supplemented with protease inhibitor cocktail (Roche) at the specified time points. Immunoblotting with Rabbit anti-EGFR (clone EP38Y, Abcam) and anti-Actin HRP-conjugated was carried out as described above.
For stimulation of BMDM with apoptotic cells, apoptosis was induced in wild-type C57BL/6 thymocytes by UV irradiation (200 mJ/cm2) or by treatment with staurosporine (1 μM) for 3 hours. For labelling of thymocytes, the cells were incubated with Cell Trace Violet (Invitrogen) prior to apoptotic stimuli, following the manufacturer’s instructions. For LLC and mCherry-spectrin LLC cells, apoptosis was induced by a combination of ABT737 (Selleck Chemicals) and Mcl1 inhibitor S63845 (Cayman) (5 μM) for 2 hours. Apoptotic cells were thoroughly washed with PBS, ressuspended in fresh DMEM complete media and spun down onto macrophages. Prior to sample collection or analysis, wells were washed three times with PBS to eliminate non-engulfed dying thymocytes.
For qPCR analysis, BMDM (5.0 × 10⁵) were stimulated with apoptotic cells or transfected with tumor DNA as described in the legend of the figures. LLC tumor DNA was extracted with DNeasy purification kit (QIAGEN) and transfected with Lipofectamine LTX (Invitrogen). Sample lysis and RNA extraction was performed using RNeasy Mini extraction kit (QIAGEN), and cDNA synthetized with M-MLV reverse transcriptase (Invitrogen) in the presence of RNAse inhibitor (RNAse OUT Invitrogen). Quantitative amplification was performed with SYBR Green PCR Master Mix (Applied Biosystems) in an ABI Prism 7900-HT system (Applied Biosystems).
For flow cytometry analysis, surface antigens were stained for 10 minutes on ice. APC anti-CD11b (clone M1/70) and PE Dazzle anti-CD206 (clone C068C2) were used. For the assessment of LAP by measurement of GFP-LC3 lipidation assessment, the BMDM were incubated with digitonin diluted in PBS (200 μg/ml) for 10 min. on ice after surface staining, then washed in PBS 1% BSA 1mM EDTA. Flow analysis were performed in a a LSFortessa analyzer (BD) and data processing was performed using FlowJo software (FlowJo, LLC).
Single cell RNA seq
Myeloid infiltrating cells from LLC tumors engrafted in Rubcn+/− and Rubcn−/− (n=3 per genotype) were purified by cell sorting as described above and polled. The single-cell suspension was resuspended in phosphate-buffered saline containing 0.04% bovine serum albumin at the concentration of 800–1000 cells/μl. In total 8800 cells were loaded into each well of a Chromium single cell capture chip (Chromium Single Cell A Chip Kit, 10X Genomics) with an average recovery of 4000 cells. The captured single cells on droplets were processed for cell lysis, reverse transcription followed by library amplification (Chromium Single Cell 3’ Library and gel Bead Kit v2, 10X Genomics) and indexing as per the manufactures protocol. The libraries were sequenced on an Illumina Nextseq500 (Next Seq 500/550 High Output Kit v2, Illumina). Cell Ranger (10X Genomics) was used to process the raw sequencing data and align the reads to the mm10 reference genome. The resulting UMI count matrices were concatenated. This merged count matrix was filtered as follows. All mitochondrial and ribosomal protein genes were removed, as were all genes with no reads in any cell from either sample. Cells were removed if they had either less than 3500 UMIs, or greater than 15000 UMIs. The data was normalized by dividing the UMI counts of each gene within a cell by the total number of UMIs in the cell, scaled my multiplication of the median total UMI count across cells from the filtered UMI count matrix, and log2-scaled after the addition of 1 to prevent taking logarithms of zero values. The remaining cells were visualized in 2-dimensions using the Barnes-Hut implementation of t-SNE applied to the first 50 principal components of the 1000 most overdispersed genes in the filtered count matrix. Overdispersion was calculated as performed elsewhere (Zheng et al., 2017). Cells were hierarchically clustered using the Ward D2 method applied to the pairwise Euclidean distance between the normalized expression profiles of all cells. Cells were assigned to clusters using the hybrid method of dynamicTreeCut (Langfelder et al., 2008). All primary scRNA seq data are provided in GEO (Accession number GSE118019).
RNA seq
Total RNA was extracted from bulk staurosporine-induced apoptotic thymocytes and from Rubcn+/+ and Rubcn−/− BMDM, either unstimulated or stimulated with apoptotic thymocytes for 16 hours. RNA quality was assessed by 2100 Bioanalyzer RNA 6000 Nano assay (Agilent). Libraries were prepared using TruSeq Stranded mRNA kits (Illumina) and subjected to 100 cycle paired-end sequencing on the Illumina HiSeq platform.
Reads were aligned to the mouse genome (GRCm38.p5) first using STAR v2.5.3a (Dobin et al., 2013) with splice junctions inferred from Gencode M15 gene annotations (Mudge and Harrow, 2015). Unmapped reads were then re-aligned using BWA v0.7.12-r1039 (Li and Durbin, 2009). Results from each algorithm were merged, yielding >99.5% of reads mapped for each sample, and featureCounts v1.5.1 (Liao et al., 2014) was used to assign read counts to Gencode gene-name annotations, with predicted genes and processed pseudogenes subsequently excluded. We then used edgeR (Robinson et al., 2010) to filter out genes with fewer than 5 counts per million (CPM) and to normalize counts to trimmed mean of M-values (TMM; (Robinson and Oshlack, 2010). Differential expression was assessed with linear models using the limma package (Ritchie et al., 2015), and the false discovery rate (FDR) was used to correct for multiple testing (Benjamini and Hochberg, 1995). Volcano plots were produced using the ggplot2 package (Wickham, 2009). Differential gene ranks were produced by multiplying the log2 fold change (LFC) by the inverse of the unadjusted p-value, and Gene Set Enrichment Analysis (GSEA) was performed on ranked lists using GSEAPreranked with the Hallmark gene set database and with the number of permutations set to 5,0000, the enrichment statistic set to “classic”, and all other parameters at default settings (Subramanian et al., 2005). All primary RNA seq data are provided in GEO (Accession number GSE118019).
QUANTIFICATION AND STATISTICAL ANALYSIS
Please refer to the legend of the figures for description of samples (mice, cells or experimental replicates) and sample sizes. No statistical tests were used to estimate sample size. Data were plotted and analyzed with GraphPad Prism 7.0 software (GraphPad Software). Statistical significance was calculated with either unpaired two-tailed Student’s t-test or ANOVA, as specified in the legend of the figures. Welch’s correction was applied for unpaired Student’s t-test if F test indicated significant difference in variance between the compared groups. Differences were considered statistically significant when the p-value was less than 0.05.
Supplementary Material
LAP occurs as dead cells are engulfed in the tumor microenvironment.
TAM lacking LAP display M1 characteristics and compromise tumors.
TAM lacking LAP engage STING-dependent type I IFN production.
TAM lacking LAP promote anti-tumor T cell responses.
Impairment of LC3-associated phagocytosis in myeloid cells of the tumor microenvironment has anti-tumor effects
ACKNOWLEDGEMENTS
The authors thank Patrick Fitzgerald, Richard Cross and Greig Lennon (SJCRH) for technical assistance and Peer Karmaus, Paul Thomas, Ben Youngblood (SJCRH), Peter Murray (Max Planck Institute) and Jennifer Martinez (NIEHS) for thoughtful insights and discussions. We also thank Hartwell Center for RNA sequencing and the Center for In Vivo Imaging and Therapeutics (supported by SJCRH, NCI R50 CA211481, and NCI P30 CA021765) for preclinical imaging (SJCRH). This work was supported by grants from the US National Institutes of Health (AI40646), a Distinguished Innovator award from the Lupus Research Alliance, and ALSAC. C.G. is supported by a Career Award for Medical Scientists from the Burroughs Wellcome Fund.
Footnotes
Publisher's Disclaimer: This is a PDF file of an unedited manuscript that has been accepted for publication. As a service to our customers we are providing this early version of the manuscript. The manuscript will undergo copyediting, typesetting, and review of the resulting proof before it is published in its final citable form. Please note that during the production process errors may be discovered which could affect the content, and all legal disclaimers that apply to the journal pertain.
COMPETING INTERESTS
The authors declare no competing financial interests.
REFERENCES
- Abram CL, Roberge GL, Hu Y, and Lowell CA (2014). Comparative analysis of the efficiency and specificity of myeloid-Cre deleting strains using ROSA-EYFP reporter mice. J Immunol Methods 408, 89–100. [DOI] [PMC free article] [PubMed] [Google Scholar]
- Ahn J, Gutman D, Saijo S, and Barber GN (2012). STING manifests self DNA-dependent inflammatory disease. Proc Natl Acad Sci U S A 109, 19386–19391. [DOI] [PMC free article] [PubMed] [Google Scholar]
- Ahn J, Xia T, Rabasa Capote A, Betancourt D, and Barber GN (2018). Extrinsic Phagocyte-Dependent STING Signaling Dictates the Immunogenicity of Dying Cells. Cancer Cell 33, 862–873 e865. [DOI] [PMC free article] [PubMed] [Google Scholar]
- Amaravadi R, Kimmelman AC, and White E (2016). Recent insights into the function of autophagy in cancer. Genes Dev 30, 1913–1930. [DOI] [PMC free article] [PubMed] [Google Scholar]
- Benjamini Y, and Hochberg Y (1995). Controlling the False Discovery Rate – a Practical and Powerful Approach to Multiple Testing. J Roy Stat Soc B Met 57, 289–300. [Google Scholar]
- Bordignon J, Probst CM, Mosimann AL, Pavoni DP, Stella V, Buck GA, Satproedprai N, Fawcett P, Zanata SM, de Noronha L, et al. (2008). Expression profile of interferon stimulated genes in central nervous system of mice infected with dengue virus Type-1. Virology 377, 319–329. [DOI] [PubMed] [Google Scholar]
- Chu H, Khosravi A, Kusumawardhani IP, Kwon AH, Vasconcelos AC, Cunha LD, Mayer AE, Shen Y, Wu WL, Kambal A, et al. (2016). Gene-microbiota interactions contribute to the pathogenesis of inflammatory bowel disease. Science 352, 1116–1120. [DOI] [PMC free article] [PubMed] [Google Scholar]
- Corrales L, Glickman LH, McWhirter SM, Kanne DB, Sivick KE, Katibah GE, Woo SR, Lemmens E, Banda T, Leong JJ, et al. (2015). Direct Activation of STING in the Tumor Microenvironment Leads to Potent and Systemic Tumor Regression and Immunity. Cell Rep 11, 1018–1030. [DOI] [PMC free article] [PubMed] [Google Scholar]
- Darrah PA, Patel DT, De Luca PM, Lindsay RW, Davey DF, Flynn BJ, Hoff ST, Andersen P, Reed SG, Morris SL, et al. (2007). Multifunctional TH1 cells define a correlate of vaccine-mediated protection against Leishmania major. Nat Med 13, 843–850. [DOI] [PubMed] [Google Scholar]
- Dobin A, Davis CA, Schlesinger F, Drenkow J, Zaleski C, Jha S, Batut P, Chaisson M, and Gingeras TR (2013). STAR: ultrafast universal RNA-seq aligner. Bioinformatics 29, 15–21. [DOI] [PMC free article] [PubMed] [Google Scholar]
- DuPage M, Dooley AL, and Jacks T (2009). Conditional mouse lung cancer models using adenoviral or lentiviral delivery of Cre recombinase. Nat Protoc 4, 1064–1072. [DOI] [PMC free article] [PubMed] [Google Scholar]
- Euhus DM, Hudd C, LaRegina MC, and Johnson FE (1986). Tumor measurement in the nude mouse. J Surg Oncol 31, 229–234. [DOI] [PubMed] [Google Scholar]
- Florey O, Kim SE, Sandoval CP, Haynes CM, and Overholtzer M (2011). Autophagy machinery mediates macroendocytic processing and entotic cell death by targeting single membranes. Nat Cell Biol 13, 1335–1343. [DOI] [PMC free article] [PubMed] [Google Scholar]
- Garg AD, and Agostinis P (2017). Cell death and immunity in cancer: From danger signals to mimicry of pathogen defense responses. Immunol Rev 280, 126–148. [DOI] [PubMed] [Google Scholar]
- Gonzalez NA, Quintana JA, Garcia-Silva S, Mazariegos M, Gonzalez de la Aleja A, Nicolas-Avila JA, Walter W, Adrover JM, Crainiciuc G, Kuchroo VK, et al. (2017). Phagocytosis imprints heterogeneity in tissue-resident macrophages. J Exp Med 214, 1281–1296. [DOI] [PMC free article] [PubMed] [Google Scholar]
- Guo JY, Karsli-Uzunbas G, Mathew R, Aisner SC, Kamphorst JJ, Strohecker AM, Chen G, Price S, Lu W, Teng X, et al. (2013). Autophagy suppresses progression of K-ras-induced lung tumors to oncocytomas and maintains lipid homeostasis. Genes Dev 27, 1447–1461. [DOI] [PMC free article] [PubMed] [Google Scholar]
- Henault J, Martinez J, Riggs JM, Tian J, Mehta P, Clarke L, Sasai M, Latz E, Brinkmann MM, Iwasaki A, et al. (2012). Noncanonical autophagy is required for type I interferon secretion in response to DNA-immune complexes. Immunity 37, 986–997. [DOI] [PMC free article] [PubMed] [Google Scholar]
- Huang Z, Richmond TD, Muntean AG, Barber DL, Weiss MJ, and Crispino JD (2007). STAT1 promotes megakaryopoiesis downstream of GATA-1 in mice. J Clin Invest 117, 3890–3899. [DOI] [PMC free article] [PubMed] [Google Scholar]
- Huang J, Canadien V, Lam GY, Steinberg BE, Dinauer MC, Magalhaes MA, Glogauer M, Grinstein S, and Brumell JH (2009). Activation of antibacterial autophagy by NADPH oxidases. Proc Natl Acad Sci U S A 106, 6226–6231. [DOI] [PMC free article] [PubMed] [Google Scholar]
- Itakura E, Kishi C, Inoue K, and Mizushima N (2008). Beclin 1 forms two distinct phosphatidylinositol 3-kinase complexes with mammalian Atg14 and UVRAG. Mol Biol Cell 19, 5360–5372. [DOI] [PMC free article] [PubMed] [Google Scholar]
- Jaber N, Dou Z, Chen JS, Catanzaro J, Jiang YP, Ballou LM, Selinger E, Ouyang X, Lin RZ, Zhang J, et al. (2012). Class III PI3K Vps34 plays an essential role in autophagy and in heart and liver function. Proc Natl Acad Sci U S A 109, 2003–2008. [DOI] [PMC free article] [PubMed] [Google Scholar]
- Jaber N, Mohd-Naim N, Wang Z, DeLeon JL, Kim S, Zhong H, Sheshadri N, Dou Z, Edinger AL, Du G, et al. (2016). Vps34 regulates Rab7 and late endocytic trafficking through recruitment of the GTPase-activating protein Armus. J Cell Sci 129, 4424–4435. [DOI] [PMC free article] [PubMed] [Google Scholar]
- Johnson L, Mercer K, Greenbaum D, Bronson RT, Crowley D, Tuveson DA, and Jacks T (2001). Somatic activation of the K-ras oncogene causes early onset lung cancer in mice. Nature 410, 1111–1116. [DOI] [PubMed] [Google Scholar]
- Karsli-Uzunbas G, Guo JY, Price S, Teng X, Laddha SV, Khor S, Kalaany NY, Jacks T, Chan CS, Rabinowitz JD, et al. (2014). Autophagy is required for glucose homeostasis and lung tumor maintenance. Cancer Discov 4, 914–927. [DOI] [PMC free article] [PubMed] [Google Scholar]
- Kim JY, Zhao H, Martinez J, Doggett TA, Kolesnikov AV, Tang PH, Ablonczy Z, Chan CC, Zhou Z, Green DR, et al. (2013). Noncanonical autophagy promotes the visual cycle. Cell 154, 365–376. [DOI] [PMC free article] [PubMed] [Google Scholar]
- Kim SE, and Overholtzer M (2013). Autophagy proteins regulate cell engulfment mechanisms that participate in cancer. Semin Cancer Biol 23, 329–336. [DOI] [PMC free article] [PubMed] [Google Scholar]
- Kimmelman AC, and White E (2017). Autophagy and Tumor Metabolism. Cell Metab 25, 1037–1043. [DOI] [PMC free article] [PubMed] [Google Scholar]
- Kohlmeier JE, Cookenham T, Roberts AD, Miller SC, and Woodland DL (2010). Type I interferons regulate cytolytic activity of memory CD8(+) T cells in the lung airways during respiratory virus challenge. Immunity 33, 96–105. [DOI] [PMC free article] [PubMed] [Google Scholar]
- Kolumam GA, Thomas S, Thompson LJ, Sprent J, and Murali-Krishna K (2005). Type I interferons act directly on CD8 T cells to allow clonal expansion and memory formation in response to viral infection. J Exp Med 202, 637–650. [DOI] [PMC free article] [PubMed] [Google Scholar]
- Langfelder P, Zhang B, and Horvath S (2008). Defining clusters from a hierarchical cluster tree: the Dynamic Tree Cut package for R. Bioinformatics 24, 719–720. [DOI] [PubMed] [Google Scholar]
- Li H, and Durbin R (2009). Fast and accurate short read alignment with Burrows-Wheeler transform. Bioinformatics 25, 1754–1760. [DOI] [PMC free article] [PubMed] [Google Scholar]
- Liao Y, Smyth GK, and Shi W (2014). featureCounts: an efficient general purpose program for assigning sequence reads to genomic features. Bioinformatics 30, 923–930. [DOI] [PubMed] [Google Scholar]
- Martinez J, Almendinger J, Oberst A, Ness R, Dillon CP, Fitzgerald P, Hengartner MO, and Green DR (2011). Microtubule-associated protein 1 light chain 3 alpha (LC3)-associated phagocytosis is required for the efficient clearance of dead cells. Proc Natl Acad Sci U S A 108, 17396–17401. [DOI] [PMC free article] [PubMed] [Google Scholar] [Retracted]
- Martinez J, Cunha LD, Park S, Yang M, Lu Q, Orchard R, Li QZ, Yan M, Janke L, Guy C, et al. (2016). Noncanonical autophagy inhibits the autoinflammatory, lupus-like response to dying cells. Nature 533, 115–119. [DOI] [PMC free article] [PubMed] [Google Scholar] [Retracted]
- Martinez J, Malireddi RK, Lu Q, Cunha LD, Pelletier S, Gingras S, Orchard R, Guan JL, Tan H, Peng J, et al. (2015). Molecular characterization of LC3-associated phagocytosis reveals distinct roles for Rubicon, NOX2 and autophagy proteins. Nat Cell Biol 17, 893–906. [DOI] [PMC free article] [PubMed] [Google Scholar] [Retracted]
- Mathew R, Karp CM, Beaudoin B, Vuong N, Chen G, Chen HY, Bray K, Reddy A, Bhanot G, Gelinas C, et al. (2009). Autophagy suppresses tumorigenesis through elimination of p62. Cell 137, 1062–1075. [DOI] [PMC free article] [PubMed] [Google Scholar]
- Mathew R, Khor S, Hackett SR, Rabinowitz JD, Perlman DH, and White E (2014). Functional role of autophagy-mediated proteome remodeling in cell survival signaling and innate immunity. Mol Cell 55, 916–930. [DOI] [PMC free article] [PubMed] [Google Scholar]
- Mathew R, Kongara S, Beaudoin B, Karp CM, Bray K, Degenhardt K, Chen G, Jin S, and White E (2007). Autophagy suppresses tumor progression by limiting chromosomal instability. Genes Dev 21, 1367–1381. [DOI] [PMC free article] [PubMed] [Google Scholar]
- Matsunaga K, Saitoh T, Tabata K, Omori H, Satoh T, Kurotori N, Maejima I, Shirahama-Noda K, Ichimura T, Isobe T, et al. (2009). Two Beclin 1-binding proteins, Atg14L and Rubicon, reciprocally regulate autophagy at different stages. Nat Cell Biol 11, 385–396. [DOI] [PubMed] [Google Scholar]
- McKnight NC, Zhong Y, Wold MS, Gong S, Phillips GR, Dou Z, Zhao Y, Heintz N, Zong WX, and Yue Z (2014). Beclin 1 is required for neuron viability and regulates endosome pathways via the UVRAG-VPS34 complex. PLoS Genet 10, e1004626. [DOI] [PMC free article] [PubMed] [Google Scholar]
- Michaud M, Xie X, Bravo-San Pedro JM, Zitvogel L, White E, and Kroemer G (2014). An autophagy-dependent anticancer immune response determines the efficacy of melanoma chemotherapy. Oncoimmunology 3, e944047. [DOI] [PMC free article] [PubMed] [Google Scholar]
- Miyanishi M, Tada K, Koike M, Uchiyama Y, Kitamura T, and Nagata S (2007). Identification of Tim4 as a phosphatidylserine receptor. Nature 450, 435–439. [DOI] [PubMed] [Google Scholar]
- Movahedi K, Guilliams M, Van den Bossche J, Van den Bergh R, Gysemans C, Beschin A, De Baetselier P, and Van Ginderachter JA (2008). Identification of discrete tumor-induced myeloid-derived suppressor cell subpopulations with distinct T cell-suppressive activity. Blood 111, 4233–4244. [DOI] [PubMed] [Google Scholar]
- Movahedi K, Laoui D, Gysemans C, Baeten M, Stange G, Van den Bossche J, Mack M, Pipeleers D, In’t Veld P, De Baetselier P, et al. (2010). Different tumor microenvironments contain functionally distinct subsets of macrophages derived from Ly6C(high) monocytes. Cancer Res 70, 5728–5739. [DOI] [PubMed] [Google Scholar]
- Mudge JM, and Harrow J (2015). Creating reference gene annotation for the mouse C57BL6/J genome assembly. Mamm Genome 26, 366–378. [DOI] [PMC free article] [PubMed] [Google Scholar]
- Murray PJ, Allen JE, Biswas SK, Fisher EA, Gilroy DW, Goerdt S, Gordon S, Hamilton JA, Ivashkiv LB, Lawrence T, et al. (2014). Macrophage activation and polarization: nomenclature and experimental guidelines. Immunity 41, 14–20. [DOI] [PMC free article] [PubMed] [Google Scholar]
- Pankiv S, Clausen TH, Lamark T, Brech A, Bruun JA, Outzen H, Overvatn A, Bjorkoy G, and Johansen T (2007). p62/SQSTM1 binds directly to Atg8/LC3 to facilitate degradation of ubiquitinated protein aggregates by autophagy. J Biol Chem 282, 24131–24145. [DOI] [PubMed] [Google Scholar]
- Parekh VV, Pabbisetty SK, Wu L, Sebzda E, Martinez J, Zhang J, and Van Kaer L (2017). Autophagy-related protein Vps34 controls the homeostasis and function of antigen cross-presenting CD8alpha(+) dendritic cells. Proc Natl Acad Sci U S A 114, E6371–E6380. [DOI] [PMC free article] [PubMed] [Google Scholar]
- Prabakaran T, Bodda C, Krapp C, Zhang BC, Christensen MH, Sun C, Reinert L, Cai Y, Jensen SB, Skouboe MK, et al. (2018). Attenuation of cGAS-STING signaling is mediated by a p62/SQSTM1-dependent autophagy pathway activated by TBK1. EMBO J 37. [DOI] [PMC free article] [PubMed] [Google Scholar]
- Ran FA, Hsu PD, Wright J, Agarwala V, Scott DA, and Zhang F (2013). Genome engineering using the CRISPR-Cas9 system. Nat Protoc 8, 2281–2308. [DOI] [PMC free article] [PubMed] [Google Scholar]
- Rao S, Tortola L, Perlot T, Wirnsberger G, Novatchkova M, Nitsch R, Sykacek P, Frank L, Schramek D, Komnenovic V, et al. (2014). A dual role for autophagy in a murine model of lung cancer. Nat Commun 5, 3056. [DOI] [PubMed] [Google Scholar]
- Ritchie ME, Phipson B, Wu D, Hu Y, Law CW, Shi W, and Smyth GK (2015). limma powers differential expression analyses for RNA-sequencing and microarray studies. Nucleic Acids Res 43, e47. [DOI] [PMC free article] [PubMed] [Google Scholar]
- Robinson MD, McCarthy DJ, and Smyth GK (2010). edgeR: a Bioconductor package for differential expression analysis of digital gene expression data. Bioinformatics 26, 139–140. [DOI] [PMC free article] [PubMed] [Google Scholar]
- Robinson MD, and Oshlack A (2010). A scaling normalization method for differential expression analysis of RNA-seq data. Genome Biol 11, R25. [DOI] [PMC free article] [PubMed] [Google Scholar]
- Rutigliano JA, Sharma S, Morris MY, Oguin TH 3rd, McClaren JL, Doherty PC, and Thomas PG (2014). Highly pathological influenza A virus infection is associated with augmented expression of PD-1 by functionally compromised virus-specific CD8+ T cells. J Virol 88, 1636–1651. [DOI] [PMC free article] [PubMed] [Google Scholar]
- Sanjuan MA, Dillon CP, Tait SW, Moshiach S, Dorsey F, Connell S, Komatsu M, Tanaka K, Cleveland JL, Withoff S, et al. (2007). Toll-like receptor signalling in macrophages links the autophagy pathway to phagocytosis. Nature 450, 1253–1257. [DOI] [PubMed] [Google Scholar]
- Sarkar A, Tindle C, Pranadinata RF, Reed S, Eckmann L, Stappenbeck TS, Ernst PB, and Das S (2017). ELMO1 Regulates Autophagy Induction and Bacterial Clearance During Enteric Infection. J Infect Dis 216, 1655–1666. [DOI] [PMC free article] [PubMed] [Google Scholar]
- Sharma S, Sundararajan A, Suryawanshi A, Kumar N, Veiga-Parga T, Kuchroo VK, Thomas PG, Sangster MY, and Rouse BT (2011). T cell immunoglobulin and mucin protein-3 (Tim-3)/Galectin-9 interaction regulates influenza A virus-specific humoral and CD8 T-cell responses. Proc Natl Acad Sci U S A 108, 19001–19006. [DOI] [PMC free article] [PubMed] [Google Scholar]
- Soki FN, Koh AJ, Jones JD, Kim YW, Dai J, Keller ET, Pienta KJ, Atabai K, Roca H, and McCauley LK (2014). Polarization of prostate cancer-associated macrophages is induced by milk fat globule-EGF factor 8 (MFG-E8)-mediated efferocytosis. J Biol Chem 289, 24560–24572. [DOI] [PMC free article] [PubMed] [Google Scholar]
- Sousa CM, Biancur DE, Wang X, Halbrook CJ, Sherman MH, Zhang L, Kremer D, Hwang RF, Witkiewicz AK, Ying H, et al. (2016). Pancreatic stellate cells support tumour metabolism through autophagic alanine secretion. Nature 536, 479–483. [DOI] [PMC free article] [PubMed] [Google Scholar]
- Stein M, Keshav S, Harris N, and Gordon S (1992). Interleukin 4 potently enhances murine macrophage mannose receptor activity: a marker of alternative immunologic macrophage activation. J Exp Med 176, 287–292. [DOI] [PMC free article] [PubMed] [Google Scholar]
- Subramanian A, Tamayo P, Mootha VK, Mukherjee S, Ebert BL, Gillette MA, Paulovich A, Pomeroy SL, Golub TR, Lander ES, et al. (2005). Gene set enrichment analysis: a knowledge-based approach for interpreting genome-wide expression profiles. Proc Natl Acad Sci U S A 102, 15545–15550. [DOI] [PMC free article] [PubMed] [Google Scholar]
- Tam JM, Mansour MK, Khan NS, Seward M, Puranam S, Tanne A, Sokolovska A, Becker CE, Acharya M, Baird MA, et al. (2014). Dectin-1-dependent LC3 recruitment to phagosomes enhances fungicidal activity in macrophages. J Infect Dis 210, 1844–1854. [DOI] [PMC free article] [PubMed] [Google Scholar]
- Tannahill GM, Curtis AM, Adamik J, Palsson-McDermott EM, McGettrick AF, Goel G, Frezza C, Bernard NJ, Kelly B, Foley NH, et al. (2013). Succinate is an inflammatory signal that induces IL-1beta through HIF-1alpha. Nature 496, 238–242. [DOI] [PMC free article] [PubMed] [Google Scholar]
- Tomayko MM, and Reynolds CP (1989). Determination of subcutaneous tumor size in athymic (nude) mice. Cancer Chemother Pharmacol 24, 148–154. [DOI] [PubMed] [Google Scholar]
- Wang DS, Miller R, Shaw R, and Shaw G (1996). The pleckstrin homology domain of human beta I sigma II spectrin is targeted to the plasma membrane in vivo. Biochem Biophys Res Commun 225, 420–426. [DOI] [PubMed] [Google Scholar]
- Woo SR, Fuertes MB, Corrales L, Spranger S, Furdyna MJ, Leung MY, Duggan R, Wang Y, Barber GN, Fitzgerald KA, et al. (2014). STING-dependent cytosolic DNA sensing mediates innate immune recognition of immunogenic tumors. Immunity 41, 830–842. [DOI] [PMC free article] [PubMed] [Google Scholar]
- Wickham H (2009). ggplot2: Elegant Graphics for Data Analysis (Springer-Verlag New York; ) [Google Scholar]
- Yang A, Herter-Sprie G, Zhang H, Lin EY, Biancur D, Wang X, Deng J, Hai J, Yang S, Wong KK, et al. (2018). Autophagy Sustains Pancreatic Cancer Growth through Both Cell-Autonomous and Nonautonomous Mechanisms. Cancer Discov 8, 276–287. [DOI] [PMC free article] [PubMed] [Google Scholar]
- Zheng GX, Terry JM, Belgrader P, Ryvkin P, Bent ZW, Wilson R, Ziraldo SB, Wheeler TD, McDermott GP, Zhu J, et al. (2017). Massively parallel digital transcriptional profiling of single cells. Nat Commun 8, 14049. [DOI] [PMC free article] [PubMed] [Google Scholar]
- Zhong Y, Wang QJ, Li X, Yan Y, Backer JM, Chait BT, Heintz N, and Yue Z (2009). Distinct regulation of autophagic activity by Atg14L and Rubicon associated with Beclin 1-phosphatidylinositol-3-kinase complex. Nat Cell Biol 11, 468–476. [DOI] [PMC free article] [PubMed] [Google Scholar]
Associated Data
This section collects any data citations, data availability statements, or supplementary materials included in this article.