Abstract
Background:
A cross-sectional association between depression and serum low-density lipoprotein (LDL) has been noted in the literature. This study aims to employ meta-analytic techniques to clarify the relationship between depression and serum LDL.
Methods:
Published articles through April 2015 were identified through systematic query of PubMed with follow-up manual searches. Data from 36 studies reporting mean difference and 7 studies reporting odds ratios were analyzed separately.
Results:
Meta-analysis of studies modeling serum LDL as a continuous measure demonstrates overall significantly lower serum LDL in depression (Mean difference=−4.29, 95% CI=−8.19, −0.40, p=0.03). Meta-analysis of studies modeling serum LDL as a categorical measure demonstrates a marginally significant lower odds of depression in the presence of low serum LDL relative to high serum LDL (OR=0.90, 95% CI=0.80, 1.01, p=0.08).
Limitations:
High heterogeneity was noted across sampled studies, which may be a function of variations in study design, participants sampled, or other factors. The potential for publication bias was also assessed.
Conclusions:
This meta-analysis demonstrates a cross-sectional link between depression and low serum LDL.
Keywords: Depression, Low-density lipoprotein, Meta-analysis, Lipids, Cholesterol
Introduction
In Hyman Engelberg’s 1992 paper, “Low Serum Cholesterol and Suicide,” it is posited that cholesterol depletion leads to suicidality by way of serotonin-mediated mood alterations (Engelberg 1992). A cross-sectional association between depression and low serum low density lipoprotein (LDL) has been noted in the literature. It has been speculated that this interplay between depression and LDL in the peripheral body system may be reflective of this aforementioned cholesterol depletion within the central nervous system. The blood-brain barrier segregates brain and body cholesterol into two distinct pools; In the body, LDL transports cholesterol to the cell membrane, whereas in the brain cholesterol is synthesized on-site (Orth and Bellosta 2012). As such, it may be the case that the relationship between depression and low LDL in the periphery is indicative of a link between cholesterol depletion in the brain by way of a common upstream process. A study by Freemantle et al. found evidence suggesting that psychopathology may occur subsequent to elevated cholesterol turnover in the brain, which in turn may be associated with cholesterol depletion at the cell membrane (Freemantle, Chen et al. 2013). Similarly, Beasley et al. found evidence suggesting that the mechanism guiding the relationship between low cholesterol and depression pathogenesis may, at least in part, involve cholesterol-mediated alterations in nerve terminal structure and function (Beasley, Honer et al. 2005). Similarly, Pucadyil and Chattopadhyay found evidence that cholesterol depletion impairs the ligand-binding function of the 5-HT1A receptor (Pucadyil and Chattopadhyay 2005), which they later determined to be due to organizational changes in cholesterol-depleted membrane (Pucadyil and Chattopadhyay 2007). The importance of membrane cholesterol in proper functioning has also been demonstrated in the serotonin receptor subclasses 5-HT2A (Dreja, Voldstedlund et al. 2002, Sommer, Montano et al. 2009) and 5-HT7 (Sjogren and Svenningsson 2007, Sjogren and Svenningsson 2007). Together, these studies suggest that one potential mechanism guiding depression pathogenesis may involve cholesterol depletion-mediated alterations in central nerve terminal structure and function that in turn influence receptor responsiveness to serotonin.
While a number of cross-sectional studies present evidence suggesting an inverse association between serum LDL and depression, conflicting findings do exist. Meta-analytic studies are an indispensable tool for bringing clarity to a disparate body of literature; however, to date there has been only one meta-analysis conducted to examine the relationship between depression and serum LDL. In 2008, Shin et al. conducted a meta-analysis of 11 observational studies (Lindberg, Larsson et al. 1994, Olusi and Fido 1996, Rutledge, Reis et al. 2001, Sevincok, Buyukozturk et al. 2001, Aijanseppa, Kivinen et al. 2002, Pozzi, Troisi et al. 2003, Ergun, Uguz et al. 2004, Huang and Chen 2004, Karlovic, Buljan et al. 2004, Elovainio, Keltikangas-Jarvinen et al. 2006, Roy and Roy 2006) to evaluate the association between depression and serum LDL and determined there to be a non-significant inverse association (d = −0.17, 95% CI = −0.44, 0.10) (Shin, Suls et al. 2008). The meta-analysis conducted by Shin et al. included studies published through 2006; subsequent to 2006, there have been 23 additional studies conducted to examine the association between depression and serum LDL. This current study aimed to provide a more current meta-analysis on the relationship between depression and serum LDL in light of the growing body of literature.
Methods
Although this study aims to build upon the work of Shin et al. by providing a more recent meta-analysis on the association between LDL and depression, it is not intended to be an update of their 2008 manuscript and as such does not follow the selfsame meta-analytic approach. This study used PRISMA guidelines to conduct a systematic review and meta-analysis on the relationship between depression and serum LDL (Moher, Liberati et al. 2009). Papers meeting the following criteria were included:
Observational study using human subjects: Review articles, invited commentary, clinical trials, and animal studies were excluded from analysis.
Includes a standard measure of serum LDL: Serum LDL was included regardless of whether it was measured via direct assay or estimated via the Friedewald formula, and regardless of whether it was presented in milligrams per deciliter, grams per liter, or millimoles per liter. For the purpose of analysis, all serum LDL values reported in millimoles per liter were converted to milligrams per deciliter.
Includes a standard measure of depression: To maximize the number of eligible studies, depression was broadly defined to include the occurrence of depressive symptoms whether or not they occur as a component of major depressive disorder or another mood disorder, such as schizoaffective disorder or bipolar disorder. Depression assessment was not limited to one specific assessment instrument, and included self-assessment, clinician-administered scales, and clinical diagnosis.
Studies assessing depression scale scores as a continuous variable were not considered eligible for inclusion, as the purpose of this analysis was to evaluate the relationship between serum LDL levels and depression status, rather than depressive symptom burden or severity of depressive symptoms, as would be addressed by a continuous measure. For these studies, corresponding authors were contacted and requested to provide sufficient supplemental information to allow for calculation of mean serum LDL levels by depression status, dichotomizing continuous depression scale scores based on cutpoints previously established in the literature for the assessment instrument used in the study. Of the fourteen corresponding authors approached for additional data, three messages were returned as undeliverable due to outdated contact information, two authors declined participation, four accepted and responded with additional data, and no response was received from the remaining five. The four studies for which the additional requested data was provided were included in meta-analysis.
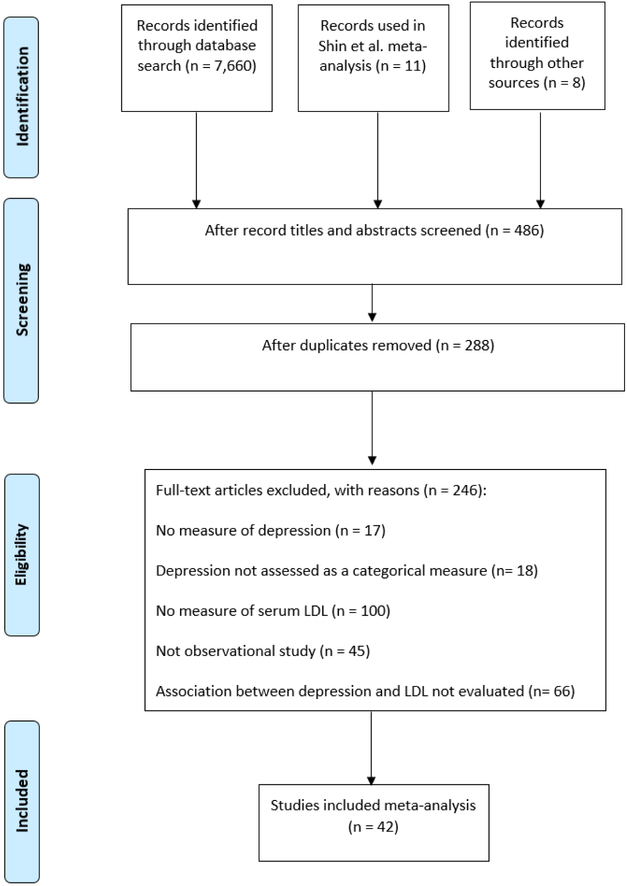
To identify studies, a systematic search of the literature was conducted through a database search of PubMed for articles published through April 2015, using the search terms ‘LDL AND Depression,’ ‘LDL AND Mood,’ ‘Cholesterol AND Depression,’ and ‘Serum lipid AND Depression.’ The database search was supplemented by hand-search of relevant papers for additional citations. Titles and abstracts of papers retrieved through this initial search were screened to identify potentially relevant studies. Of those identified as potentially-relevant, full text articles were next screened for inclusion in the meta-analysis. A summary of the study selection process can be seen in Figure 1.
Figure 1.
Systematic Literature Search
Through systematic review, 42 studies were identified for inclusion in the meta-analysis and data extraction was undertaken for these studies (Table 1). Meta-analysis was conducted using RevMan version 5.3. For studies modeling serum LDL as a continuous measure, a random effects model was used to calculate mean difference and 95% confidence interval. For studies modeling serum LDL as a categorical measure, a random effects model was used to combine study-specific odds ratios to calculate the pooled odds ratio and 95% confidence interval. Results are reported as text and presented visually via Forest plot.
Table 1.
Characteristics of Studies Included in Meta-analysis
| Author and date | Study design | Sample size | LDL measure | Depression measure |
|---|---|---|---|---|
| (Lindberg, Larsson et al. 1994) | cross-sectional | 905 (28.8% women) | Estimated : (total cholesterol - HDL cholesterol - 0.45) * triglyceride Fasting mmol/L Continuous |
Single-item response: How often during the past month have you experienced low mood or glumness? Cases defined as responses of “sometimes”, “often”, or “very often” 273 participants (30.2%) met case criteria; of these, 160 men and 113 women met case criteria |
| (Olusi and Fido 1996) | 1:1 sex- and age-matched case-control |
200 (36% women) | Friedewald formula Fasting mmol/L Continuous |
Chart review using ICD-10 criteria for MDD |
| (Maes, Smith et al. 1997) | case-control | 64 (84.4% women) 36 with depression 28 controls |
Friedewald formula Fasting mg/dL Continuous |
Semi-structured interview using DSM-III-R criteria for MDD Hamilton Depression Rating Scale (HAM-D) |
| (Agargun, Algun et al. 1998) | 1:1 age-, sex-, and weight-matched case-control | 52 (40% women) 16 with depression and panic disorder 16 with panic disorder 16 controls |
Friedewald formula Fasting mg/dL Continuous |
Structured clinical interview for DSM III-R (SCID) |
| (Khalid, Lal et al. 1998) | 1:1 age- and sex-matched case-control | 56 (46.4% women) 28 with depression 28 controls |
Friedewald formula Fasting mg/dL Continuous |
Semi-structured interview using DSM-III-R criteria for major depression single episode or recurrent depression |
| (Gary, Crum et al. 2000) | cross-sectional | 183 (76% women) | Direct measure Fasting mg/dL Continuous |
Center for Epidemiologic Studies Depression scale (CES-D) Data-driven quartiles |
| (Kemp, Spungen et al. 2000) | cross-sectional | 188 (19% women) | Direct measure Fasting mg/dL Continuous |
Older Adult Health and Mood Questionnaire (OAHMQ) Cases were defined as OAHMQ scores ≥ 6 76 participants (40%) met case criteria |
| (Rabe-Jablonska and Poprawska 2000) | case-crossover | 102 (69.6% women) | Direct measure Fasting mg/dL Continuous |
Semi-structured interview using DSM-IV criteria for MDD HAM-D Acute phase was defined as a HAM-D score above 20 Remission was defined as no longer meeting DSM-IV criteria for major depression and achieving a score of 0 in HAM-D item 1 |
| (Sevincok, Buyukozturk et al. 2001) | age-, sex-, and BMI-matched case-control | 117 (72.6% women) 40 with GAD and MDD 27 with MDD 26 with GAD 24 controls |
Friedewald formula Fasting mg/dL Continuous |
SCID for DSM-III-R Beck Depression Inventory (BDI) |
| (Aijanseppa, Kivinen et al. 2002) | prospective cohort | 421 (0% women) | Friedewald formula Fasting mmol/l Continuous |
Zung Self-Rating Depression Scale Cases were defined as scores ≥ 48/80 64 participants (15.2%) met case criteria |
| (Huang, Wu et al. 2003) | cross-sectional | 162 (53.7% women) | Direct measure Fasting mg/dL Continuous |
Screened with the Chinese Health Questionnaire and the Taiwanese Depression Questionnaire Semi-structured clinical interview using DSM-IV criteria for MDD 68 participants (42%) met case criteria |
| (Ergun, Uguz et al. 2004) | cross-sectional | 189 (56.6% women) | Direct measure Fasting mg/dL Continuous |
SCID for DSM-IV 42 participants (22.2%) met case criteria |
| (Huang and Chen 2004) | cross-sectional | 142 (52.8% women) | Direct measure Fasting mg/dL Continuous |
Screened with the Chinese Health Questionnaire and the Taiwanese Depression Questionnaire Semi-structured clinical interview using DSM-IV criteria 35 participants (24.6%) met criteria for dysthymia 22 participants (15.5%) met criteria for MDD with melancholic features 46 participants (32.4%0 met criteria for MDD with atypical features |
| (Karlovic, Buljan et al. 2004) | case-control | 157 (0% women) 43 with PTSD 37 with PTSD and MDD 38 with MDD 39 controls |
Friedewald formula Fasting mg/dL Continuous |
SCID for DSM-IV Montgomery-Asberg Depression Rating Scale (MADRS) |
| (Katon, Lin et al. 2004) | cross-sectional | 4,225 (48.7% women) Stratified by CVD: 2,017 without CVD 991 with CVD |
Not reported mg/dL Categorical |
Patient Health Questionnaire(PHQ-9) 493 participants (11.7%) met case criteria 320 participants without CVD (10.6%) met case criteria 173 participants with CVD (14.2%) met case criteria |
| (Huang 2005) | case-control | 168 (67.8% women) 109 with depression 59 normal controls |
Direct measure Fasting mg/dL Continuous |
SCID for DSM-IV |
| (Roy and Roy 2006) | cross-sectional | 459 (58.7% women) | Not reported mg/dL Continuous |
BDI Cases were defined as BDI ≥ 14 123 participants (26.8%) met case criteria |
| (Almeida, Flicker et al. 2007) | cross-sectional | 4,204 (0% women) | Friedewald formula Fasting mmol/L Categorical |
15-item Geriatric Depression Scale (GDS-15) Cases were defined as GDS-15 ≥ 7 212 participants (5.0%) met case criteria |
| (Garland, Hallahan et al. 2007) | 1:1 age- and sex-matched case-control | 80 (67.5% women) 40 with self-harm 40 controls |
Not reported Fasting mmol/L Continuous |
BDI |
| (Igna, Julkunen et al. 2008) | cross-sectional | 694 (0% women) | Friedewald formula Fasting mmol/L Continuous |
BDI Cases were defined as BDI ≥ 19 50 participants (7.20%) met case criteria* *Supplemental data provided by corresponding author |
| (Lehto, Hintikka et al. 2008) | nested case-control | 124 (71% women) 63 with depression 61 controls |
Friedewald formula Fasting mmol/L Categorical |
BDI Cases were defined as BDI ≥ 10 Controls were defined as BDI <10 Diagnoses verified via SCID for DSM-IV Severity assessed using HAM-D-21 |
| (Giltay, van Reedt Dortland et al. 2009) | prospective cohort | 832 (0% women) | Friedewald formula Fasting (Finland cohort) Non-fasting (Italy and the Netherlands cohorts) mmol/L Continuous |
Zung Self-rating Depression Scale Cases were defined as Zung Self-rating Depression Scale score ≥ 60 99 participants (11.90%) met case criteria* *Supplemental data provided by corresponding author |
| (Ji-Rong, Bi-Rong et al. 2009) | cross-sectional | 678 (67.8% women) | Direct measure Fasting mmol/L Categorical |
Geriatric Depression Scale – Chinese edition (GDS-CD) Cases were defined as GDS-CD ≥ 10 226 participants (33.3%) met case criteria |
| (Sagud, Mihaljevic-Peles et al. 2009) | case-control | 125 (100% women) 41 with bipolar 1 (22 in manic episode and 19 in depressive episode) 34 with major depression 50 controls |
Direct measure Fasting mmol/L Continuous |
SCID for DSM-IV HAMD-17 Young Mania Rating Scale (YMRS) MDD and bipolar depression cases were defined as HAMD-17 ≥ 18 and YMRS ≤ 5 |
| (Ancelin, Carriere et al. 2010) | prospective cohort | 1792 (58.0% women) | Friedewald formula Fasting mmol/L Categorical |
Mini International Neuropsychiatric Interview (MINI) to confirm diagnosis of MDD CES-D Cases were defined as CES-D ≥ 16 536 participants (29.9%) met case criteria, which included 159 men and 377 women |
| (Das, Malhotra et al. 2010) | case-control | 60 (sex not reported) 30 with depression 30 controls |
Direct measure Fasting mg/dL Continuous |
Semi-structured interview using DSM-IV criteria HAM-D Cases were defined as HAM-D > 7 |
| (Egede and Ellis 2010) | cross-sectional | 201 (72.6% women) | Not reported Abstracted from electronic medical records mg/dL Continuous |
CES-D Cases were defined as CES-D ≥ 16 40 participants (20%) met case criteria |
| (Heckbert, Rutter et al. 2010) | prospective cohort | 3,762 (47.9% women) | Not reported Abstracted from electronic medical records mg/dL Continuous |
PHQ-9 Case definition criteria not reported 319 participants (8.5%) met case criteria for minor depression 448 participants (11.9%) met case criteria for major depression |
| (Lehto, Ruusunen et al. 2010) | cross-sectional | 2456 (0% women) | Direct measure Fasting mmol/L Continuous and categorical |
18-item Human Population Laboratory Depression Scale (HPL-D) Cases were defined as HPL-D ≥ 5 269 participants (10.9%) met case criteria |
| (Lehto, Niskanen et al. 2010) | 1:1 age- and sex-matched case-control | 176 (55.7% women) 88 with depression (43 with long duration of symptoms and 45 with short duration of symptoms) 88 controls |
Friedewald formula Fasting mmol/L Categorical |
SCID for DSM-IV BDI |
| (van Reedt Dortland, Giltay et al. 2010) | case-control | 2,461 (66.9% women) 761 with current MDD 1,071 with remitted MDD 629 controls |
Direct measure Fasting mg/dL Continuous |
Composite International Diagnostic Interview using DSM-IV criteria for MDD 30-item Inventory of Depressive Symptoms – Self-Report |
| (Sadeghi, Roohafza et al. 2011) | case-control | 300 (63.3% women) 153 with depression 147 controls |
Friedewald formula Fasting mg/dL Continuous |
SCID for DSM-IV HAM-D was used to quantify depression severity |
| (Tedders, Fokong et al. 2011) | cross-sectional | 8,390 (50.9% women) | Friedewald formula Fasting Categorical |
PHQ-9 Mild-to-moderate depression was defined as a PHQ-9 of 10-19 Severe depression was defined as PHQ-9 ≥ 20 226 participants (2.7%) met case criteria for severe depression; of these, 71 were men and 155 were women 1683 participants (20.0%) met case criteria for mild-to-moderate depression; of these, 676 were men and 1,007 were women |
| (Fang, Egleston et al. 2013) | cross-sectional | 225 (100% women) | Friedewald formula Fasting mg/dL Continuous |
CES-D Cases defined as CES-D ≥ 16 20 participants (8.89%) met case criteria* *Supplemental data provided by corresponding author |
| (Kale, Kale et al. 2014) | case-control | 70 (58.6% women) 40 with depression 30 controls |
Direct measure Fasting mg/dL Continuous |
BDI |
| (Liang, Yan et al. 2014) | cross-sectional | 1,839 (59.2% women) | Direct measure Fasting mmol/L Categorical |
GDS-15 Continuous and categorical Case definition not reported 311 participants (16.9%) met case criteria |
| (Palta, Golden et al. 2014) | prospective cohort | 613 (69.5% women) | Friedewald formula Fasting mmol/L Continuous |
Brief Comprehensive Assessment and Referral Evaluation (SHORT-CARE) Cases were defined as SHORT-CARE score ≥ 7 218 participants (35.6%) met case criteria |
| (Patra, Khandelwal et al. 2014) | 1:1 age- and sex-matched case-control | 60 (36.6% women) 30 with depression 30 controls |
Friedewald formula Fasting mg/dL Continuous |
ICD-10-DCR HAM-D |
| (Rahiminejad, Moaddab et al. 2014) | cross-sectional | 120 (100% women) | Not reported mg/dL Continuous |
BDI Semi-structured interview using DSM-IV criteria Cases were defined as BDI > 15 38 participants (31.7%) met case criteria |
| (Schwartz, Rowland et al. 2014) | twin study | 376 (55.4% women) | Friedewald formula Fasting mmol/L Continuous |
CES-D Cases were defined as CES-D ≥ 16 39 participants (10.37%) met case criteria |
| (Teofilo, Farias et al. 2014) | prospective cohort | 238 (100% women) | Friedewald formula Fasting mg/dL Continuous |
Edinburgh Postnatal Depression Scale (EDPS) Cases were defined as EDPS ≥ 11 82 participants (34.5%) met case criteria |
| (Vargas, Nunes et al. 2014) | case-control | 342 (66.1% women) 92 with depression 49 with bipolar disorder 201 controls |
Friedewald formula Fasting mg/dL Continuous |
semi-structured interview for DSM-IV HAM-D |
Results
The 42 studies identified as eligible for inclusion in this systematic review and meta-analysis employed a variety of reporting methods; for this reason, a series of meta-analyses were conducted, dividing between studies that modeled serum LDL as a continuous measure and those that modeled serum LDL as a categorical measure.
Meta-analysis of Studies Modeling Serum LDL as a Continuous Measure
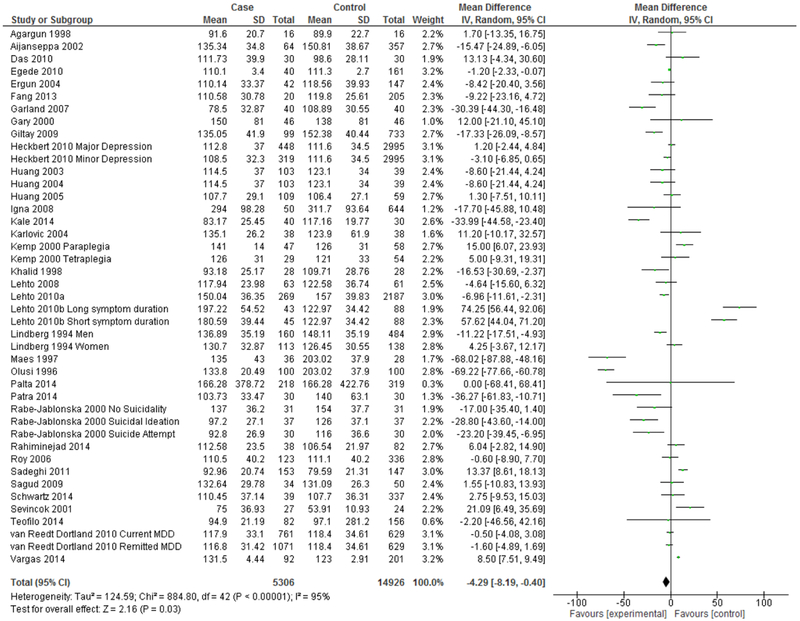
A total of 36 eligible studies modeled serum LDL as a continuous measure. Of these, 32 studies reported the mean and standard deviation by depression status. An additional three studies reported the mean and 95% confidence interval and one study reported the mean and standard error, from which standard deviations were hand-calculated. Meta-analysis for these 36 studies reporting mean and standard deviation by depression status can be seen in Figure 2. Meta-analysis of studies modeling serum LDL as a continuous measure demonstrates overall significantly lower serum LDL in depression (Mean difference=−4.29 mg/dL, 95% CI=−8.19, −0.40, p=0.03).
Figure 2.
Forest Plot of Studies Modeling Continuous LDL
Heterogeneity
High heterogeneity was found with respect to studies modeling serum LDL as a continuous measure (I2 = 95%). To address the possibility that high heterogeneity might be explained by variations in study design, sub-analyses were conducted to distinguish between case-control and cohort studies, and between prevalent and incident depression. The results of these analyses can be seen in Figures 3–6.
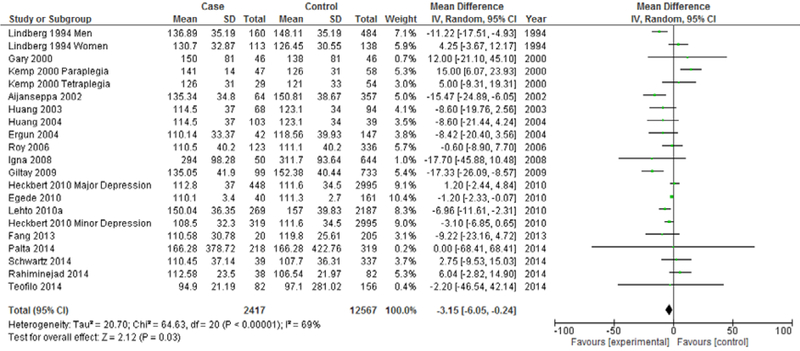
Figure 3.
Forest Plot of Cohort Studies Modeling Continuous LDL
Figure 6.
Forest Plot of Incident Depression Studies Modeling Continuous LDL
Sub-analyses to Address Moderation by Study Design:
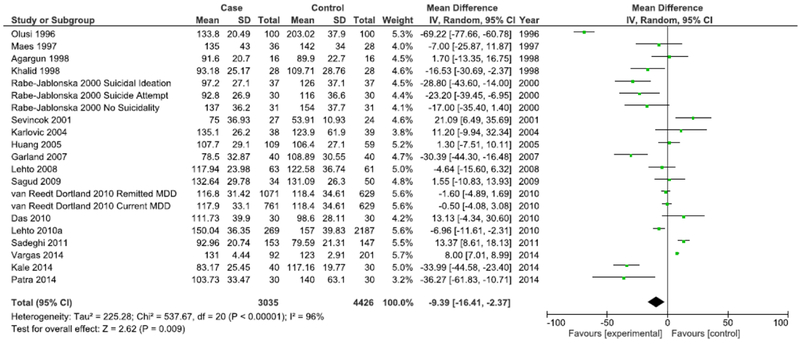
Sub-analyses were conducted to examine whether heterogeneity might be explained by variations in study design, participant characteristics, or depression assessment method and whether these variations may also influence the overall effect estimate for the association between LDL and depression. The first such analysis distinguishes between case-control studies and cohort studies (Figures 3 & 4). While case-control studies continued to demonstrate high heterogeneity (I2=96%), a marked decrease in heterogeneity was seen in meta-analysis of cohort studies (I2=69%). Both cohort studies (Mean difference=−3.15 mg/dL, 95% CI=−6.05, −0.24, p<0.001) and case-control studies (Mean difference=−9.39 mg/dL, 95% CI=−16.41, −2.37, p<0.001) continued to demonstrate an overall significantly lower mean LDL in depression, with case-control studies demonstrating a more marked overall difference.
Figure 4.
Forest Plot of Case-control Studies Modeling Continuous LDL
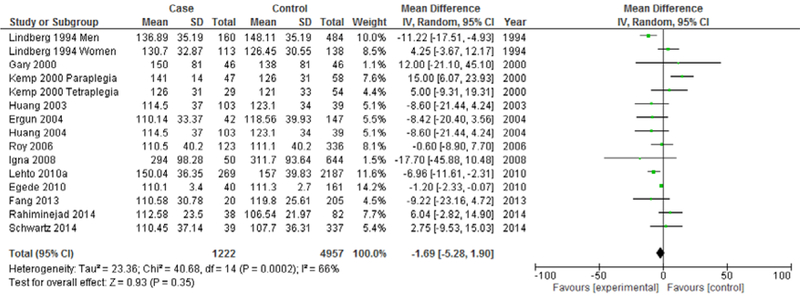
The next analysis distiniguishes between studies reporting prevalent depression and studies reporting incident depression (Figures 5 & 6). Heterogeneity showed a marked decrease for both studies reporting prevalent depression (I2=66%) and studies reporting incident depression (I2=77%). Both prevalent depression studies (Mean difference: −1.69 mg/dL, 95% CI=−5.28, 1.90, p<0.001) and incident depression studies (Mean difference=−7.21 mg/dL, 95% CI=−14.20, −0.21, p<0.001) continued to demonstrate an overall significantly lower mean LDL in depression, with incident depression studies demonstrating a more marked overall difference.
Figure 5.
Forest Plot of Prevalent Depression Studies Modeling Continuous LDL
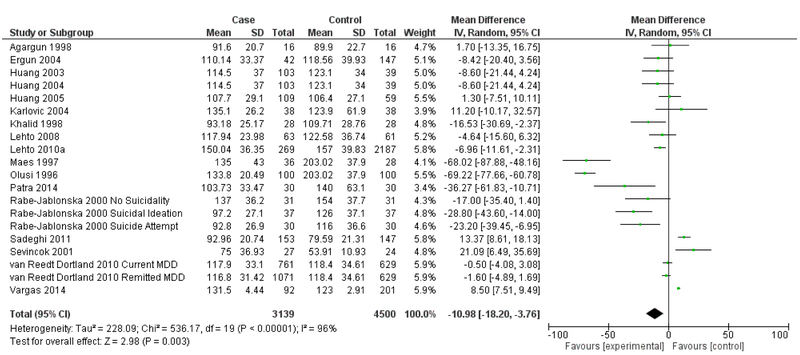
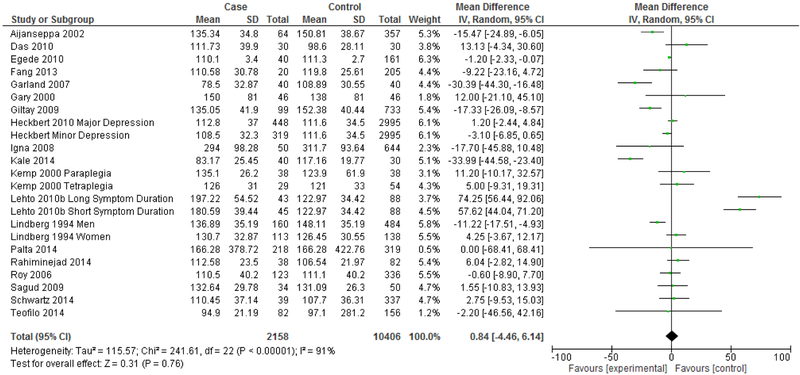
The next analysis distinguishes between studies reporting clinical diagnosis of depression and those that utilized self-assessment instruments (Figures 7 & 8). Heterogeneity remained high for studies that assessed depression via clinical diagnosis (I2=96%) and for studies that assessed depression via self-assessment instrument (I2=91%). Studies that measured depression via clinical diagnosis continued to demonstrate an overall significantly lower mean LDL in depression (Mean difference= −10.98 mg/dL, 95% CI=−18.20, −3.76, p=0.003), but this effect was not seen in studies that measured depression via self-assessment instrument (Mean difference= 0.84 mg/dL, 95% CI=−4.46, 6.14, p=0.76).
Figure 7.
Forest Plot of Studies Using Clinical Depression Diagnosis
Figure 8.
Forest Plot of Studies Using Depression Self-Assessment Instruments
The next set of analyses stratifies by gender, reporting meta-analytic results for men (Figure 9) and women (Figure 10) for studies in which data was presented separately by sex. Heterogeneity showed a marked decrease for both the men-only (I2=30%) and the women-only strata (I2=31%). The men-only studies continued to demonstrate an overall significantly lower mean LDL in depression (Mean difference= −9.65 mg/dL, 95% CI=−13.81, −5.50, p<0.001), but this effect was not seen in the women-only studies (Mean difference= 1.30 mg/dL, 95% CI=−4.04, 6.64, p=0.63).
Figure 9.
Forest Plot of Men-only Studies
Figure 10.
Forest Plot for Women-only Studies
Together, these sub-analyses suggest that heterogeneity may be in part explained by variations in study design, participant characteristics, and assessment of depression status and that these may be important considerations in deriving and interpreting effect estimates.
Meta-analysis of Studies Modeling Serum LDL as a Categorical Measure
A total of seven eligible studies modeled serum LDL as a categorical measure, reporting study findings as an odds ratio and 95% confidence interval. Meta-analysis of studies modeling serum LDL as a categorical measure was conducted using high serum LDL as the reference group. For studies reporting low serum LDL as the reference group (Katon, Lin et al. 2004, Almeida, Flicker et al. 2007, Tedders, Fokong et al. 2011), the inverse of the odds ratio and 95% confidence interval was calculated to reflect high serum LDL as the reference group. The threshold used to define low LDL varied by study, including cutpoints of 89 mg/dL (men) and 92 mg/dL (women) (Tedders, Fokong et al. 2011), 116 mg/dL (Lehto, Hintikka et al. 2008, Lehto, Niskanen et al. 2010, Lehto, Ruusunen et al. 2010), 118 mg/dL (men) and 120 mg/dL (women) (Ancelin, Carriere et al. 2010), 130 mg/dL (Katon, Lin et al. 2004, Ji-Rong, Bi-Rong et al. 2009), 131 mg/dL (Almeida, Flicker et al. 2007), and 158 mg/dL (Liang, Yan et al. 2014), with cutpoints differing between studies by as much as 69 mg/dL.
Meta-analysis of studies modeling serum LDL as a categorical measure can be seen in Figure 11. Meta-analysis for these seven studies demonstrates a marginally significant lower odds of depression in the presence of low serum LDL relative to high serum LDL (OR=0.90, 95% CI=0.80, 1.01, p=0.08).
Figure 11.
Forest Plot of Studies Reporting Odds Ratios
The studies by Ancelin et al. (Ancelin, Carriere et al. 2010) and Tedders et al. (Tedders, Fokong et al. 2011) both used an intermediate LDL category (120.26 mg/dL – 165.51 mg/dL and 92 mg/dL – 137 mg/dL, respectively) as the reference group, which may not be comparable to studies that compared low serum LDL relative to high serum LDL. To account for this possibility, a subsequent analysis was conducted following the exclusion of the aforementioned studies. This analysis demonstrates a statistically significant lower odds of depression in the presence of low serum LDL relative to high serum LDL (OR=0.85, 95% CI=0.73, 0.99, p=0.04).
Publication Bias
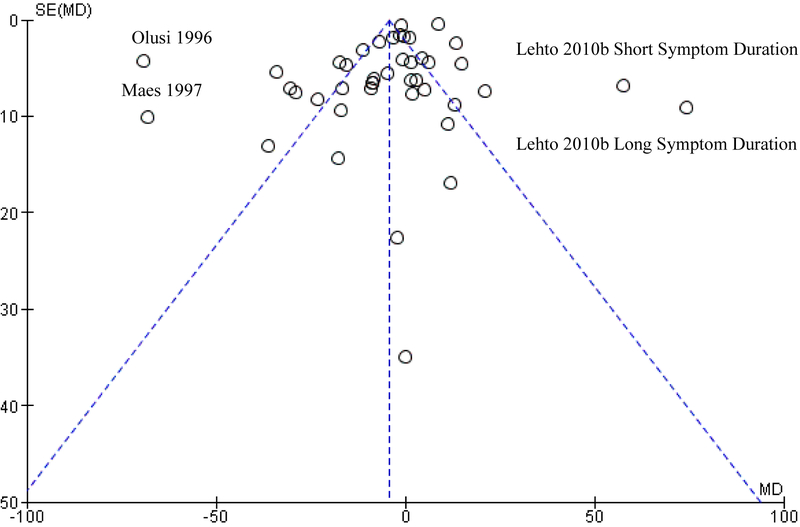
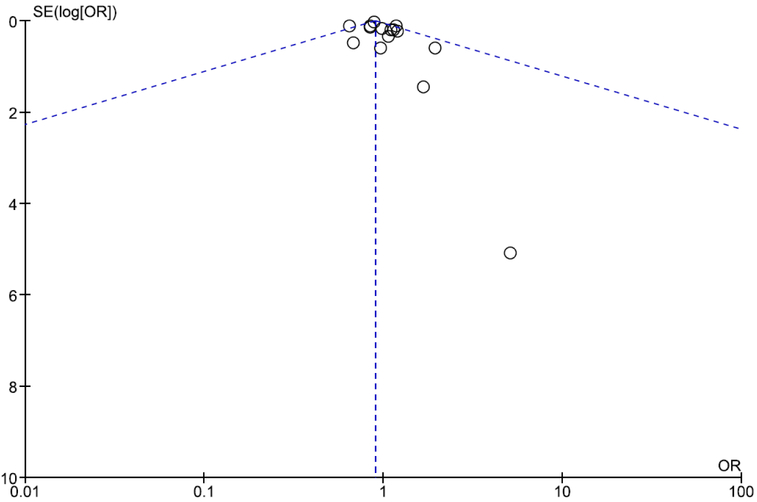
The potential for publication bias to influence study findings was assessed visually via funnel plot and quantitatively via Egger’s test. Funnel plots indicate moderate asymmetry, which suggests that publication bias cannot be entirely ruled out as an influential factor. Separate funnel plots for studies modeling serum LDL as a continuous measure and studies modeling serum LDL as a categorical measure can be seen in Figures 12 and 13.
Figure 12.
Funnel Plot for Studies Modeling Serum LDL as a Continuous Measure
Figure 13.
Funnel Plot for Studies Modeling Serum LDL as a Categorical Measure
Egger’s test was used for quantitative analysis of the potential for publication bias for studies modeling serum LDL as a continuous measure. Egger’s test is a linear regression analysis that tests for a linear association between each included study’s standard normal deviate (mean/standard error) and precision (1/standard error), weighted by the inverse of its variance (Egger, Davey Smith et al. 1997, Rothstein, Sutton et al. 2005). This test was selected because it is the preferred method recommended by the Cochrane Group for assessment of funnel plot asymmetry for meta-analyses with continuous outcomes and an effect measured as mean difference (Higgins and Green 2006). Analysis was conducted using SAS 9.3 using the PUB_BIAS macro developed by Rendina-Gobioff and Kromrey (Rendina-Gobioff 2006). The Egger’s test detected publication bias within this study sample (t=−7.168, p<0.0001).
Quantitative analysis of the potential for publication bias for studies modeling serum LDL as a categorical variable was not undertaken due to the small number of studies included in the analysis; generally, meta-analyses including fewer than ten studies are considered to be underpowered to detect funnel plot asymmetry and as such performing quantitative tests of funnel plot asymmetry on is not advised (Higgins and Green 2006).
Discussion
Overall, this systematic review and meta-analysis echoes the earlier work of Shin et al. in the detection of lower mean serum LDL in depression. Interestingly, meta-analysis of studies modeling serum LDL as a categorical measure suggests a reduced odds of depression in the presence of low serum LDL relative to high serum LDL, in contrast to the findings suggested by analysis of serum LDL modeled as a continuous measure. One explanation for these contradictory findings may lie in the lack of consensus in the selection of the cut-off point by which to distinguish between low and high serum LDL in modeling serum LDL as a categorical measure, suggesting that more work must be done toward identifying an appropriate cutpoint by which to distinguish low LDL from LDL that is within normal limits or high.
The seemingly discordant findings observed between the meta-analysis of those studies which used cholesterol as a continuous measure and those which used cholesterol as a categorical measure may also suggest the presence of a U-shaped relationship between serum LDL and depression, with both high and low levels of serum LDL associated with an increased risk of depression. The cross-sectional association between depression and high serum LDL may be the product of a different mechanism than that underlying the cross-sectional association between depression and low serum LDL. It may be simultaneously true that low LDL heralds the onset of depression and that chronic depression, over the course of decades, leads to weight gain and, consequently, metabolic syndrome and high serum LDL, underscoring the importance of prospective analyses that can untangle the temporal association between depression and serum LDL levels.
Limitations
A limitation of this study is the high heterogeneity noted across sampled studies, which may be a function of variations in study design, participants sampled, or other factors. This meta-analysis is also limited in that it does not include data from unpublished studies and only a small number of authors provided supplemental data. The detection of publication bias suggests that additional unaccounted for data may exist.
Conclusions
This meta-analysis demonstrates a cross-sectional link between depression and low serum LDL for studies modeling serum LDL as a continuous measure. Findings in the opposite direction, however, were noted for studies modeling serum LDL as a categorical measure, underscoring the importance of prospective analyses to assess temporality and the need for more work must be done to arrive at a commonly agreed-upon threshold by which to distinguish low LDL within a psychiatric context.
References
- Agargun MY, Algun E, Sekeroglu R, Kara H and Tarakcioglu M (1998). “Low cholesterol level in patients with panic disorder: the association with major depression.” J Affect Disord 50(1): 29–32. [DOI] [PubMed] [Google Scholar]
- Aijanseppa S, Kivinen P, Helkala EL, Kivela SL, Tuomilehto J and Nissinen A (2002). “Serum cholesterol and depressive symptoms in elderly Finnish men.” Int J Geriatr Psychiatry 17(7): 629–634. [DOI] [PubMed] [Google Scholar]
- Almeida OP, Flicker L, Norman P, Hankey GJ, Vasikaran S, van Bockxmeer FM and Jamrozik K (2007). “Association of cardiovascular risk factors and disease with depression in later life.” Am J Geriatr Psychiatry 15(6): 506–513. [DOI] [PubMed] [Google Scholar]
- Ancelin ML, Carriere I, Boulenger JP, Malafosse A, Stewart R, Cristol JP, Ritchie K, Chaudieu I and Dupuy AM (2010). “Gender and genotype modulation of the association between lipid levels and depressive symptomatology in community-dwelling elderly (the ESPRIT study).” Biol Psychiatry 68(2): 125–132. [DOI] [PubMed] [Google Scholar]
- Beasley CL, Honer WG, Bergmann K, Falkai P, Lutjohann D and Bayer TA (2005). “Reductions in cholesterol and synaptic markers in association cortex in mood disorders.” Bipolar Disord 7(5): 449–455. [DOI] [PubMed] [Google Scholar]
- Das PP, Malhotra S, Chakrabarti S and Sharma S (2010). “Elevated total cholesterol in severely depressed patients: role in cardiovascular risk?” World J Biol Psychiatry 11(2 Pt 2): 321–328. [DOI] [PubMed] [Google Scholar]
- Dreja K, Voldstedlund M, Vinten J, Tranum-Jensen J, Hellstrand P and Sward K (2002). “Cholesterol depletion disrupts caveolae and differentially impairs agonist-induced arterial contraction.” Arterioscler Thromb Vasc Biol 22(8): 1267–1272. [DOI] [PubMed] [Google Scholar]
- Egede LE and Ellis C (2010). “The effects of depression on metabolic control and quality of life in indigent patients with type 2 diabetes.” Diabetes Technol Ther 12(4): 257–262. [DOI] [PMC free article] [PubMed] [Google Scholar]
- Egger M, Davey Smith G, Schneider M and Minder C (1997). “Bias in meta-analysis detected by a simple, graphical test.” BMJ 315(7109): 629–634. [DOI] [PMC free article] [PubMed] [Google Scholar]
- Elovainio M, Keltikangas-Jarvinen L, Pulkki-Raback L, Kivimaki M, Puttonen S, Viikari L, Rasanen L, Mansikkaniemi K, Viikari J and Raitakari OT (2006). “Depressive symptoms and C-reactive protein: the Cardiovascular Risk in Young Finns Study.” Psychol Med 36(6): 797–805. [DOI] [PubMed] [Google Scholar]
- Engelberg H (1992). “Low serum cholesterol and suicide.” Lancet 339(8795): 727–729. [DOI] [PubMed] [Google Scholar]
- Ergun UG, Uguz S, Bozdemir N, Guzel R, Burgut R, Saatci E and Akpinar E (2004). “The relationship between cholesterol levels and depression in the elderly.” Int J Geriatr Psychiatry 19(3): 291–296. [DOI] [PubMed] [Google Scholar]
- Fang CY, Egleston BL, Gabriel KP, Stevens VJ, Kwiterovich PO Jr., Snetselaar LG, Longacre ML and Dorgan JF (2013). “Depressive symptoms and serum lipid levels in young adult women.” J Behav Med 36(2): 143–152. [DOI] [PMC free article] [PubMed] [Google Scholar]
- Freemantle E, Chen GG, Cruceanu C, Mechawar N and Turecki G (2013). “Analysis of oxysterols and cholesterol in prefrontal cortex of suicides.” Int J Neuropsychopharmacol 16(6): 1241–1249. [DOI] [PubMed] [Google Scholar]
- Garland MR, Hallahan B, McNamara M, Carney PA, Grimes H, Hibbeln JR, Harkin A and Conroy RM (2007). “Lipids and essential fatty acids in patients presenting with self-harm.” Br J Psychiatry 190: 112–117. [DOI] [PubMed] [Google Scholar]
- Gary TL, Crum RM, Cooper-Patrick L, Ford D and Brancati FL (2000). “Depressive symptoms and metabolic control in African-Americans with type 2 diabetes.” Diabetes Care 23(1): 23–29. [DOI] [PubMed] [Google Scholar]
- Giltay EJ, van Reedt Dortland AK, Nissinen A, Giampaoli S, van Veen T, Zitman FG, Bots S and Kromhout D (2009). “Serum cholesterol, apolipoprotein E genotype and depressive symptoms in elderly European men: the FINE study.” J Affect Disord 115(3): 471–477. [DOI] [PubMed] [Google Scholar]
- Heckbert SR, Rutter CM, Oliver M, Williams LH, Ciechanowski P, Lin EH, Katon WJ and Von Korff M (2010). “Depression in relation to long-term control of glycemia, blood pressure, and lipids in patients with diabetes.” J Gen Intern Med 25(6): 524–529. [DOI] [PMC free article] [PubMed] [Google Scholar]
- Higgins JPT and Green S (2006). Cochrane Handbook for Systematic Reviews of Interventions 4.2.6. In: The Cochrane Library, Issue 4, 2006 Chichester, UK, John Wiley & Sons, Ltd. [Google Scholar]
- Huang TL (2005). “Serum lipid profiles in major depression with clinical subtypes, suicide attempts and episodes.” J Affect Disord 86(1): 75–79. [DOI] [PubMed] [Google Scholar]
- Huang TL and Chen JF (2004). “Lipid and lipoprotein levels in depressive disorders with melancholic feature or atypical feature and dysthymia.” Psychiatry Clin Neurosci 58(3): 295–299. [DOI] [PubMed] [Google Scholar]
- Huang TL, Wu SC, Chiang YS and Chen JF (2003). “Correlation between serum lipid, lipoprotein concentrations and anxious state, depressive state or major depressive disorder.” Psychiatry Res 118(2): 147–153. [DOI] [PubMed] [Google Scholar]
- Igna CV, Julkunen J, Vanhanen H, Keskivaara P and Verkasalo M (2008). “Depressive symptoms and serum lipid fractions in middle-aged men: physiologic and health behavior links.” Psychosom Med 70(9): 960–966. [DOI] [PubMed] [Google Scholar]
- Ji-Rong Y, Bi-Rong D, Chang-Quan H and Yan-Ling Z (2009). “Depression and serum lipids and lipoprotein in Chinese nonagenarians and centenarians.” J Am Geriatr Soc 57(4): 732–733. [DOI] [PubMed] [Google Scholar]
- Kale AB, Kale SB, Chalak SS, Bang RTS,G, Agrawal M and Kaple M (2014). “Lipid parameters - significance in patients with endogenous depression.” J Clin Diagn Res 8(1): 17–19. [DOI] [PMC free article] [PubMed] [Google Scholar]
- Karlovic D, Buljan D, Martinac M and Marcinko D (2004). “Serum lipid concentrations in Croatian veterans with post-traumatic stress disorder,post-traumatic stress disorder comorbid with major depressive disorder,or major depressive disorder.” J Korean Med Sci 19(3): 431–436. [DOI] [PMC free article] [PubMed] [Google Scholar]
- Katon WJ, Lin EH, Russo J, Von Korff M, Ciechanowski P, Simon G, Ludman E, Bush T and Young B (2004). “Cardiac risk factors in patients with diabetes mellitus and major depression.” J Gen Intern Med 19(12): 1192–1199. [DOI] [PMC free article] [PubMed] [Google Scholar]
- Kemp BJ, Spungen AM, Adkins RH, Krause JS and Bauman WA (2000). “The relationships among serum lipid levels, adiposity, and depressive symptomatology in persons aging with spinal cord injury.” J Spinal Cord Med 23(4): 216–220. [DOI] [PubMed] [Google Scholar]
- Khalid A, Lal N, Trivedi JK, Dalal PK, Asthana OP, Srivastava JS and Akhtar A (1998). “Serum lipids : new biological markers in depression ?” Indian J Psychiatry 40(3): 217–223. [PMC free article] [PubMed] [Google Scholar]
- Lehto SM, Hintikka J, Niskanen L, Tolmunen T, Koivumaa-Honkanen H, Honkalampi K and Viinamaki H (2008). “Low HDL cholesterol associates with major depression in a sample with a 7-year history of depressive symptoms.” Prog Neuropsychopharmacol Biol Psychiatry 32(6): 1557–1561. [DOI] [PubMed] [Google Scholar]
- Lehto SM, Niskanen L, Tolmunen T, Hintikka J, Viinamaki H, Heiskanen T, Honkalampi K, Kokkonen M and Koivumaa-Honkanen H (2010). “Low serum HDL-cholesterol levels are associated with long symptom duration in patients with major depressive disorder.” Psychiatry Clin Neurosci 64(3): 279–283. [DOI] [PubMed] [Google Scholar]
- Lehto SM, Ruusunen A, Niskanen L, Tolmunen T, Voutilainen S, Viinamaki H, Kaplan GA and Kauhanen J (2010). “Elevated depressive symptoms and compositional changes in LDL particles in middle-aged men.” Eur J Epidemiol 25(6): 403–409. [DOI] [PMC free article] [PubMed] [Google Scholar]
- Liang Y, Yan Z, Cai C, Jiang H, Song A and Qiu C (2014). “Association between lipid profile and depressive symptoms among Chinese older people: mediation by cardiovascular diseases?” Int J Behav Med 21(4): 590–596. [DOI] [PubMed] [Google Scholar]
- Lindberg G, Larsson G, Setterlind S and Rastam L (1994). “Serum lipids and mood in working men and women in Sweden.” J Epidemiol Community Health 48(4): 360–363. [DOI] [PMC free article] [PubMed] [Google Scholar]
- Maes M, Smith R, Christophe A, Vandoolaeghe E, Van Gastel A, Neels H, Demedts P, Wauters A and Meltzer HY (1997). “Lower serum high-density lipoprotein cholesterol (HDL-C) in major depression and in depressed men with serious suicidal attempts: relationship with immune-inflammatory markers.” Acta Psychiatr Scand 95(3): 212–221. [DOI] [PubMed] [Google Scholar]
- Moher D, Liberati A, Tetzlaff J and Altman DG (2009). “Preferred reporting items for systematic reviews and meta-analyses: the PRISMA statement.” BMJ 339: b2535. [DOI] [PMC free article] [PubMed] [Google Scholar]
- Olusi SO and Fido AA (1996). “Serum lipid concentrations in patients with major depressive disorder.” Biol Psychiatry 40(11): 1128–1131. [DOI] [PubMed] [Google Scholar]
- Orth M and Bellosta S (2012). “Cholesterol: its regulation and role in central nervous system disorders.” Cholesterol 2012: 292598. [DOI] [PMC free article] [PubMed] [Google Scholar]
- Palta P, Golden SH, Teresi JA, Palmas W, Trief P, Weinstock RS, Shea S, Manly JJ and Luchsinger JA (2014). “Depression is not associated with diabetes control in minority elderly.” J Diabetes Complications 28(6): 798–804. [DOI] [PMC free article] [PubMed] [Google Scholar]
- Patra BN, Khandelwal SK, Chadda RK and Ramakrishnan L (2014). “A controlled study of serum lipid profiles in Indian patients with depressive episode.” Indian J Psychol Med 36(2): 129–133. [DOI] [PMC free article] [PubMed] [Google Scholar]
- Pozzi F, Troisi A, Cerilli M, Autore AM, Lo Castro C, Ribatti D and Frajese G (2003). “Serum cholesterol and impulsivity in a large sample of healthy young men.” Psychiatry Res 120(3): 239–245. [DOI] [PubMed] [Google Scholar]
- Pucadyil TJ and Chattopadhyay A (2005). “Cholesterol modulates the antagonist-binding function of hippocampal serotonin1A receptors.” Biochim Biophys Acta 1714(1): 35–42. [DOI] [PubMed] [Google Scholar]
- Pucadyil TJ and Chattopadhyay A (2007). “Cholesterol depletion induces dynamic confinement of the G-protein coupled serotonin(1A) receptor in the plasma membrane of living cells.” Biochim Biophys Acta 1768(3): 655–668. [DOI] [PubMed] [Google Scholar]
- Rabe-Jablonska J and Poprawska I (2000). “Levels of serum total cholesterol and LDL-cholesterol in patients with major depression in acute period and remission.” Med Sci Monit 6(3): 539–547. [PubMed] [Google Scholar]
- Rahiminejad ME, Moaddab A, Rabiee S, Esna-Ashari F, Borzouei S and Hosseini SM (2014). “The relationship between clinicobiochemical markers and depression in women with polycystic ovary syndrome.” Iran J Reprod Med 12(12): 811–816. [PMC free article] [PubMed] [Google Scholar]
- Rendina-Gobioff GK, J D (2006) “PUB_BIAS: A SAS Macro for Detecting Publication Bias in Meta-Analysis.” [Google Scholar]
- Rothstein HR, Sutton AJ and Borenstein M (2005). Publication Bias in Meta-Analysis: Prevention, Assessment, and Adjustments. The Atrium, Southern Gate, Chichester, John Wiley & Sons, Ltd. [Google Scholar]
- Roy A and Roy M (2006). “No relationship between serum cholesterol and suicidal ideation and depression in African-American diabetics.” Arch Suicide Res 10(1): 11–14. [DOI] [PubMed] [Google Scholar]
- Rutledge T, Reis SE, Olson M, Owens J, Kelsey SF, Pepine CJ, Reichek N, Rogers WJ, Merz CN, Sopko G, Cornell CE and Matthews KA (2001). “Psychosocial variables are associated with atherosclerosis risk factors among women with chest pain: the WISE study.” Psychosom Med 63(2): 282–288. [DOI] [PubMed] [Google Scholar]
- Sadeghi M, Roohafza H, Afshar H, Rajabi F, Ramzani M, Shemirani H and Sarafzadeghan N (2011). “Relationship between depression and apolipoproteins A and B: a case-control study.” Clinics (Sao Paulo) 66(1): 113–117. [DOI] [PMC free article] [PubMed] [Google Scholar]
- Sagud M, Mihaljevic-Peles A, Pivac N, Jakovljevic M and Muck-Seler D (2009). “Lipid levels in female patients with affective disorders.” Psychiatry Res 168(3): 218–221. [DOI] [PubMed] [Google Scholar]
- Schwartz JA, Rowland MW and Beaver KM (2014). “A genetically informed test of cholesterol levels and self-control, depressive symptoms, antisocial behavior, and neuroticism.” J Affect Disord 164: 139–147. [DOI] [PubMed] [Google Scholar]
- Sevincok L, Buyukozturk A and Dereboy F (2001). “Serum lipid concentrations in patients with comorbid generalized anxiety disorder and major depressive disorder.” Can J Psychiatry 46(1): 68–71. [DOI] [PubMed] [Google Scholar]
- Shin JY, Suls J and Martin R (2008). “Are cholesterol and depression inversely related? A meta-analysis of the association between two cardiac risk factors.” Ann Behav Med 36(1): 33–43. [DOI] [PubMed] [Google Scholar]
- Sjogren B and Svenningsson P (2007). “Caveolin-1 affects serotonin binding and cell surface levels of human 5-HT7(a) receptors.” FEBS Lett 581(26): 5115–5121. [DOI] [PubMed] [Google Scholar]
- Sjogren B and Svenningsson P (2007). “Depletion of the lipid raft constituents, sphingomyelin and ganglioside, decreases serotonin binding at human 5-HT7(a) receptors in HeLa cells.” Acta Physiol (Oxf) 190(1): 47–53. [DOI] [PubMed] [Google Scholar]
- Sommer B, Montano LM, Carbajal V, Flores-Soto E, Ortega A, Ramirez-Oseguera R, Irles C, El-Yazbi AF, Cho WJ and Daniel EE (2009). “Extraction of membrane cholesterol disrupts caveolae and impairs serotonergic (5-HT2A) and histaminergic (H1) responses in bovine airway smooth muscle: role of Rho-kinase.” Can J Physiol Pharmacol 87(3): 180–195. [DOI] [PubMed] [Google Scholar]
- Tedders SH, Fokong KD, McKenzie LE, Wesley C, Yu L and Zhang J (2011). “Low cholesterol is associated with depression among US household population.” J Affect Disord 135(1–3): 115–121. [DOI] [PubMed] [Google Scholar]
- Teofilo MM, Farias DR, Pinto Tde J, Vilela AA, Vaz Jdos S, Nardi AE and Kac G (2014). “HDL-cholesterol concentrations are inversely associated with Edinburgh Postnatal Depression Scale scores during pregnancy: results from a Brazilian cohort study.” J Psychiatr Res 58: 181–188. [DOI] [PubMed] [Google Scholar]
- van Reedt Dortland AK, Giltay EJ, van Veen T, van Pelt J, Zitman FG and Penninx BW (2010). “Associations between serum lipids and major depressive disorder: results from the Netherlands Study of Depression and Anxiety (NESDA).” J Clin Psychiatry 71(6): 729–736. [DOI] [PubMed] [Google Scholar]
- Vargas HO, Nunes SO, Barbosa DS, Vargas MM, Cestari A, Dodd S, Venugopal K, Maes M and Berk M (2014). “Castelli risk indexes 1 and 2 are higher in major depression but other characteristics of the metabolic syndrome are not specific to mood disorders.” Life Sci 102(1): 65–71. [DOI] [PubMed] [Google Scholar]


