

Abstract
Background
Macrophage cholesterol efflux to high‐density lipoproteins (HDLs) is the first step of reverse cholesterol transport. The cholesterol efflux capacity (CEC) of HDL particles is a protective risk factor for coronary artery disease independent of HDL cholesterol levels. Using a genome‐wide association study approach, we aimed to identify pathways that regulate CEC in humans.
Methods and Results
We measured CEC in 5293 French Canadians. We tested the genetic association between 4 CEC measures and genotypes at >9 million common autosomal DNA sequence variants. These analyses yielded 10 genome‐wide significant signals (P<6.25×10⁻⁹) representing 7 loci. Five of these loci harbor genes with important roles in lipid biology (CETP,LIPC,LPL,APOA1/C3/A4/A5, and APOE /C1/C2/C4). Except for the APOE/C1/C2/C4 variant (rs141622900, P nonadjusted=1.0×10⁻¹¹; P adjusted=8.8×10⁻⁹), the association signals disappear when correcting for HDL cholesterol and triglyceride levels. The additional 2 significant signals were near the PPP1CB/PLB1 and RBFOX3/ENPP7 genes. In secondary analyses, we considered candidate functional variants for 58 genes implicated in HDL biology, as well as 239 variants associated with blood lipid levels and/or coronary artery disease risk by genome‐wide association study. These analyses identified 27 significant CEC associations, implicating 5 additional loci (GCKR,LIPG,PLTP,PPARA, and TRIB1).
Conclusions
Our genome‐wide association study identified common genetic variation at the APOE/C1/C2/C4 locus as a major determinant of CEC that acts largely independently of HDL cholesterol. We predict that HDL‐based therapies aiming at increasing CEC will be modulated by changes in the expression of apolipoproteins in this gene cluster.
Keywords: HDL efflux, genome‐wide association study, high‐density lipoprotein cholesterol
Subject Categories: Genetic, Association Studies; Atherosclerosis; Coronary Artery Disease
Clinical Perspective
What Is New?
A comprehensive genome‐wide association study performed in >5200 French Canadians identified a genetic association between the apolipoprotein E locus and cholesterol efflux capacity, an independent predictor of coronary artery disease.
What Are the Clinical Implications?
Apolipoprotein E or other apolipoproteins may, thus, represent quantifiable biomarkers of cholesterol efflux capacity in the context of coronary artery disease event prediction or explain the outcomes of high‐density lipoprotein–based therapies.
Introduction
Atherosclerosis development requires initial entry of cholesterol in the arterial wall, which then accumulates in macrophages. Intensive reduction of low‐density lipoprotein cholesterol results in regression of atherosclerosis and reduction in related clinical cardiovascular events, without preventing completely such cardiovascular complications. This suggests that other factors, like vascular inflammation and high‐density lipoproteins (HDLs), may be involved. Reverse cholesterol transport is the process whereby cholesterol is taken from peripheral tissues, like macrophages in the arterial wall, and brought back to the liver for excretion by a direct pathway involving HDL particles and an indirect pathway involving low‐density lipoprotein particles in humans. Because mendelian randomization has not been able to establish a strong causal link between HDL cholesterol (HDL‐C) levels and cardiovascular events,1 HDL functionality, rather than HDL‐C, is regarded as a biomarker of cardiovascular risk. Cholesterol efflux capacity (CEC) to HDL particles is the first step of reverse cholesterol transport, and that capacity of plasma HDL represents a key feature of their functionality. Cholesterol efflux from macrophages occurs mainly toward HDL particles through multiple pathways, including passive diffusion, as well as facilitated ABCG1‐ and SR‐BI–dependent transport and active ABCA1‐dependent transport.2 CEC of HDL represents the fraction of radiolabeled cholesterol exiting macrophages typically after 4 hours of incubation, and higher CEC values have been shown to be associated with reductions of both prevalent and incident cardiovascular disease,3, 4, 5 although conflicting reports have been published.6
Identification of the genetic determinants of CEC may provide insights into its underlying mechanisms and open potential therapeutic avenues. Using a family‐based study design, the heritability of CEC was estimated to be 13% to 31%.7 A previous association study of candidate genes involved in HDL biogenesis and remodeling, performed in 846 individuals, has suggested that genetic determinants of CEC are different in men and women, and independent of HDL‐C levels.8 In the GRAPHIC cohort (N=850 individuals with genotypes and CEC measures available), 7 of the 55 tested HDL‐C–associated variants were nominally associated with CEC (including the LIPC and CETP loci).7
Our aim was to identify common genetic determinants of CEC in a genome‐wide association study (GWAS) of >5000 participants from the Montreal Heart Institute (MHI) Biobank. Because the process of cholesterol efflux is ubiquitous in peripheral cells, CEC can be measured from multiple cell types (reviewed by Talbot et al9). Because the transporters involved vary between cell types, we conducted our study with 2 different models representing 4 different conditions. Specifically, CEC was measured from J774 mouse macrophages in which cholesterol efflux is dependent mostly on SR‐B1 and passive diffusion as well as mouse ABCA1 after its overexpression on overnight treatment with cAMP10; and baby hamster kidney (BHK) cells that overexpress human ABCA1 after overnight treatment with mifepristone.11 The ABCA1 transporter is especially important because it allows unidirectional flux of cholesterol to lipid‐free apolipoprotein A‐I and small HDL particles,12 and was tested with mifepristone‐stimulated BHK and cAMP‐stimulated J774 cells.
Methods
The data and study materials will not be made available to other researchers for purposes of reproducing the results because of ethical considerations. All analytical methods are readily available.
Participants
All participants were selected from the MHI Biobank and had 4 French‐Canadian grandparents,13, 14 Demographics and clinical variables for the selected participants are available in Table S1. The participants provided written informed consent, and the project was approved by the MHI ethics committee.
Blood Lipid and Biomarker Measures
Plasma samples were obtained from venous blood collected on potassium‐EDTA coated tubes (BD Vacutainers) and centrifuged according to the manufacturer's protocol. The samples were immediately aliquoted on ice and frozen at −80°C until analysis. All biomarker measurements were made without knowledge of genotypes. Lipid concentrations in serum were assessed by enzymatic/colorimetric assay using the Dimension Vista laboratory system (Siemens). Apolipoprotein A‐I and apolipoprotein B concentrations were obtained by nephelometry on a BN ProSpec nephelometer (Siemens). The plasma concentrations of lecithin/cholesterol acyltransferase and myeloperoxidase were measured by ELISAs from Alpco Diagnostics. Nuclear magnetic resonance profiling of HDL subclasses was performed by Liposcience (Raleigh, NC).
CEC Assays
Plasma samples were thawed at 4°C immediately before the cholesterol efflux assay to avoid lipoprotein remodeling. CEC of apolipoprotein B–depleted (HDL‐enriched) plasma was measured essentially as described by de la Llera‐Moya et al.10 Immediately after thawing and gentle mixing of plasma, apolipoprotein B–containing lipoproteins were precipitated by the addition of 0.4 volume of PEG 6000 20% in 200 mmol/L glycine at pH 7.4, thorough mixing by 5‐s vortexing, and incubation on ice for 20 minutes.15 Apolipoprotein B–containing lipoproteins were pelleted by centrifugation at 10,000g for 30 minutes at 4°C. An aliquot of supernatant (apolipoprotein B–depleted plasma) was obtained and transferred in a cooled microtube. A nonsaturating dose of apolipoprotein B–depleted plasma (2.8% vol/vol, corresponding to 2% plasma) was used in cholesterol efflux assays on the basis of maximal cholesterol efflux and cholesterol efflux constant. CEC of HDL particles was measured in vitro with J774 macrophages in basal (non–cAMP‐stimulated) and stimulated (with cAMP) conditions. J774 cell cholesterol was labeled in presence of 2 μCi/mL [1,2]‐3H‐cholesterol (Perkin Elmer), 1% fetal bovine serum, and 2 μg/mL S‐58035 (acetyl‐Coenzyme A acetyltransferase [ACAT] inhibitor) for 24 hours. After equilibration of 3H‐cholesterol during 18 hours in presence of 0.2% BSA and 2 μg/mL ACAT inhibitor plus or minus 0.3 mmol/L 8‐bromo‐cAMP, cholesterol efflux was initiated by adding individual apolipoprotein B–depleted plasma diluted in DMEM in triplicate wells for 4 hours at 37°C. 3H‐cholesterol counts were measured by beta counting (Tricarb; Perkin‐Elmer) in aliquots of cell‐free culture medium and J774 cell homogenates (solubilized in 0.2 N NaOH) mixed with scintillation cocktail (Ecolite; MP Biomedicals). CEC was also measured with ABCA1‐expressing BHK‐ABCA1 cells (generated by John F. Oram,11 a kind gift from Dr Chongren Tang, University of Washington) essentially as for J774 cells, with the following differences: ABCA1 expression was induced during the equilibration period with 20 nmol/L mifepristone, and apolipoprotein B–depleted plasma was diluted at 1.4% (vol/vol) to reflect the lower cholesterol efflux constant with BHK‐ABCA1 cells. We also considered measuring CEC with BHK‐ABCG1 cells. However, these cells showed a wide range of ABCG1 overexpression levels, and this cellular system was not further pursued experimentally. Percentage CEC was calculated as follows: (3H‐cholesterol counts in incubation medium/3H‐cholesterol counts in medium plus in J774 cell homogenate)×100%. Recovery of 3H‐cholesterol counts after 4‐hour efflux was >90% of 3H‐cholesterol counts before incubation of cells. Background cholesterol efflux (obtained in the absence of apolipoprotein B–depleted plasma) was subtracted from individual cholesterol efflux values. To correct for interassay variability, CEC was measured with the same pool of 40 healthy volunteers’ serum in each assay, and individual percentage CEC values were divided (normalized) by percentage CEC of control serum in each assay, as described previously.3, 5 Control serum CEC values were required to be within the limits defined by the historical mean of CEC for each model, plus or minus 2 SDs, to allow batch qualification. Technical variability (intra‐assay and interassay coefficient of variation based on control serum values in each batch) is presented in Table S2. The global coefficient of variation of all CEC models was reduced by >3% after normalization with control serum values.
Genetic Data
The genetic data were generated in 2 phases, which were planned at the beginning of the project. Initially, we performed low‐pass whole‐genome DNA sequencing on 1896 participants. This whole‐genome DNA sequencing MHI Biobank phase 1 data set, including quality control steps, has been extensively described elsewhere.16 The mean coverage per individual was ≈5.6×, and we identified a total of 29 million biallelic variants. We generated the MHI Biobank phase 2 data set by genotyping 3397 participants on the Illumina MEGA array. We applied quality control steps using PLINK 1.917 or VCFtools. We excluded variants and samples with high missing rate (>5%), as well as variants in violation of the Hardy‐Weinberg equilibrium (P<1×10⁻⁶). We also excluded samples that appear as population outliers in principal component analyses or individuals with abnormal inbreeding values. Finally, we used identity‐by‐descent analyses within and between the 2 genetic data sets to identify technical duplicates and pairs of related individuals. We found no pairs of closely related individuals (third degree or less) in the data sets because we had previously used another genotyping array (Illumina ExomeChip) to label related individuals in the MHI Biobank. We imputed autosomal variants on this quality‐controlled genome‐wide genotyping data set using haplotype from the Haplotype Reference Consortium18 and the Michigan Imputation Server (https://imputationserver.sph.umich.edu).
Statistical Analyses
For genetic association testing, we only considered biallelic autosomal variants with a minor allele frequency ≥1% and an imputation quality score (rsq_hat) >0.3. We applied inverse normal transformation to the CEC phenotypes. We tested the association between normalized phenotypes and genotypes (additive coding) using a linear regression framework as implemented in Efficient and Parallelizable Association Container Toolbox (EPACTS) (https://genome.sph.umich.edu/wiki/EPACTS). We analyzed each genetic data set (MHI Biobank phase 1 and 2) separately, and subsequently combined results using an inverse variance meta‐analysis method.19 We tested 2 statistical models to find association between CEC and genotypes: In model 1, we corrected for sex, age squared, coronary artery disease (CAD) status, technical batches, statin treatment, and the first 10 principal components. In model 2, we corrected for the same covariates as in model 1, but also for HDL‐C and triglyceride levels. Because the inflation factors (λGC) were all near unity, we did not adjust results with the kinship matrix nor did we apply genomic control correction. We used Bonferroni correction to define the significance threshold of our experiment: assuming ≈1 million independent variants, 4 CEC phenotypes, and 2 statistical models, we set α=6.25×10⁻⁹.
To assess possible residual confounding in the association between the APOE/C1/C2/C4 variant and CEC when controlling for HDL‐C and triglycerides that would be attributable to nonlinear relationships between HDL‐C and CEC and between triglycerides and CEC, we used nonparametric smoothing techniques that support a linear relationship for both parameters. To assess remaining nonlinearity, we tested models with restricted cubic spline transformation for HDL‐C and triglycerides. Results show that the spline transformation did not affect the significance of the APOE/C1/C2/C4 association. To assess whether there may be residual confounding attributable to effect modifiers, we tested models including interaction terms between HDL‐C and other covariates, and between triglycerides and other covariates. Again, results show that the addition of the interaction terms did not affect the significance of the APOE/C1/C2/C4 association (Data S1).
Analyses of Candidate Variants and Genes
On the basis of a review of the literature, we selected the following genes as candidate regulators of CEC: ABCA1, ABCG1, ANGPTL3, CYP27A1, CETP, GALNT2, LCAT, LIPC, LIPG, LPL, NR1H2, NR1H3, and SCARB1. We also retrieved genes encoding for proteins found in HDL particles by proteomic analyses20; the list of these genes is presented in Table S3. For these 58 genes (literature review and/or proteomic analyses), we annotated and prioritized for secondary analyses missense, nonsense, and canonical splice site variants. We also retrieved all significant expression quantitative trait loci (eQTL) for these 58 genes from the GTEx database. In total, this corresponds to 3933 variants, including 2213 variants that map to the major histocompatibility complex region and are correlated eQTLs for the genes C4A, C4B, and/or APOM. We used the SNPclip tool in the LDlink program21 to identify independent variants (defined using linkage disequilibrium [LD] r 2<0.5 in individuals of North European ancestry): this analysis yielded 251 independent variants. Because not all variants could be retrieved by LDlink, we selected α=1×10⁻⁴ to declare significance in this secondary analysis (an effective Bonferroni correction for 500 tests). We also looked up CEC association results for variants associated with blood lipid levels (n=160 single‐nucleotide polymorphisms [SNPs]) or CAD risk (n=86 SNPs) by GWAS,22, 23, 24, 25, 26 using a statistical threshold of α=2.1×10⁻⁴ (Bonferroni correction for 239 different variants). For these secondary analyses of candidate variants, we did not correct for the number of CEC phenotypes and statistical models to assess statistical significance.
Results
Correlation Analyses With CEC
To characterize interindividual variation in CEC between individuals, we measured HDL‐mediated cholesterol efflux using 2 different cellular models to generate 4 different CEC phenotypes in 996 CAD‐free participants and 1000 patients with myocardial infarction from the MHI Biobank (MHI Biobank phase 1 in Table S1). To complement this analysis, we also measured in the same participants additional blood lipid phenotypes and HDL‐associated proteins using standard biochemistry assays and nuclear magnetic resonance techniques (Methods). Results were largely concordant between healthy individuals and patients with myocardial infarction (Figure 1). As expected, we observed an inverse correlation between HDL‐C and triglyceride levels in both controls and myocardial infarction cases (Spearman's ρ=−0.52, P<2.2×10⁻¹⁶). HDL‐C levels were also strongly correlated with the number or size of HDL particles and apolipoprotein A‐I concentration in cases and controls (Spearman's ρall>0.6, P all<2.2×10⁻¹⁶). As previously noted,4, 7 HDL‐C levels were positively correlated with CEC using the J774 or BHK models, although the strength of the correlations varied from one phenotype to the other: the correlations were strong with the J774‐basal model (Spearman's ρcontrol=0.63, ρcase=0.66, P both<2.2×10⁻¹⁶), modest with the J774‐stimulated model (Spearman's ρcontrol=0.38, ρcase=0.37, P both<2.2×10⁻¹⁶) and the BHK‐stimulated model (Spearman's ρcontrol=0.43, ρcase=0.34, P both<2.2×10⁻¹⁶), and weak or absent with the J774‐ABCA1–dependent model (Spearman's ρcontrol=−0.06, ρcase=−0.07, P control=0.07, P case=0.03). Using unsupervised hierarchical clustering, we noted that the BHK‐stimulated assay clustered with the J774‐basal model in controls, but with the J774‐stimulated and J774‐ABCA1–dependent measures in cases (Figure 1). Finally, we confirmed that CECs were associated with reduced prevalent CAD events, thus replicating previous observations3 and validating our data set (Table 1).
Figure 1.
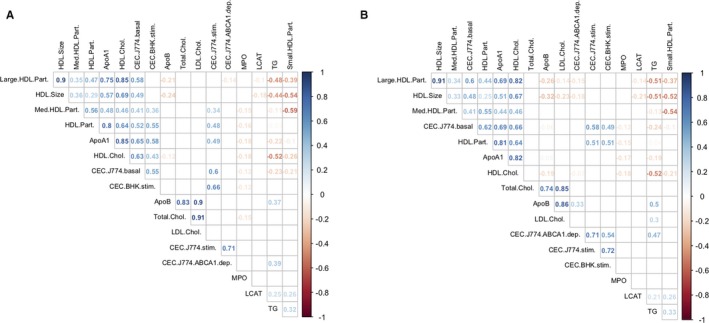
Matrix of pairwise Spearman's correlation coefficients calculated for high‐density lipoprotein (HDL) and other blood lipid–related phenotypes measured in (A) 996 coronary artery disease–free participants and (B) 1000 patients with myocardial infarction (MI) from the Montreal Heart Institute Biobank. For each pairwise comparison, we added to the plot the corresponding Spearman's correlation coefficient (ρ) if the correlation test P<0.05. We applied unsupervised hierarchical clustering using Wald's method to graphically represent the results. Apo indicates apolipoprotein; BHK, baby hamster kidney; CEC, cholesterol efflux capacity; Chol., cholesterol; dep., dependent; LCAT, lecithin/cholesterol acyltransferase; LDL, low‐density lipoprotein; Med., medium; MPO, myeloperoxidase; Part., particle; stim., stimulated; TG, triglycerides.
Table 1.
Association Between CEC and Prevalent CAD Case‐Control Status in the MHI Biobank Phase 1 (943 Controls and 954 CAD Cases)
| CEC | Baseline Model | Adjusted for HDL‐C and Triglycerides | ||||
|---|---|---|---|---|---|---|
| OR | 95% CI | P Value | OR | 95% CI | P Value | |
| J774 basal | 0.62 | 0.56–0.69 | <2.2×10⁻¹⁶ | 0.63 | 0.54–0.72 | 4.1×10⁻¹¹ |
| J774 stimulated | 0.65 | 0.58–0.72 | <2.2×10⁻¹⁶ | 0.73 | 0.65–0.83 | 1.4×10⁻⁶ |
| J774 ABCA1 dependent | 0.85 | 0.77–0.94 | 0.0012 | 0.94 | 0.84–1.05 | 0.29 |
| BHK stimulated | 0.90 | 0.81–1.00 | 0.039 | 1.23 | 1.08–1.40 | 0.0015 |
The ORs and 95% CIs are provided per SD of CEC. All models are adjusted for sex, age squared, and statin use. When indicated, we also adjusted for HDL‐C and triglyceride levels. BHK indicates baby hamster kidney; CAD, coronary artery disease; CEC, cholesterol efflux capacity; CI, confidence interval; HDL‐C, high‐density lipoprotein cholesterol; MHI, Montreal Heart Institute; OR, odds ratio.
GWAS for CEC
To identify genetic variants associated with CEC, we performed GWAS in 1896 participants from the MHI Biobank phase 1 data set described above who also had their whole genome sequenced.16 To increase our discovery power, we also measured CEC and other lipid phenotypes in an additional 863 CAD‐free participants and 2534 patients with CAD (MHI Biobank phase 2 in Table S1). We tested association between genotypes and each of the 4 CEC phenotypes using 2 different statistical models (Methods). In the second model, we adjusted for HDL‐C and triglyceride levels because of their correlations with the CEC measures (Figure 1). Because adjustment with heritable covariates (such as HDL‐C and triglyceride levels) can lead to false‐positive associations in the GWAS context (ie, collider bias),27 we always compare association results without and with HDL‐C and triglyceride adjustment for all SNPs highlighted in this study. We also report CEC results for the most significant variants stratified on CAD case‐control status (Table S4), as well as their association results with HDL‐C and triglyceride levels (Tables S5 and S6).
Association results without and with adjustment for HDL‐C and triglyceride levels are summarized in Figures 2 and 3, respectively. In all 8 meta‐analyses, we did not detect inflation of the test statistics, suggesting minimal, if any, confounding because of experimental or population stratification artifacts. Overall, we identified 10 association signals at 7 different loci that reached genome‐wide significance (Table 2). Of these 7 loci, 5 include genes with well‐known function in lipid and/or HDL biological features: LPL, LIPC, CETP, APOA1/C3/A4/A5, and APOE/C1/C2/C4. Not surprisingly, genetic associations at 4 of these 5 loci (LPL, LIPC, CETP, and APOA1/C3/A4/A5) are significant in model 1, but weaker under model 2 when we adjust for HDL‐C and triglyceride levels (Table 2). For the APOE/C1/C2/C4 variants, however, although the CEC association signals weaken with the adjustment in model 2, they remain nearly significant. For instance, the associations between rs141622900 and CEC measures from the BHK‐stimulated assay are P=1.03×10⁻¹¹ and P=8.81×10⁻⁹ in models 1 and 2, respectively (Table 2). Similarly, for the J774‐stimulated and J774‐ABCA1–dependent assays, the associations with the APOE/C1/C2/C4 variants remain strong in model 2 (P=1.03×10⁻⁶ and P=2.89×10⁻⁷, respectively).
Figure 2.
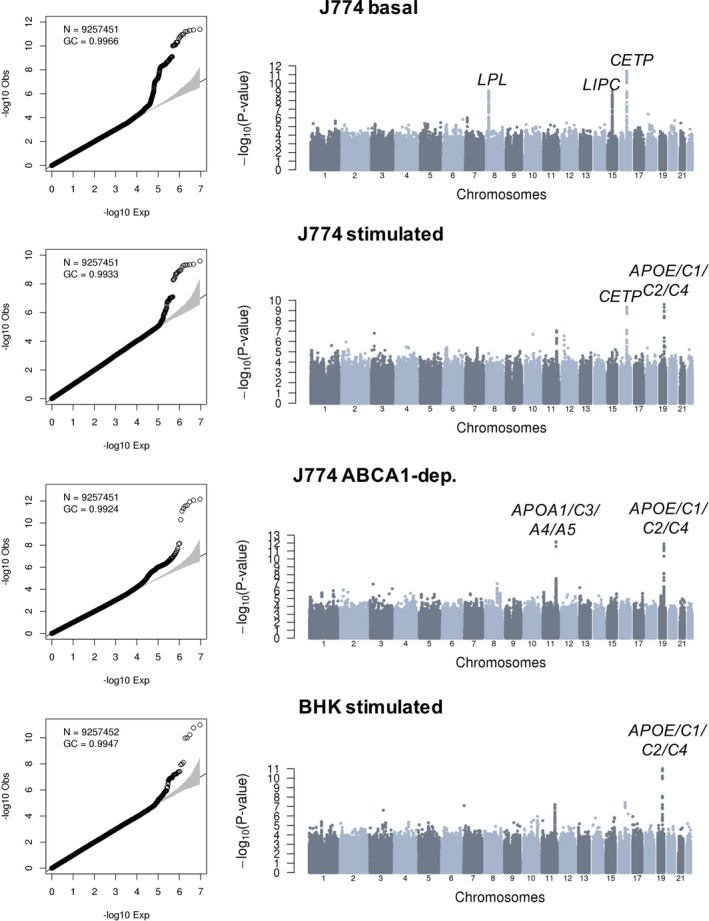
Genome‐wide association results for 4 different cholesterol efflux capacity measures in 5293 participants from the Montreal Heart Institute Biobank. Quantile‐quantile and Manhattan plots are in the left and right columns of the figure, respectively. Association tests are corrected for sex, age squared, coronary artery disease status, experimental batches, statin treatment, and the first 10 principal components. For each association signal that reaches genome‐wide significance (P<6.25×10⁻⁹), we highlighted the closest relevant gene(s).BHK indicates baby hamster kidney; dep., dependent; GC, genomic control inflation factor; N, number of variants with minor allele frequency ≥1% tested.
Figure 3.
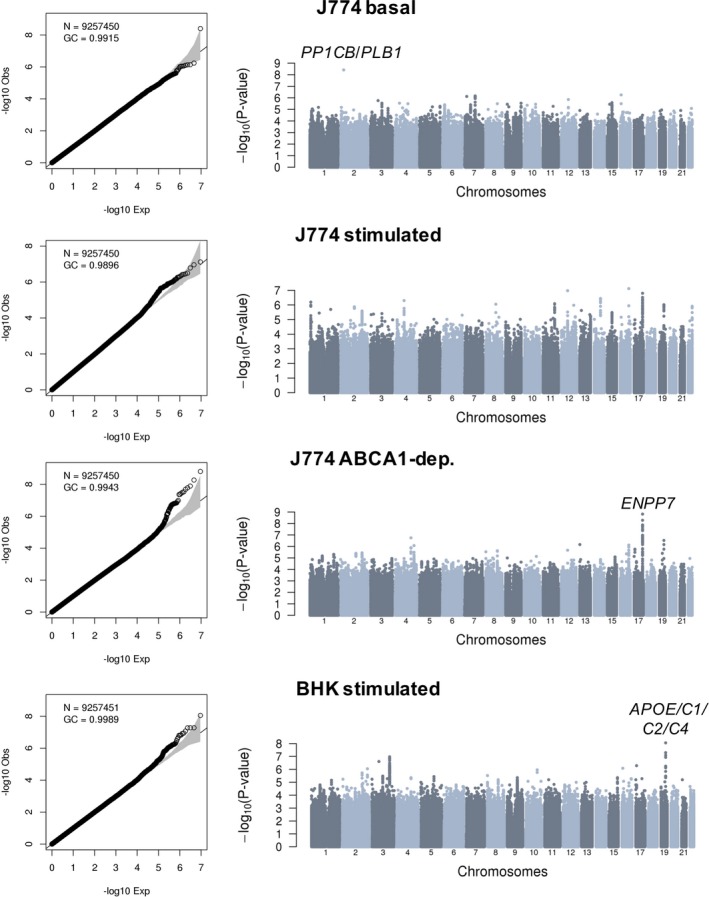
Genome‐wide association results for 4 different cholesterol efflux capacity measures in 5293 participants from the Montreal Heart Institute Biobank. Quantile‐quantile and Manhattan plots are in the left and right columns of the figure, respectively. Association tests are corrected for sex, age squared, coronary artery disease status, experimental batches, statin treatment, high‐density lipoprotein cholesterol and triglyceride levels, and the first 10 principal components. For each association signal that reaches genome‐wide significance (P<6.25×10⁻⁹), we highlighted the closest relevant gene(s). BHK indicates baby hamster kidney; dep., dependent; GC, genomic control inflation factor; N, number of variants with minor allele frequency ≥1% tested.
Table 2.
Genome‐Wide Significant Associations With CEC Phenotypes in 5293 Individuals
| SNP | Chromosome (Position) | CEC | Allele A1/A2 | EAF | Model 1 | Model 2 (Adjusted for HDL‐C and Triglycerides) | Locus | ||||
|---|---|---|---|---|---|---|---|---|---|---|---|
| β | SE | P Value | β | SE | P Value | ||||||
| rs75657792 | 2 (28 965 430) | J774 basal | C/G | 0.977 | −0.3361 | 0.0752 | 7.78×10⁻⁶ | −0.4467 | 0.0759 | 3.95×10⁻⁹* | PPP1CB/PLB1 |
| rs77069344 | 8 (19 821 782) | T/G | 0.099 | 0.2008 | 0.0327 | 7.96×10⁻¹⁰* | 0.0671 | 0.033 | 0.04178 | LPL | |
| rs2070895 | 15 (58 723 939) | A/G | 0.770 | −0.1424 | 0.0232 | 8.49×10⁻¹⁰* | −0.059 | 0.0234 | 0.01178 | LIPC | |
| rs247616 | 16 (56 989 590) | T/C | 0.686 | −0.1466 | 0.0211 | 4.08×10⁻¹²* | 0.0275 | 0.0211 | 0.193 | CETP | |
| rs247616 | 16 (56 989 590) | J774 stimulated | T/C | 0.686 | −0.1308 | 0.0209 | 4.23×10⁻¹⁰* | 0.0194 | 0.0211 | 0.3586 | CETP |
| rs445925 | 19 (45 415 640) | A/G | 0.886 | −0.1933 | 0.0306 | 2.57×10⁻¹⁰* | −0.1513 | 0.031 | 1.03×10⁻⁶ | APOE/C1/C2/C4 | |
| rs964184 | 11 (116 648 917) | J774 ABCA1 dependent | C/G | 0.857 | 0.2019 | 0.0281 | 6.78×10⁻¹³* | 0.0756 | 0.0287 | 0.008398 | APOA1/C3/A4/A5 |
| rs4889908 | 17 (77 657 521) | T/C | 0.715 | 0.1047 | 0.0221 | 2.22×10⁻⁶ | 0.1341 | 0.0222 | 1.57×10⁻⁹* | RBFOX3/ENPP7 | |
| rs445925 | 19 (45 415 640) | A/G | 0.886 | −0.2155 | 0.0303 | 1.20×10⁻¹²* | −0.1586 | 0.0309 | 2.89×10⁻⁷ | APOE/C1/C2/C4 | |
| rs141622900 | 19 (45 426 792) | BHK stimulated | A/G | 0.942 | −0.2833 | 0.0417 | 1.03×10⁻¹¹* | −0.2406 | 0.0418 | 8.81×10⁻⁹ | APOE/C1/C2/C4 |
The statistical threshold considers the number of variants (≈1 million independent), the number of CEC measures (n=4), and the number of statistical models (n=2) tested (α=6.25×10⁻⁹). * indicates significant P values. Coordinates are for build hg19 of the human genome. Alleles are on the positive strand. The EAF and the direction of the effect size (β) are for allele A2. Model 1 is adjusted for sex, age squared, coronary artery disease status, experimental batches, statin treatment, and the first 10 principal components. Model 2 includes the same covariates as model 1, but also HDL‐C and triglyceride levels. BHK indicates baby hamster kidney; CEC, cholesterol efflux capacity; EAF, effect allele frequency; HDL‐C, high‐density lipoprotein cholesterol; SNP, single‐nucleotide polymorphism.
Our CEC GWAS identified 2 loci not previously implicated in lipid or HDL biological features: an intergenic variant on chromosome 2 associated with J774‐basal CEC and variants in strong LD on chromosome 17 with J774‐ABCA1–dependent CEC (Table 2). In both cases, the association signals are stronger in model 2, although there is evidence of association in model 1 as well. These improved association statistics could be attributable to collider biases: although the effect alleles at both loci modulate CEC and HDL‐C in the same direction (Table 1 and Table S4), the effect on triglyceride levels is in the opposite direction (Table S6). The index SNP on chromosome 2 (rs75657792) has a low minor allele frequency (2.3%), has suboptimal imputation quality in the MHI Biobank phase 2 data set (imputation rsq_hat=0.63), and is the only variant at the locus that reaches genome‐wide significance (Figure 3). Therefore, this could represent a false‐positive association. Bioinformatic annotation of the variant yielded little insights: rs75657792 has no strong LD proxies (r 2>0.8), is not an eQTL in GTEx, and does not map to a regulatory sequence defined using histone tail epigenomic marks.28, 29 However, the chromosomal region surrounding rs75657792 does interact physically with PLB1, a gene that encodes a membrane‐associated phospholipase and that is located 98 kb downstream, as assessed using Hi‐C technology in the human liver (Figure S1).30 The other signal on chromosome 17 is statistically more convincing: the index variant (rs4889908) is common (minor allele frequency=28.5%), its imputation quality is high (rsq_hat=0.96), and many SNPs in high LD are genome‐wide significant at the same locus (Figure 3). rs4889908 and its strong LD proxies are not eQTLs in GTEx and do not establish physical interactions with nonadjacent chromosomal regions.29, 30 However, rs35636768, which is in strong LD with the index rs4889908 variant (r 2=0.98 in French Canadians) maps to a DNAse I hypersensitive region in human CD14+ monocytes.28 Although interesting, these in silico annotations remain speculative. Ultimately, the confirmation of these 2 signals as CEC loci will require independent replication in additional samples.
Candidate CEC Genes and Variants
To improve statistical power to identify CEC loci, we prioritized 13 genes from literature searches and another 45 genes from proteomic analyses of HDL particles (Methods).20 For these 58 genes, we retrieved from our meta‐analyses, association results for coding variants (missense, nonsense, and essential splice site) as well as variants annotated as eQTLs in the GTEx database.29 In total, we found 11 significant association signals from 6 different loci: missense variants for LIPG, APOA4, and APOE, a nonsense variant for LPL, and eQTLs for LIPC and PLTP (Table 3). All but one of these association signals were stronger in model 1; the exception was the eQTL variant rs6073966 for PLTP, which became significant only when adjusting for HDL‐C and triglyceride levels (model 2 in Table 3). This could arise because of a collider bias (Table 3, Tables S5 and S6). The association signals at LPL, LIPG, and APOA4 were only significant in model 1. In contrast to what we observed for the variant associated most strongly with CEC at the LIPC locus (rs2070895 in Table 2), the LIPC eQTL variant (rs35128881) remained significant when adjusting for HDL‐C and triglyceride levels (Table 3). The missense variant (rs7412) in APOE was significant in models 1 and 2.
Table 3.
Candidate Variants in Genes Previously Implicated in CEC or Encoding Proteins Found in HDL Particles by Proteomic Analyses
| SNP | Chromosome (Position) | CEC | Allele A1/A2 | EAF | Model 1 | Model 2 (Adjusted for HDL‐C and Triglycerides) | Annotation | ||||
|---|---|---|---|---|---|---|---|---|---|---|---|
| β | SE | P Value | β | SE | P Value | ||||||
| rs328 | 8 (19 819 724) | J774 basal | C/G | 0.095 | 0.1986 | 0.0332 | 2.184×10⁻⁹* | 0.0755 | 0.0335 | 0.02412 |
Nonsense LPL |
| rs35128881 | 15 (58 692 148) | T/G | 0.791 | −0.1153 | 0.0247 | 3.08×10⁻⁶* | −0.1143 | 0.0248 | 4.123×10⁻⁶* |
GTEx_eQTL LIPC |
|
| rs77960347 | 18 (47 109 955) | A/G | 0.014 | 0.3349 | 0.0846 | 7.492×10⁻⁵* | 0.2871 | 0.0851 | 0.0007405 |
Missense LIPG |
|
| rs5104 | 11 (116 692 334) | J774 stimulated | T/C | 0.862 | 0.1254 | 0.0286 | 1.158×10⁻⁵* | 0.0601 | 0.0294 | 0.04088 |
Missense APOA4 |
| rs7412 | 19 (45 412 079) | T/C | 0.917 | −0.214 | 0.0353 | 1.285×10⁻⁹* | −0.1616 | 0.0357 | 6.084×10⁻⁶* |
Missense APOE |
|
| rs5104 | 11 (116 692 334) | J774 ABCA1 dependent | T/C | 0.862 | 0.1375 | 0.0282 | 1.087×10⁻⁶* | 0.06 | 0.0286 | 0.03593 |
Missense APOA4 |
| rs7412 | 19 (45 412 079) | T/C | 0.917 | −0.2301 | 0.035 | 4.882×10⁻¹¹* | −0.1571 | 0.0357 | 1.066×10⁻⁵* |
Missense APOE |
|
| rs5104 | 11 (116 692 334) | BHK stimulated | T/C | 0.862 | 0.1509 | 0.0285 | 1.216×10⁻⁷* | 0.0882 | 0.0291 | 0.002438 |
Missense APOA4 |
| rs77960347 | 18 (47 109 955) | A/G | 0.014 | 0.3246 | 0.0834 | 9.903×10⁻⁵* | 0.238 | 0.0842 | 0.004713 |
Missense LIPG |
|
| rs7412 | 19 (45 412 079) | T/C | 0.917 | −0.236 | 0.0351 | 1.745×10⁻¹¹* | −0.1872 | 0.0353 | 1.178×10⁻⁷* |
Missense APOE |
|
| rs6073966 | 20 (44 570 192) | T/C | 0.803 | 0.0733 | 0.0247 | 0.002982 | 0.1019 | 0.0248 | 3.932×10⁻⁵* |
GTEx_eQTL PLTP |
|
For these analyses, the sample size is N=5293 and the statistical threshold is α=1×10⁻⁴ (Methods). * indicates significant P values. Coordinates are for build hg19 of the human genome. Alleles are on the positive strand. The EAF and the direction of the effect size (β) are for allele A2. Model 1 is adjusted for sex, age squared, coronary artery disease status, experimental batches, statin treatment, and the first 10 principal components. Model 2 includes the same covariates as model 1, but also HDL‐C and triglyceride levels. BHK indicates baby hamster kidney; CEC, cholesterol efflux capacity; EAF, effect allele frequency; eQTL, expression quantitative trait loci; HDL, high‐density lipoprotein; HDL‐C, HDL cholesterol; SNP, single‐nucleotide polymorphism.
Finally, we retrieved all variants previously associated by GWAS with blood lipid levels or CAD and looked up their results in our CEC meta‐analyses. For the 4 CEC measures, we found 16 significant association signals divided among 9 loci (Table 4). Many of these loci are already described in the previous sections: LPL, LIPC, CETP, APOA1/C3/A4/A5, APOE/C1/C2/C4, and PLTP. This secondary analysis allowed us to highlight 3 additional loci: GCKR‐rs1260326 associated with J774‐stimulated and J774‐ABCA1–dependent CEC, PPARA‐rs4253772 associated with J774‐stimulated CEC, and TRIB1‐rs2954029 associated with J774‐ABCA1–dependent CEC (Table 4). Except for APOE/C1/C2/C4 and PLTP, association signals at all other loci were only significant in model 1 (Table 4). Focusing on SNPs associated with HDL‐C levels by GWAS, Koekemoer et al previously reported 10 variants nominally associated with CEC in the GRAPHIC cohort.7 In our data set, we confirmed the association between J774‐stimulated CEC measures and variants at the LIPC and CETP loci in model 1, consistent with our genome‐wide significant results (Table S7). However, none of the 10 SNPs was associated with CEC in model 2 (Table S7). The PLTP locus, which is significantly associated with CEC in our data set (Tables 3 and 4), was not associated with this phenotype in the GRAPHIC cohort, nor with HDL‐C levels.7
Table 4.
CEC Association Results (N=5293) for Variants Previously Associated With Blood Lipid Levels or CAD Risk
| SNP | Chromosome (Position) | CEC | Allele A1/A2 | EAF | Model 1 | Model 2 (Adjusted for HDL‐C and Triglycerides) | Locus (Lipid Traits and CAD) | ||||
|---|---|---|---|---|---|---|---|---|---|---|---|
| β | SE | P Value | β | SE | P Value | ||||||
| rs12678919 | 8 (19 844 222) | J774 basal | A/G | 0.092 | 0.1975 | 0.0337 | 4.447×10⁻⁹* | 0.073 | 0.034 | 0.03163 | LPL (HDL‐C, triglycerides, CAD) |
| rs1532085 | 15 (58 683 366) | A/G | 0.386 | −0.1176 | 0.0203 | 7.026×10⁻⁹* | −0.0494 | 0.0204 | 0.01562 | LIPC (TC, HDL‐C, triglycerides) | |
| rs3764261 | 16 (56 993 324) | A/C | 0.685 | −0.145 | 0.0211 | 6.565×10⁻¹²* | 0.0283 | 0.0211 | 0.1798 | CETP (TC, HDL‐C, LDL‐C, triglycerides) | |
| rs1260326 | 2 (27 730 940) | J774 stimulated | T/C | 0.387 | −0.0838 | 0.0217 | 0.0001079* | −0.0512 | 0.022 | 0.02011 | GCKR (TC, triglycerides) |
| rs964184 | 11 (116 648 917) | C/G | 0.857 | 0.1143 | 0.0286 | 6.336×10⁻⁵* | 0.0593 | 0.0295 | 0.04428 | APOA1/C3/A4/A5 (TC, HDL‐C, LDL‐C, triglycerides, CAD) | |
| rs3764261 | 16 (56 993 324) | A/C | 0.685 | −0.1301 | 0.0209 | 4.932×10⁻¹⁰* | 0.0201 | 0.0211 | 0.3389 | CETP (TC, HDL‐C, LDL‐C, triglycerides) | |
| rs7412 | 19 (45 412 079) | T/C | 0.917 | −0.214 | 0.0353 | 1.285×10⁻⁹* | −0.1616 | 0.0357 | 6.084×10⁻⁶* | APOE/C1/C2/C4 (TC, HDL‐C, LDL‐C, CAD) | |
| rs4253772 | 22 (46 627 603) | T/C | 0.886 | −0.1214 | 0.0307 | 7.491×10⁻⁵* | −0.0927 | 0.031 | 0.002815 | PPARA (TC, LDL‐C) | |
| rs1260326 | 2 (27 730 940) | J774 ABCA1 dependent | T/C | 0.387 | −0.0989 | 0.0218 | 5621×10−6* | −0.0495 | 0.022 | 0.0244 | GCKR (TC, triglycerides) |
| rs2954029 | 8 (126 490 972) | A/T | 0.453 | −0.0803 | 0.0193 | 3.288×10⁻⁵* | −0.0604 | 0.0196 | 0.002046 | TRIB1 (TC, HDL‐C, LDL‐C, triglycerides, CAD) | |
| rs964184 | 11 (116 648 917) | C/G | 0.857 | 0.2019 | 0.0281 | 6.781×10⁻¹³* | 0.0756 | 0.0287 | 0.008398 | APOA1/C3/A4/A5 (TC, HDL‐C, LDL‐C, triglycerides, CAD) | |
| rs7412 | 19 (45 412 079) | T/C | 0.917 | −0.2301 | 0.035 | 4.882×10⁻¹¹* | −0.1571 | 0.0357 | 1.066×10⁻⁵* | APOE/C1/C2/C4 (TC, HDL‐C, LDL‐C, CAD) | |
| rs964184 | 11 (116 648 917) | BHK stimulated | C/G | 0.857 | 0.1169 | 0.0284 | 3.793×10⁻⁵* | 0.0435 | 0.0291 | 0.1344 | APOA1/C3/A4/A5 (TC, HDL‐C, LDL‐C, triglycerides, CAD) |
| rs3764261 | 16 (56 993 324) | A/C | 0.685 | −0.1149 | 0.0211 | 5.381×10⁻⁸* | 0.0254 | 0.0212 | 0.2302 | CETP (TC, HDL‐C, LDL‐C, triglycerides) | |
| rs7412 | 19 (45 412 079) | T/C | 0.917 | −0.236 | 0.0351 | 1.745×10⁻¹¹* | −0.1872 | 0.0353 | 1.178×10⁻⁷* | APOE/C1/C2/C4 (TC, HDL‐C, LDL‐C, CAD) | |
| rs6065906 | 20 (44 554 015) | T/C | 0.215 | −0.0654 | 0.0238 | 0.005993 | −0.0886 | 0.0239 | 0.0002143* | PLTP (HDL‐C, triglycerides) | |
For these analyses, the statistical threshold is α=2.1×10⁻⁴ (Methods). * indicates significant P values. Coordinates are for build hg19 of the human genome. Alleles are on the positive strand. The EAF and the direction of the effect size (β) are for allele A2. Model 1 is adjusted for sex, age squared, CAD status, experimental batches, statin treatment, and the first 10 principal components. Model 2 includes the same covariates as model 1, but also HDL‐C and triglyceride levels. BHK indicates baby hamster kidney; CAD, coronary artery disease; CEC, cholesterol efflux capacity; EAF, effect allele frequency; HDL‐C, high‐density lipoprotein cholesterol; LDL‐C, low‐density lipoprotein cholesterol; SNP, single‐nucleotide polymorphism; TC, total cholesterol.
Discussion
In the largest human genetic study of CEC of HDL to date, we used different cell models and conditions in >5000 participants to identify its genetic determinants independently or not from HDL‐C levels. In the genome‐wide analysis, variants at the LPL, LIPC, CETP, APOA1/C3/A4/A5, and APOE/C1/C2/C4 loci were associated with different measures of CEC, but the associations were lost when adjusting for HDL‐C, except for APOE/C1/C2/C4. An intergenic variant on chromosome 2, located in a region that interacts physically with PLB1 located 98 kb downstream, and variants in strong LD on chromosome 17 were also associated with CEC, and their associations strengthened after adjustment for HDL‐C, potentially suggesting collider biases. When turning to candidate genes previously implicated in CEC or encoding proteins found in HDL particles, candidate functional variants in LIPC, PLTP, and APOE passed the statistical threshold for association with CEC, despite adjustment for HDL‐C levels. Finally, when all variants previously associated with blood lipid levels or CAD risk by GWAS were evaluated, the APOE/C1/C2/C4 locus was again found to be significantly associated with CEC, whether or not association tests were adjusted for HDL‐C or triglyceride levels.
Genetic polymorphisms at the APOE/C1/C2/C4 cluster on chromosome 19 were associated with CEC by GWAS independently of the participants’ plasma HDL‐C levels (Table 2) or CAD status (Table S3). The models and conditions involved were BHK cells overexpressing human ABCA1 and J774 cells stimulated by cAMP (expressing mouse Abca1). Because of extensive LD at the locus, which of APOE, APOC1, APOC2, APOC4, or even TOMM40 causally influence CEC is difficult to determine, although APOE itself is a strong candidate. First, we identified an association between CEC and the APOE missense variant rs7412 (Table 3). Second, apolipoprotein E is a major apolipoprotein that is present in chylomicrons, very‐low‐density lipoproteins, and HDL; interacts with several cell surface receptors; and has multiple effects on lipid metabolism. Apolipoprotein E in serum‐free medium has been demonstrated to mediate ABCA1‐dependent cholesterol efflux and assembly of HDL particles, particularly through its C‐terminal lipid‐binding domain.31 Systemic overexpression of human APOE was also shown to increase ABCA1‐mediated CEC from mice hepatocytes.32 This is in contrast with a recent study with apolipoprotein E knockout mice apolipoprotein B–depleted serum samples, which exhibit a marked reduction of CEC from cAMP‐stimulated J774 macrophages.33 Indeed, isolated HDLs from apolipoprotein E knockout mice exhibit increased CEC from cAMP‐stimulated J774 and ABCA1‐overexpressing BHK cells, but not with ABCG1‐overexpressing cells.34 This suggests that the observed decrease in serum HDL CEC from apolipoprotein E knockout mice is because of low levels of HDL particles and not loss of apolipoprotein E in HDL particles.33 In fact, the apolipoprotein E content of isolated mouse HDLs is negatively correlated with ABCA1‐dependent efflux from BHK cells.34 Interestingly, HDL‐associated apolipoprotein E independently predicted recurrent cardiovascular events in a large clinical trial.35
LIPC codes for hepatic lipase, which hydrolyzes triglycerides into diacylglycerols and free fatty acids, and in so doing converts intermediate‐density lipoproteins into low‐density lipoproteins. Hepatic lipase also converts lipid‐rich large HDL2 to smaller and denser HDL3 particles by hydrolyzing triglycerides and phospholipids. It also increases the formation of pre–β‐HDL, which is an important acceptor particle for ABCA1‐dependent cholesterol efflux. HDL particles from mice deficient in hepatic lipase increase macrophage cholesterol efflux, which is thought to be attributable to the enrichment in phospholipids of HDL.36 Similarly, HDL particles from patients with hepatic lipase deficiency, a rare autosomal recessive disorder resulting in elevated plasma levels of HDL‐C, increase SR‐BI– and ABCA1‐dependent cholesterol efflux.37 Thus, the impact of hepatic lipase on macrophage CEC is not entirely clear. The candidate approach aspect of our study suggests that LIPC is associated with basal cholesterol efflux from J774 cells, but not with stimulated or ABCA1‐dependent efflux. We also noted allelic heterogeneity at the LIPC locus. Indeed, the top LIPC variant (rs2070895, Table 2) is in weak LD with the LIPC eQTL (rs35128881, Table 3) and the LIPC GWAS sentinel variant (rs1532085, Table 4) in French Canadians (r 2<0.005). In contrast, the eQTL and GWAS LIPC variants are in modest LD (r 2=0.39). However, only the eQTL LIPC variant rs35128881 remains significantly associated with HDL efflux on adjustments for HDL‐C levels (Table 3), potentially suggesting a more specific regulatory role for this variant on CEC.
Our genetic study has 2 main limitations. First, and most important, we have not been able to identify replication cohorts for our findings. As discussed, many of our CEC top association signals are biologically plausible, yet in the absence of independent replication, they should be considered cautiously. CEC experiments, especially in the scale of our study, remain technically challenging, and few large cohorts (with genetic data available) have generated HDL efflux phenotypes. Furthermore, although previous studies have focused on the J774‐stimulated CEC assay, some of our most interesting discoveries are with other CEC measures, which are not readily available elsewhere. Second, although our GWAS represents the first and largest effort to identify genome‐wide significant loci associated with CEC, our sample size remains modest (N=5293 participants) and we, therefore, have limited power to find weak effect variants. This is an important consideration given that most SNPs discovered by GWAS across any phenotypes have small phenotypic consequences. Our limited power also prevents us from using sophisticated statistical methods, such as LD score regression, to estimate CEC heritability or genetic correlations with other complex human diseases and traits.38, 39 Given our limited power, future replication studies of our CEC associations should consider inflation of the estimated effect sizes because of the winner's curse. As an indication, we applied the FDR Inverse Quantile Transformation (FIQT) method40 to adjust the effect sizes for the CEC variants reported in Table 2 and estimate that a sample size of ≈3000 participant is required to replicate our results.
In conclusion, variation at the APOE locus is one of the strongest genetic determinants that modulate CEC independently of HDL‐C. Because apolipoproteins resulting from gene expression at the APOE locus are found in HDL particles, the content of one or more of these proteins in HDL particles may provide a readily quantifiable marker that can be useful to predict variations in CEC in patients and predict CAD risk, as well as explaining the outcomes of HDL‐based therapies that aim at increasing HDL functionality.
Sources of Funding
This work is funded by Génome Québec and Génome Canada, the Montreal Heart Institute Foundation, the Canada Research Chair Program, and the Canadian Institutes of Health Research (CIHR‐MOP136979).
Supporting information
Data S1. Supplemental Methods.
Table S1. Demographics and clinical information for the participants involved in the study
Table S2. Technical variability of cholesterol efflux capacity assays assessed with QC sample (pooled normal human serum, apoB‐depleted) in each assay batch (N=106)
Table S3. Proteins, and corresponding genes, found in HDL particles by proteomic analyses2
Table S4. Cholesterol efflux capacity association results stratified on coronary artery disease case‐control status
Table S5. Association results between variants associated with cholesterol efflux capacity and HDL‐cholesterol levels in 5168 French Canadians from the MHI Biobank
Table S6. Association results between variants associated with cholesterol efflux capacity and triglyceride (TG) levels in 5168 French Canadians from the MHI Biobank
Table S7. Association results between HDL‐C‐associated SNPs that were reported previously to be nominally associated with cholesterol efflux capacity (CEC) in 850 individuals from GRAPHIC3
Figure S1. Chromosome conformation (Hi‐C) data from human liver obtained from the HUGIn browser1 around SNP rs75657792, which is associated with J774‐basal CEC values. The top panel represents the gene at the locus (shades of red indicate expression levels in human liver). Histone tail marks obtained by ChIP‐seq are represented in the middle panel. The Hi‐C data is summarized in the bottom panel. The black rectangle corresponds to the anchor point and includes rs75657792. The black and red lines indicate the number of observed and expected Hi‐C contacts between the anchor point and the corresponding regions. The line in blue corresponds to the ‐log10(P‐value). We can observe two strong Hi‐C signals between the anchor point and the PLB1 gene (red oval).
Acknowledgments
We thank all participants and staff of the André and France Desmarais Montreal Heart Institute (MHI) Biobank. Sequencing of the MHI Biobank samples (phase 1) was performed at the McGill University and Génome Québec Innovation Centre. Genotyping of the MHI Biobank samples (phase 2) was performed at the Université de Montréal Beaulieu‐Saucier Pharmacogenomics Centre at the MHI.
Disclosures
Tardif has received research support from Amarin, AstraZeneca, DalCor, Esperion, Ionis, Merck, Pfizer, Sanofi, and Servier; and honoraria from DalCor, Pfizer, Sanofi, and Servier. Tardif and Dubé hold minor equity interest in DalCor and are mentioned as authors of a pending patent on pharmacogenomics‐guided CETP inhibition. The remaining authors have no disclosures to report.
(J Am Heart Assoc. 2018;7:e009545 DOI: 10.1161/JAHA.118.009545.)
Contributor Information
Guillaume Lettre, Email: guillaume.lettre@umontreal.ca.
Jean‐Claude Tardif, Email: jean-claude.tardif@icm-mhi.org.
References
- 1. Voight BF, Peloso GM, Orho‐Melander M, Frikke‐Schmidt R, Barbalic M, Jensen MK, Hindy G, Holm H, Ding EL, Johnson T, Schunkert H, Samani NJ, Clarke R, Hopewell JC, Thompson JF, Li M, Thorleifsson G, Newton‐Cheh C, Musunuru K, Pirruccello JP, Saleheen D, Chen L, Stewart A, Schillert A, Thorsteinsdottir U, Thorgeirsson G, Anand S, Engert JC, Morgan T, Spertus J, Stoll M, Berger K, Martinelli N, Girelli D, McKeown PP, Patterson CC, Epstein SE, Devaney J, Burnett MS, Mooser V, Ripatti S, Surakka I, Nieminen MS, Sinisalo J, Lokki ML, Perola M, Havulinna A, de Faire U, Gigante B, Ingelsson E, Zeller T, Wild P, de Bakker PI, Klungel OH, Maitland‐van der Zee AH, Peters BJ, de Boer A, Grobbee DE, Kamphuisen PW, Deneer VH, Elbers CC, Onland‐Moret NC, Hofker MH, Wijmenga C, Verschuren WM, Boer JM, van der Schouw YT, Rasheed A, Frossard P, Demissie S, Willer C, Do R, Ordovas JM, Abecasis GR, Boehnke M, Mohlke KL, Daly MJ, Guiducci C, Burtt NP, Surti A, Gonzalez E, Purcell S, Gabriel S, Marrugat J, Peden J, Erdmann J, Diemert P, Willenborg C, Konig IR, Fischer M, Hengstenberg C, Ziegler A, Buysschaert I, Lambrechts D, Van de Werf F, Fox KA, El Mokhtari NE, Rubin D, Schrezenmeir J, Schreiber S, Schafer A, Danesh J, Blankenberg S, Roberts R, McPherson R, Watkins H, Hall AS, Overvad K, Rimm E, Boerwinkle E, Tybjaerg‐Hansen A, Cupples LA, Reilly MP, Melander O, Mannucci PM, Ardissino D, Siscovick D, Elosua R, Stefansson K, O'Donnell CJ, Salomaa V, Rader DJ, Peltonen L, Schwartz SM, Altshuler D, Kathiresan S. Plasma HDL cholesterol and risk of myocardial infarction: a mendelian randomisation study. Lancet. 2012;380:572–580. [DOI] [PMC free article] [PubMed] [Google Scholar]
- 2. Phillips MC. Molecular mechanisms of cellular cholesterol efflux. J Biol Chem. 2014;289:24020–24029. [DOI] [PMC free article] [PubMed] [Google Scholar]
- 3. Khera AV, Cuchel M, de la Llera‐Moya M, Rodrigues A, Burke MF, Jafri K, French BC, Phillips JA, Mucksavage ML, Wilensky RL, Mohler ER, Rothblat GH, Rader DJ. Cholesterol efflux capacity, high‐density lipoprotein function, and atherosclerosis. N Engl J Med. 2011;364:127–135. [DOI] [PMC free article] [PubMed] [Google Scholar]
- 4. Rohatgi A, Khera A, Berry JD, Givens EG, Ayers CR, Wedin KE, Neeland IJ, Yuhanna IS, Rader DR, de Lemos JA, Shaul PW. HDL cholesterol efflux capacity and incident cardiovascular events. N Engl J Med. 2014;371:2383–2393. [DOI] [PMC free article] [PubMed] [Google Scholar]
- 5. Saleheen D, Scott R, Javad S, Zhao W, Rodrigues A, Picataggi A, Lukmanova D, Mucksavage ML, Luben R, Billheimer J, Kastelein JJ, Boekholdt SM, Khaw KT, Wareham N, Rader DJ. Association of HDL cholesterol efflux capacity with incident coronary heart disease events: a prospective case‐control study. Lancet Diabetes Endocrinol. 2015;3:507–513. [DOI] [PMC free article] [PubMed] [Google Scholar]
- 6. Li XM, Tang WH, Mosior MK, Huang Y, Wu Y, Matter W, Gao V, Schmitt D, Didonato JA, Fisher EA, Smith JD, Hazen SL. Paradoxical association of enhanced cholesterol efflux with increased incident cardiovascular risks. Arterioscler Thromb Vasc Biol. 2013;33:1696–1705. [DOI] [PMC free article] [PubMed] [Google Scholar]
- 7. Koekemoer AL, Codd V, Masca NGD, Nelson CP, Musameh MD, Kaess BM, Hengstenberg C, Rader DJ, Samani NJ. Large‐scale analysis of determinants, stability, and heritability of high‐density lipoprotein cholesterol efflux capacity. Arterioscler Thromb Vasc Biol. 2017;37:1956–1962. [DOI] [PMC free article] [PubMed] [Google Scholar]
- 8. Villard EF, EI Khoury P, Frisdal E, Bruckert E, Clement K, Bonnefont‐Rousselot D, Bittar R, Le Goff W, Guerin M. Genetic determination of plasma cholesterol efflux capacity is gender‐specific and independent of HDL‐cholesterol levels. Arterioscler Thromb Vasc Biol. 2013;33:822–828. [DOI] [PubMed] [Google Scholar]
- 9. Talbot CPJ, Plat J, Ritsch A, Mensink RP. Determinants of cholesterol efflux capacity in humans. Prog Lipid Res. 2017;69:21–32. [DOI] [PubMed] [Google Scholar]
- 10. de la Llera‐Moya M, Drazul‐Schrader D, Asztalos BF, Cuchel M, Rader DJ, Rothblat GH. The ability to promote efflux via abca1 determines the capacity of serum specimens with similar high‐density lipoprotein cholesterol to remove cholesterol from macrophages. Arterioscler Thromb Vasc Biol. 2010;30:796–801. [DOI] [PMC free article] [PubMed] [Google Scholar]
- 11. Vaughan AM, Oram JF. ABCA1 redistributes membrane cholesterol independent of apolipoprotein interactions. J Lipid Res. 2003;44:1373–1380. [DOI] [PubMed] [Google Scholar]
- 12. Du XM, Kim MJ, Hou L, Le Goff W, Chapman MJ, Van Eck M, Curtiss LK, Burnett JR, Cartland SP, Quinn CM, Kockx M, Kontush A, Rye KA, Kritharides L, Jessup W. HDL particle size is a critical determinant of ABCA1‐mediated macrophage cellular cholesterol export. Circ Res. 2015;116:1133–1142. [DOI] [PubMed] [Google Scholar]
- 13. Beaudoin M, Gupta RM, Won HH, Lo KS, Do R, Henderson CA, Lavoie‐St‐Amour C, Langlois S, Rivas D, Lehoux S, Kathiresan S, Tardif JC, Musunuru K, Lettre G. Myocardial infarction‐associated snp at 6p24 interferes with MEF2 binding and associates with PHACTR1 expression levels in human coronary arteries. Arterioscler Thromb Vasc Biol. 2015;35:1472–1479. [DOI] [PMC free article] [PubMed] [Google Scholar]
- 14. Beaudoin M, Lo KS, N'Diaye A, Rivas MA, Dube MP, Laplante N, Phillips MS, Rioux JD, Tardif JC, Lettre G. Pooled DNA resequencing of 68 myocardial infarction candidate genes in french canadians. Circ Cardiovasc Genet. 2012;5:547–554. [DOI] [PubMed] [Google Scholar]
- 15. Asztalos BF, de la Llera‐Moya M, Dallal GE, Horvath KV, Schaefer EJ, Rothblat GH. Differential effects of HDL subpopulations on cellular ABCA1‐ and SR‐BI‐mediated cholesterol efflux. J Lipid Res. 2005;46:2246–2253. [DOI] [PubMed] [Google Scholar]
- 16. Low‐Kam C, Rhainds D, Lo KS, Provost S, Mongrain I, Dubois A, Perreault S, Robinson JF, Hegele RA, Dube MP, Tardif JC, Lettre G. Whole‐genome sequencing in French Canadians from Quebec. Hum Genet. 2016;135:1213–1221. [DOI] [PubMed] [Google Scholar]
- 17. Purcell S, Neale B, Todd‐Brown K, Thomas L, Ferreira MA, Bender D, Maller J, Sklar P, de Bakker PI, Daly MJ, Sham PC. Plink: a tool set for whole‐genome association and population‐based linkage analyses. Am J Hum Genet. 2007;81:559–575. [DOI] [PMC free article] [PubMed] [Google Scholar]
- 18. McCarthy S, Das S, Kretzschmar W, Delaneau O, Wood AR, Teumer A, Kang HM, Fuchsberger C, Danecek P, Sharp K, Luo Y, Sidore C, Kwong A, Timpson N, Koskinen S, Vrieze S, Scott LJ, Zhang H, Mahajan A, Veldink J, Peters U, Pato C, van Duijn CM, Gillies CE, Gandin I, Mezzavilla M, Gilly A, Cocca M, Traglia M, Angius A, Barrett JC, Boomsma D, Branham K, Breen G, Brummett CM, Busonero F, Campbell H, Chan A, Chen S, Chew E, Collins FS, Corbin LJ, Smith GD, Dedoussis G, Dorr M, Farmaki AE, Ferrucci L, Forer L, Fraser RM, Gabriel S, Levy S, Groop L, Harrison T, Hattersley A, Holmen OL, Hveem K, Kretzler M, Lee JC, McGue M, Meitinger T, Melzer D, Min JL, Mohlke KL, Vincent JB, Nauck M, Nickerson D, Palotie A, Pato M, Pirastu N, McInnis M, Richards JB, Sala C, Salomaa V, Schlessinger D, Schoenherr S, Slagboom PE, Small K, Spector T, Stambolian D, Tuke M, Tuomilehto J, Van den Berg LH, Van Rheenen W, Volker U, Wijmenga C, Toniolo D, Zeggini E, Gasparini P, Sampson MG, Wilson JF, Frayling T, de Bakker PI, Swertz MA, McCarroll S, Kooperberg C, Dekker A, Altshuler D, Willer C, Iacono W, Ripatti S, Soranzo N, Walter K, Swaroop A, Cucca F, Anderson CA, Myers RM, Boehnke M, McCarthy MI, Durbin R; Haplotype Reference Consortium . A reference panel of 64,976 haplotypes for genotype imputation. Nat Genet. 2016;48:1279–1283. [DOI] [PMC free article] [PubMed] [Google Scholar]
- 19. Willer CJ, Li Y, Abecasis GR. Metal: fast and efficient meta‐analysis of genomewide association scans. Bioinformatics. 2010;26:2190–2191. [DOI] [PMC free article] [PubMed] [Google Scholar]
- 20. Vaisar T, Pennathur S, Green PS, Gharib SA, Hoofnagle AN, Cheung MC, Byun J, Vuletic S, Kassim S, Singh P, Chea H, Knopp RH, Brunzell J, Geary R, Chait A, Zhao XQ, Elkon K, Marcovina S, Ridker P, Oram JF, Heinecke JW. Shotgun proteomics implicates protease inhibition and complement activation in the antiinflammatory properties of hdl. J Clin Investig. 2007;117:746–756. [DOI] [PMC free article] [PubMed] [Google Scholar]
- 21. Machiela MJ, Chanock SJ. Ldlink: a web‐based application for exploring population‐specific haplotype structure and linking correlated alleles of possible functional variants. Bioinformatics. 2015;31:3555–3557. [DOI] [PMC free article] [PubMed] [Google Scholar]
- 22. Nikpay M, Goel A, Won HH, Hall LM, Willenborg C, Kanoni S, Saleheen D, Kyriakou T, Nelson CP, Hopewell JC, Webb TR, Zeng L, Dehghan A, Alver M, Armasu SM, Auro K, Bjonnes A, Chasman DI, Chen S, Ford I, Franceschini N, Gieger C, Grace C, Gustafsson S, Huang J, Hwang SJ, Kim YK, Kleber ME, Lau KW, Lu X, Lu Y, Lyytikainen LP, Mihailov E, Morrison AC, Pervjakova N, Qu L, Rose LM, Salfati E, Saxena R, Scholz M, Smith AV, Tikkanen E, Uitterlinden A, Yang X, Zhang W, Zhao W, de Andrade M, de Vries PS, van Zuydam NR, Anand SS, Bertram L, Beutner F, Dedoussis G, Frossard P, Gauguier D, Goodall AH, Gottesman O, Haber M, Han BG, Huang J, Jalilzadeh S, Kessler T, Konig IR, Lannfelt L, Lieb W, Lind L, Lindgren CM, Lokki ML, Magnusson PK, Mallick NH, Mehra N, Meitinger T, Memon FU, Morris AP, Nieminen MS, Pedersen NL, Peters A, Rallidis LS, Rasheed A, Samuel M, Shah SH, Sinisalo J, Stirrups KE, Trompet S, Wang L, Zaman KS, Ardissino D, Boerwinkle E, Borecki IB, Bottinger EP, Buring JE, Chambers JC, Collins R, Cupples LA, Danesh J, Demuth I, Elosua R, Epstein SE, Esko T, Feitosa MF, Franco OH, Franzosi MG, Granger CB, Gu D, Gudnason V, Hall AS, Hamsten A, Harris TB, Hazen SL, Hengstenberg C, Hofman A, Ingelsson E, Iribarren C, Jukema JW, Karhunen PJ, Kim BJ, Kooner JS, Kullo IJ, Lehtimaki T, Loos RJ, Melander O, Metspalu A, Marz W, Palmer CN, Perola M, Quertermous T, Rader DJ, Ridker PM, Ripatti S, Roberts R, Salomaa V, Sanghera DK, Schwartz SM, Seedorf U, Stewart AF, Stott DJ, Thiery J, Zalloua PA, O'Donnell CJ, Reilly MP, Assimes TL, Thompson JR, Erdmann J, Clarke R, Watkins H, Kathiresan S, McPherson R, Deloukas P, Schunkert H, Samani NJ, Farrall M; CARDIoGRAMplusC4D Consortium . A comprehensive 1,000 genomes‐based genome‐wide association meta‐analysis of coronary artery disease. Nat Genet. 2015;47:1121–1130. [DOI] [PMC free article] [PubMed] [Google Scholar]
- 23. Howson JMM, Zhao W, Barnes DR, Ho WK, Young R, Paul DS, Waite LL, Freitag DF, Fauman EB, Salfati EL, Sun BB, Eicher JD, Johnson AD, Sheu WHH, Nielsen SF, Lin WY, Surendran P, Malarstig A, Wilk JB, Tybjaerg‐Hansen A, Rasmussen KL, Kamstrup PR, Deloukas P, Erdmann J, Kathiresan S, Samani NJ, Schunkert H, Watkins H; CardioGramplusC4D , Do R, Rader DJ, Johnson JA, Hazen SL, Quyyumi AA, Spertus JA, Pepine CJ, Franceschini N, Justice A, Reiner AP, Buyske S, Hindorff LA, Carty CL, North KE, Kooperberg C, Boerwinkle E, Young K, Graff M, Peters U, Absher D, Hsiung CA, Lee WJ, Taylor KD, Chen YH, Lee IT, Guo X, Chung RH, Hung YJ, Rotter JI, Juang JJ, Quertermous T, Wang TD, Rasheed A, Frossard P, Alam DS, Majumder AAS, Di Angelantonio E, Chowdhury R, Epic CVD, Chen YI, Nordestgaard BG, Assimes TL, Danesh J, Butterworth AS, Saleheen D. Fifteen new risk loci for coronary artery disease highlight arterial‐wall‐specific mechanisms. Nat Genet. 2017;49:1113–1119. [DOI] [PMC free article] [PubMed] [Google Scholar]
- 24. Nelson CP, Goel A, Butterworth AS, Kanoni S, Webb TR, Marouli E, Zeng L, Ntalla I, Lai FY, Hopewell JC, Giannakopoulou O, Jiang T, Hamby SE, Di Angelantonio E, Assimes TL, Bottinger EP, Chambers JC, Clarke R, Palmer CNA, Cubbon RM, Ellinor P, Ermel R, Evangelou E, Franks PW, Grace C, Gu D, Hingorani AD, Howson JMM, Ingelsson E, Kastrati A, Kessler T, Kyriakou T, Lehtimaki T, Lu X, Lu Y, Marz W, McPherson R, Metspalu A, Pujades‐Rodriguez M, Ruusalepp A, Schadt EE, Schmidt AF, Sweeting MJ, Zalloua PA, AlGhalayini K, Keavney BD, Kooner JS, Loos RJF, Patel RS, Rutter MK, Tomaszewski M, Tzoulaki I, Zeggini E, Erdmann J, Dedoussis G, Bjorkegren JLM; Consortium E‐C, CardioGramplusC4D, group UKBCCCw , Schunkert H, Farrall M, Danesh J, Samani NJ, Watkins H, Deloukas P. Association analyses based on false discovery rate implicate new loci for coronary artery disease. Nat Genet. 2017;49:1385–1391. [DOI] [PubMed] [Google Scholar]
- 25. Klarin D, Zhu QM, Emdin CA, Chaffin M, Horner S, McMillan BJ, Leed A, Weale ME, Spencer CCA, Aguet F, Segre AV, Ardlie KG, Khera AV, Kaushik VK, Natarajan P; CARDIoGRAMplusC4D Consortium , Kathiresan S. Genetic analysis in UK Biobank links insulin resistance and transendothelial migration pathways to coronary artery disease. Nat Genet. 2017;49:1392–1397. [DOI] [PMC free article] [PubMed] [Google Scholar]
- 26. Global Lipids Genetics Consortium , Willer CJ, Schmidt EM, Sengupta S, Peloso GM, Gustafsson S, Kanoni S, Ganna A, Chen J, Buchkovich ML, Mora S, Beckmann JS, Bragg‐Gresham JL, Chang HY, Demirkan A, Den Hertog HM, Do R, Donnelly LA, Ehret GB, Esko T, Feitosa MF, Ferreira T, Fischer K, Fontanillas P, Fraser RM, Freitag DF, Gurdasani D, Heikkila K, Hypponen E, Isaacs A, Jackson AU, Johansson A, Johnson T, Kaakinen M, Kettunen J, Kleber ME, Li X, Luan J, Lyytikainen LP, Magnusson PK, Mangino M, Mihailov E, Montasser ME, Muller‐Nurasyid M, Nolte IM, O'Connell JR, Palmer CD, Perola M, Petersen AK, Sanna S, Saxena R, Service SK, Shah S, Shungin D, Sidore C, Song C, Strawbridge RJ, Surakka I, Tanaka T, Teslovich TM, Thorleifsson G, Van den Herik EG, Voight BF, Volcik KA, Waite LL, Wong A, Wu Y, Zhang W, Absher D, Asiki G, Barroso I, Been LF, Bolton JL, Bonnycastle LL, Brambilla P, Burnett MS, Cesana G, Dimitriou M, Doney AS, Doring A, Elliott P, Epstein SE, Eyjolfsson GI, Gigante B, Goodarzi MO, Grallert H, Gravito ML, Groves CJ, Hallmans G, Hartikainen AL, Hayward C, Hernandez D, Hicks AA, Holm H, Hung YJ, Illig T, Jones MR, Kaleebu P, Kastelein JJ, Khaw KT, Kim E, Klopp N, Komulainen P, Kumari M, Langenberg C, Lehtimaki T, Lin SY, Lindstrom J, Loos RJ, Mach F, McArdle WL, Meisinger C, Mitchell BD, Muller G, Nagaraja R, Narisu N, Nieminen TV, Nsubuga RN, Olafsson I, Ong KK, Palotie A, Papamarkou T, Pomilla C, Pouta A, Rader DJ, Reilly MP, Ridker PM, Rivadeneira F, Rudan I, Ruokonen A, Samani N, Scharnagl H, Seeley J, Silander K, Stancakova A, Stirrups K, Swift AJ, Tiret L, Uitterlinden AG, van Pelt LJ, Vedantam S, Wainwright N, Wijmenga C, Wild SH, Willemsen G, Wilsgaard T, Wilson JF, Young EH, Zhao JH, Adair LS, Arveiler D, Assimes TL, Bandinelli S, Bennett F, Bochud M, Boehm BO, Boomsma DI, Borecki IB, Bornstein SR, Bovet P, Burnier M, Campbell H, Chakravarti A, Chambers JC, Chen YD, Collins FS, Cooper RS, Danesh J, Dedoussis G, de Faire U, Feranil AB, Ferrieres J, Ferrucci L, Freimer NB, Gieger C, Groop LC, Gudnason V, Gyllensten U, Hamsten A, Harris TB, Hingorani A, Hirschhorn JN, Hofman A, Hovingh GK, Hsiung CA, Humphries SE, Hunt SC, Hveem K, Iribarren C, Jarvelin MR, Jula A, Kahonen M, Kaprio J, Kesaniemi A, Kivimaki M, Kooner JS, Koudstaal PJ, Krauss RM, Kuh D, Kuusisto J, Kyvik KO, Laakso M, Lakka TA, Lind L, Lindgren CM, Martin NG, Marz W, McCarthy MI, McKenzie CA, Meneton P, Metspalu A, Moilanen L, Morris AD, Munroe PB, Njolstad I, Pedersen NL, Power C, Pramstaller PP, Price JF, Psaty BM, Quertermous T, Rauramaa R, Saleheen D, Salomaa V, Sanghera DK, Saramies J, Schwarz PE, Sheu WH, Shuldiner AR, Siegbahn A, Spector TD, Stefansson K, Strachan DP, Tayo BO, Tremoli E, Tuomilehto J, Uusitupa M, van Duijn CM, Vollenweider P, Wallentin L, Wareham NJ, Whitfield JB, Wolffenbuttel BH, Ordovas JM, Boerwinkle E, Palmer CN, Thorsteinsdottir U, Chasman DI, Rotter JI, Franks PW, Ripatti S, Cupples LA, Sandhu MS, Rich SS, Boehnke M, Deloukas P, Kathiresan S, Mohlke KL, Ingelsson E, Abecasis GR. Discovery and refinement of loci associated with lipid levels. Nat Genet. 2013;45:1274–1283. [DOI] [PMC free article] [PubMed] [Google Scholar]
- 27. Aschard H, Vilhjalmsson BJ, Joshi AD, Price AL, Kraft P. Adjusting for heritable covariates can bias effect estimates in genome‐wide association studies. Am J Hum Genet. 2015;96:329–339. [DOI] [PMC free article] [PubMed] [Google Scholar]
- 28. Ward LD, Kellis M. Haploreg: a resource for exploring chromatin states, conservation, and regulatory motif alterations within sets of genetically linked variants. Nucleic Acids Res. 2012;40:D930–D934. [DOI] [PMC free article] [PubMed] [Google Scholar]
- 29. GTEx Consortium . Genetic effects on gene expression across human tissues. Nature. 2017;550:204–213. [DOI] [PMC free article] [PubMed] [Google Scholar]
- 30. Martin JS, Xu Z, Reiner AP, Mohlke KL, Sullivan P, Ren B, Hu M, Li Y. Hugin: Hi‐C unifying genomic interrogator. Bioinformatics. 2017;33:3793–3795. [DOI] [PMC free article] [PubMed] [Google Scholar]
- 31. Vedhachalam C, Narayanaswami V, Neto N, Forte TM, Phillips MC, Lund‐Katz S, Bielicki JK. The C‐terminal lipid‐binding domain of apolipoprotein E is a highly efficient mediator of ABCA1‐dependent cholesterol efflux that promotes the assembly of high‐density lipoproteins. Biochemistry. 2007;46:2583–2593. [DOI] [PubMed] [Google Scholar]
- 32. Annema W, Dikkers A, de Boer JF, Gautier T, Rensen PC, Rader DJ, Tietge UJ. Apoe promotes hepatic selective uptake but not rct due to increased abca1‐mediated cholesterol efflux to plasma. J Lipid Res. 2012;53:929–940. [DOI] [PMC free article] [PubMed] [Google Scholar]
- 33. Pamir N, Hutchins PM, Ronsein GE, Wei H, Tang C, Das R, Vaisar T, Plow E, Schuster V, Reardon CA, Weinberg R, Dichek DA, Marcovina S, Getz GS, Heinecke JW, Koschinsky ML. Plasminogen promotes cholesterol efflux by the abca1 pathway. JCI Insight. 2017;2:92176. [DOI] [PMC free article] [PubMed] [Google Scholar]
- 34. Pamir N, Hutchins P, Ronsein G, Vaisar T, Reardon CA, Getz GS, Lusis AJ, Heinecke JW. Proteomic analysis of HDL from inbred mouse strains implicates APOE associated with HDL in reduced cholesterol efflux capacity via the ABCA1 pathway. J Lipid Res. 2016;57:246–257. [DOI] [PMC free article] [PubMed] [Google Scholar]
- 35. Sacks FM, Alaupovic P, Moye LA, Cole TG, Sussex B, Stampfer MJ, Pfeffer MA, Braunwald E. VLDL, apolipoproteins B, CIII, and E, and risk of recurrent coronary events in the Cholesterol and Recurrent Events (care) trial. Circulation. 2000;102:1886–1892. [DOI] [PubMed] [Google Scholar]
- 36. Brown RJ, Lagor WR, Sankaranaravanan S, Yasuda T, Quertermous T, Rothblat GH, Rader DJ. Impact of combined deficiency of hepatic lipase and endothelial lipase on the metabolism of both high‐density lipoproteins and apolipoprotein b‐containing lipoproteins. Circ Res. 2010;107:357–364. [DOI] [PMC free article] [PubMed] [Google Scholar]
- 37. El Khoury P, Plengpanich W, Frisdal E, Le Goff W, Khovidhunkit W, Guerin M. Improved plasma cholesterol efflux capacity from human macrophages in patients with hyperalphalipoproteinemia. Atherosclerosis. 2014;234:193–199. [DOI] [PubMed] [Google Scholar]
- 38. Finucane HK, Bulik‐Sullivan B, Gusev A, Trynka G, Reshef Y, Loh PR, Anttila V, Xu H, Zang C, Farh K, Ripke S, Day FR; ReproGen Consortium, Schizophrenia Working Group of the Psychiatric Genomics Consortium, RACI Consortium , Purcell S, Lindstrom S, Perry JR, Okada Y, Raychaudhuri S, Daly MJ, Patterson N, Neale BM, Price AL. Partitioning heritability by functional annotation using genome‐wide association summary statistics. Nat Genet. 2015;47:1228–1235. [DOI] [PMC free article] [PubMed] [Google Scholar]
- 39. Bulik‐Sullivan B, Finucane HK, Anttila V, Gusev A, Day FR, Loh PR; ReproGen Consortium, Psychiatric Genomics Consortium, Genetic Consortium for Anorexia Nervosa of the Wellcome Trust Case Control Consortium , Duncan L, Perry JR, Patterson N, Robinson EB, Daly MJ, Price AL, Neale BM. An atlas of genetic correlations across human diseases and traits. Nat Genet. 2015;47:1236–1241. [DOI] [PMC free article] [PubMed] [Google Scholar]
- 40. Bigdeli TB, Lee D, Webb BT, Riley BP, Vladimirov VI, Fanous AH, Kendler KS, Bacanu SA. A simple yet accurate correction for winner's curse can predict signals discovered in much larger genome scans. Bioinformatics. 2016;32:2598–2603. [DOI] [PMC free article] [PubMed] [Google Scholar]
Associated Data
This section collects any data citations, data availability statements, or supplementary materials included in this article.
Supplementary Materials
Data S1. Supplemental Methods.
Table S1. Demographics and clinical information for the participants involved in the study
Table S2. Technical variability of cholesterol efflux capacity assays assessed with QC sample (pooled normal human serum, apoB‐depleted) in each assay batch (N=106)
Table S3. Proteins, and corresponding genes, found in HDL particles by proteomic analyses2
Table S4. Cholesterol efflux capacity association results stratified on coronary artery disease case‐control status
Table S5. Association results between variants associated with cholesterol efflux capacity and HDL‐cholesterol levels in 5168 French Canadians from the MHI Biobank
Table S6. Association results between variants associated with cholesterol efflux capacity and triglyceride (TG) levels in 5168 French Canadians from the MHI Biobank
Table S7. Association results between HDL‐C‐associated SNPs that were reported previously to be nominally associated with cholesterol efflux capacity (CEC) in 850 individuals from GRAPHIC3
Figure S1. Chromosome conformation (Hi‐C) data from human liver obtained from the HUGIn browser1 around SNP rs75657792, which is associated with J774‐basal CEC values. The top panel represents the gene at the locus (shades of red indicate expression levels in human liver). Histone tail marks obtained by ChIP‐seq are represented in the middle panel. The Hi‐C data is summarized in the bottom panel. The black rectangle corresponds to the anchor point and includes rs75657792. The black and red lines indicate the number of observed and expected Hi‐C contacts between the anchor point and the corresponding regions. The line in blue corresponds to the ‐log10(P‐value). We can observe two strong Hi‐C signals between the anchor point and the PLB1 gene (red oval).