

Abstract
Background
Ischemic stroke from carotid plaque embolism remains a major cause of morbidity in patients with type 2 diabetes mellitus (T2DM). However, the effect of early T2DM and obesity on carotid remodeling and plaque burden remains elusive. We assessed carotid remodeling and plaque composition by carotid magnetic resonance imaging in patients with short‐duration T2DM compared with a sex‐ and age‐matched control group.
Methods and Results
One hundred patients with T2DM (duration <5 years) and 100 sex‐ and age‐matched controls underwent bilateral carotid artery magnetic resonance imaging in a 1.5‐T magnetic resonance imaging scanner. Plaque burden was quantified by normalized wall index, maximum wall thickness, maximum wall area, and minimum lumen size. Plaque morphology was quantified by calcified plaque volume, necrotic core volume, and loose matrix volume. Magnetic resonance imaging data were available for 149 and 177 carotid arteries from T2DM patients and controls, respectively. Adjusted for age and sex, T2DM was associated with increased plaque burden indicated by a higher normalized wall index (ratio 1.03 [95% confidence interval, 1.002; 1.06], P=0.03), and negative remodeling indicated by a lower minimum lumen area (ratio 0.81 [0.74; 0.89], P<0.001), and lower maximum wall area (ratio 0.94 [0.88; 1.00], P=0.048) compared with controls. In both T2DM and controls, body mass index ≥30.0 kg/m2 was associated with an 80% increase in total calcified plaque volume, and a 44% increase in necrotic core volume compared with body mass index <25.0 kg/m2.
Conclusions
Short‐duration T2DM was associated with increased carotid plaque burden and negative remodeling. Obesity was associated with increased carotid artery necrotic core volume and calcification independently of diabetes mellitus status.
Clinical Trial Registration
URL: https://www.clinicaltrials.gov. Unique identifier: NCT00674271.
Keywords: atherosclerosis, carotid magnetic resonance imaging, plaque modification, remodeling
Subject Categories: Magnetic Resonance Imaging (MRI), Clinical Studies, Vascular Biology
Clinical Perspective
What Is New?
This study showed that even short‐duration type 2 diabetes mellitus was associated with increased carotid plaque burden and negative remodeling.
Obesity was associated with increased carotid necrotic core volume and calcification both in patients with diabetes mellitus and in nondiabetic sex‐ and age‐matched controls.
What Are the Clinical Implications?
These findings emphasize the adverse vascular effects of even short‐duration type 2 diabetes mellitus and additionally highlight the atherogenic effect of obesity in subjects with and without diabetes mellitus.
Introduction
Despite major improvements in treatment, cardiovascular and cerebrovascular complications including ischemic stroke remain a major cause of morbidity and mortality in patients with type 2 diabetes mellitus (T2DM).1, 2, 3 It is generally acknowledged that atherosclerosis is accelerated in patients with T2DM.4 Previous studies on advanced lesions in the coronary circulation have pointed toward unique signatures of the atherosclerotic process in individuals with diabetes mellitus. Multiple studies have found a high propensity for negative remodeling in coronary lesions associated with diabetes mellitus, whereby the outer wall contracts, leading to enhanced stenosis.5, 6 More typically, vessel walls are thought to undergo positive remodeling that preserves the lumen dimensions as plaque develops.7 Whether this counterintuitive negative remodeling is also found in large peripheral arteries of T2DM has not been reported. Also, the early stages of atherosclerosis in the obese and in patients with T2DM are sparsely elucidated and limited information is available regarding carotid artery composition in patients with short‐duration T2DM on contemporary medication.
Noninvasive ultrasonographic assessment of carotid intima‐media thickness and total plaque area are associated with future risk of ischemic stroke and myocardial infarction.8, 9 However, ultrasound provides limited information regarding morphological plaque characteristics indicative of plaque vulnerability (ie, presence of a large lipid‐rich necrotic core, a thin inflamed fibrous cap, and intraplaque hemorrhage).10, 11 Carotid magnetic resonance imaging (MRI) enables detailed noninvasive high‐resolution images of the carotid arterial wall and allows accurate characterization of the plaque composition. Carotid MRI plaque assessment has been validated by comparison with histological assessment of carotid endarterectomy samples.12, 13, 14, 15, 16, 17, 18 In patients with carotid atherosclerotic disease, the presence of carotid intraplaque hemorrhage, a lipid‐rich necrotic core, and thinned or ruptured fibrous cap detected by MRI is associated with increased risk of future stroke or transient ischemic attack.19 In asymptomatic subjects free of cardiovascular disease, vulnerable carotid plaque characteristics including remodeling index, lipid core, and calcium by MRI are significant predictors of cardiovascular events and improves the reclassification of baseline cardiovascular risk.20
The aim of this study was to characterize carotid plaque composition by carotid MRI in patients with short‐duration T2DM compared with a sex‐ and age‐matched control group and to evaluate the association between plaque characteristics and other cardiovascular risk factors.
Methods
The data, analytic methods, and study materials will be made available to other researchers for purposes of reproducing the results or replicating the procedure. Material will be available upon request to the corresponding author.
Study Participants
One hundred patients with T2DM and 100 control subjects matched individually for sex and age were recruited as previously described.21 Briefly, patients were recruited from the outpatient clinics at Aarhus University Hospital, Denmark. Inclusion criteria were age >18 years, diagnosis of T2DM according to World Health Organization criteria,22 and known duration of diabetes mellitus <5 years. The control subjects were recruited by advertising in the local press. Undiagnosed diabetes mellitus was excluded by fasting glucose and oral glucose tolerance test. Subjects with impaired fasting glucose (9 participants) or impaired glucose tolerance (3 participants) or both (2 participants) were accepted as control subjects. Exclusion criteria were acute or chronic infectious disease, end‐stage renal failure, pregnancy or lactation, prior or present cancer, and contraindications to MRI (including body weight >120 kg). The study was approved by the Research Ethics Committee of Central Region, Denmark and by the Danish Data Protection Agency. All patients gave their written informed consent to participate.
Carotid MRI Protocol
The participants were scanned in a 1.5‐T Philips Achieva MRI scanner (Achieva, Philips, Best, The Netherlands) with a dedicated 4‐channel phased array carotid coil, using a standardized protocol obtaining 4 different contrast‐weighted images (time of flight, T1‐, PD and T2‐weighted). The scans were centered on the carotid bifurcation choosing the flow divider of the right carotid artery for standardization, and 10 transverse slices were acquired on both carotid arteries using cardiac‐gated turbo spin‐echo sequences: T1 weighted (repetition time/echo time /inversion time): (1RR (Relapsing‐remitting)/8/650 ms), T2 weighted and proton density weighted scans with repetition time=3RR and echo time=40/20 ms, and a time of flight sequence (repetition time/echo time 34.9/2.4 ms). All sequences covered a field of view of 10×10 cm using a 256×256 matrix yielding a raw resolution of 0.39×0.39 mm2 with 2.5‐mm slice thickness and a 0.5‐mm slice gap.
Image Review
Image segmentation and reviewing was conducted by 2 experienced reviewers with >5 years’ experience in cardiovascular MRI by consensus and blinded to diabetes mellitus status. The image quality from each artery was assessed on a 5‐point scale (1=worst, 5=best). Only images with a quality ≥3 were used for further analysis.
Carotid artery plaque burden and wall characteristics were evaluated using the semi‐automatic image analysis tool PlaqueView (VPDiagnostics, Seattle, WA) according to previously validated methodology.23 The lumen area and total vessel area were outlined. Carotid artery plaque burden was measured as maximum wall thickness derived from the lumen area and total vessel area outlines, maximum wall area (wall area=total vessel area−lumen area) and maximum normalized wall index (normalized wall index=wall area/total vessel area). One value for each parameter was obtained in each cross‐sectional image (n=10). Reporting the total value for the 10 cross‐sectional images could tend to underestimate the disease status since the majority of slices were free of disease. On the other hand, reporting only the maximal value from each artery would lead to disproportionate noise being emphasized, as any outliers would become representative of the overall patient status. To reduce this, a sliding windows method was used to quantify plaque burden. Essentially, this method consists of calculating the average of the images 1 to 3, then the average of 2 to 4, 3 to 5, etc, yielding a total of 8 values. Subsequently, the maximal value of the averages was calculated and reported in absolute values and relative to the relevant wall area.
Atherosclerotic plaque characteristics were quantified by calcified plaque volume, necrotic core volume, and loose matrix volume from the slice with the maximum thickness and the 2 adjacent slices (Figure 1). These 3 plaque components are reported both as total volume (mm3) and as maximal volume relative to wall area (%).
Figure 1.
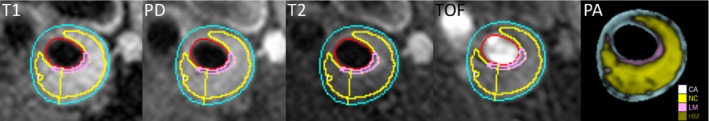
Carotid plaque characteristics. The results from the multiweighted MR analysis are shown. The images (from left) of the internal carotid artery are T1‐weighted, proton density–weighted, T2‐weighted, time‐of‐flight, and resulting ROI areas. The ROIs outline the estimated area for segmented area (blue), CA, calcification (white), NC, necrotic core (yellow), LM, loose matrix (pink), and HM, hemorrhage (olive). MR indicates magnetic resonance; ROI, region of interest.
Biochemistry
Plasma glucose was analyzed by the glucose oxidase method, and insulin was measured by ELISA.24 Insulin resistance was assessed based on the homeostatic model of assessment (HOMA) using fasting glucose and fasting insulin levels. The HOMA index was calculated based on the HOMA2 model developed by Levy et al.25 Urinary albumin excretion was evaluated by the albumin/creatinine ratio in a morning urine sample.
Blood Pressure
Office blood pressure (BP) was measured after a minimum of 5 minutes of rest in the seated position by a Riester Champion N automatic blood pressure monitor (Riester GmbH, Jungingen, Germany) or a Speidel & Keller mercury sphygmomanometer (Speidel & Keller, Welch Allyn, Jungingen, Germany) on the right arm, and mean systolic and diastolic BP was calculated as the average of 3 measurements. Ambulatory BP was monitored at 20‐minute intervals for 24 hours using Spacelabs 90217 (Spacelabs Healthcare, Issaquah, WA). Recordings with more than 3 missing hours (maximum 1 hour during the night) were excluded.
Body Composition
Fat percentage was assessed by whole body dual‐energy X‐ray absorptiometry.
Statistical Analysis
Data distribution was assessed by histograms and QQ‐plots. Patient characteristics are reported as mean±SD for normally distributed data and as median with interquartile range for skewed data. Continuous patient characteristics are compared with unpaired t tests and categorical data with χ2 test. Carotid plaque data in patients with diabetes mellitus and controls are compared with a linear mixed effects model analysis to enable adjustment for intra‐individual correlation between data from the 2 carotids. The plaque data were skewed and accordingly log‐transformed for analysis. Hence, the differences in plaque parameters between patients with diabetes mellitus and controls were evaluated on the log‐scale in the linear mixed‐effect model. As ln(carotid parameterdiabetes) minus ln(carotid parametercontrols) equals ln(carotid parameterdiabetes/carotid parametercontrols), the results of the linear‐mixed effects model are reported as the ratio (diabetes mellitus/controls). To facilitate the interpretation of the linear mixed‐effects model analyses, the logarithmic coefficients (with 95% confidence interval) from the analyses were back‐transformed by exponentiating the log values of the analyses, and these values are reported. The 2 groups (patients and controls) were compared in a basic model with adjustment for the matching criteria age and sex and in multivariate models. The following covariates (beyond diabetes mellitus status, age, and sex) were considered 1 by 1 for inclusion in the multivariate model: total cholesterol, low‐density lipoprotein (LDL) cholesterol, statin use (yes/no), smoking (current/previous/never), fat percentage, waist–hip ratio, body mass index (BMI), hemoglobin A1c, HOMA2‐IR (only calculated in patients not receiving insulin), estimated glomerular filtration rate, urinary albumin–creatinine ratio, history of stroke, history of cardiovascular disease (myocardial infarction, percutaneous coronary intervention, coronary artery bypass surgery or stroke), office systolic BP, and 24‐hour ambulatory systolic BP. Variables that were significantly associated with the carotid parameters were then tested in the model 2 at a time (with age and sex) (eg, BMI and fat percentage, BMI and total cholesterol, etc). Model fit was assessed based on covariate significance (P<0.05), log‐likelihood ratio test (nested models), and the Akaike's information criterion/Bayesian information criterion (non‐nested models). Only 3 patients and 6 controls had plaque hemorrhage and accordingly this parameter was not included in the statistical analysis.
Estimated differences between groups are reported as coefficients with (95% confidence interval) for MRI data. All other data are presented as mean (±SD). P<0.05 were considered statistically significant. All analyses were performed using Stata version 14 (Stata Corp LP, TX).
Results
Characteristics of patients with T2DM and control subjects together with MRI data are presented in Table 1. Because of the study design, age and sex were equally distributed and the patients were recently diagnosed. The T2DM patients had good glycemic control, lower office BP, total cholesterol, LDL, and high‐density lipoprotein levels and higher resting heart rate, BMI, fat percentage, waist–hip ratio, triglycerides, estimated glomerular filtration rate, and urinary albumin–creatinine ratio compared with controls. The 24‐hour systolic and diastolic BPs were comparable in the 2 groups. Smoking patterns were equally distributed. A significantly higher proportion of patients received statin and antihypertensive therapy. The majority of the patients with T2DM received oral antidiabetic drugs.
Table 1.
Patient and Control Characteristics
| Variable | Patients With Type 2 Diabetes Mellitus (n=78) | Controls (n=91) | P Value |
|---|---|---|---|
| Age, y | 59±10 | 59±9 | 0.75 |
| Male sex, n (%) | 39 (50) | 47 (52) | 0.83 |
| Diabetes mellitus duration, y | 1.7 (0.7; 3.1) | ··· | |
| HbA1c, % | 6.6±0.7 | 5.6±0.3 | <0.001 |
| HbA1c, mmol/mol | 49±8 | 38±3 | <0.001 |
| Systolic BP, mm Hg | 126±12 | 132±15 | 0.01 |
| Diastolic BP, mm Hg | 78±8 | 83±10 | <0.001 |
| Resting HR, bpm | 67±10 | 62±10 | <0.01 |
| 24‐h systolic BP, mm Hg | 126±10 | 125±13 | 0.66 |
| 24‐h diastolic BP, mm Hg | 75±8 | 76±8 | 0.19 |
| BMI, kg/m2 | 29.4±4.4 | 26.2±4.0 | <0.001 |
| Waist–hip ratio | 0.98±0.08 | 0.94±0.08 | <0.01 |
| Fat percent, % | 33±8 | 29±8 | <0.01 |
| Smoking (present/previous/never) (%) | 21/32/47 | 22/35/44 | 0.89 |
| Estimated glomerular filtration rate, mL/min per 1.73 m2 | 87±17 | 82±14 | 0.04 |
| Urinary albumin/creatinine ratio, mg/g | 0.31 (0.21; 0.64) | 0.23 (0.15; 0.40) | 0.01 |
| Total cholesterol, mmol/L | 4.4±0.8 | 5.6±1.0 | <0.001 |
| HDL cholesterol, mmol/L | 1.4±0.3 | 1.7±0.5 | <0.001 |
| LDL cholesterol, mmol/L | 2.3±0.7 | 3.4±0.9 | <0.001 |
| Triglycerides, mmol/L | 1.4 (1.1; 1.9) | 1.2 (0.9; 1.6) | <0.01 |
| Diabetes mellitus treatment, %a | |||
| Insulin | 8 | ||
| Other antidiabetic drugs | 72 | ||
| Diet | 28 | ||
| Statin treatment, % | 77 | 16 | <0.001 |
| Antihypertensive treatment, % | 67 | 25 | <0.001 |
| History of cardiovascular disease, %b | 4 | 11 | 0.12 |
Data are reported as %, mean±SD or median (interquartile range). BMI indicates body mass index; BP, blood pressure; bpm, beats per minute; HbA1c, hemoglobin A1c; HR, heart rate; HDL, high‐density lipoprotein; LDL, low‐density lipoprotein.
Five patients received both insulin and other antiglycemic treatment and accordingly percentages sum to >100.
History of cardiovascular disease: Previous myocardial infarction/percutaneous coronary intervention, coronary artery bypass grafting, stroke.
MRI data were available for 149 and 177 carotid arteries from 78 patients with T2DM and 91 control subjects, respectively. In the patient and control group, the 51 and 23 missing values were caused by discomfort and previously unrecognized claustrophobia (12 and 10 carotids, respectively), bifurcation of nonindex artery out of window (3 and 4 carotids, respectively), and quality rating <3 or other technical reasons (36 and 9 carotids, respectively). Clinical characteristics of participants with and without MRI data are presented in Table S1. Patients with T2DM in whom MRI data were not available had significantly higher BMI than T2DM with MRI data, and the 9 controls without MRI data were significantly younger and had lower hemoglobin A1c than controls with MRI data (Table S1).
Carotid wall characteristics and plaque composition data are presented in Table 2. According to the study design, adjustment for age and sex was required for statistical analysis (unadjusted data are provided for reference). The ratios shown in Table 2 indicate that with adjustment for age and sex, a 3% higher normalized wall index and a 19% lower minimum lumen area and a 6% smaller maximum wall area were observed in patients with T2DM. BMI was associated with maximum wall area and all plaque characteristics; it was positively associated with calcified plaque and necrotic core (total volume and maximal volume/wall ratio) and negatively with loose matrix (total volume and maximal volume/wall ratio). Additional analysis identified a u‐shaped relationship between BMI and calcified plaque, with a minimum value of 25.4 kg/m2 for total volume and 26.1 kg/m2 for maximal volume/wall area, respectively. Similarly, a u‐shaped relationship between BMI and loose matrix was observed, with a maximum value of 25.2 kg/m2 for total volume and 24.4 kg/m2 for maximal volume/wall area, respectively.
Table 2.
Carotid Plaque Parameters in Patients With Type 2 Diabetes Mellitus and Age‐ and Sex‐Matched Control Subjects
| Unadjusted Measures | Adjusted for Age and Sex | Adjusted for Age, Sex, and BMI | Adjusted for Age, Sex, BMI, LDL‐Cholesterol, Smoking, and History of Stroke | |||||
|---|---|---|---|---|---|---|---|---|
| Diabetic Patients | Control Subjects | Ratio (95% CI) | P Value | Ratio (95% CI) | P Value | Ratio (95% CI) | P Value | |
| Maximum normalized wall index | 0.53 | 0.51 | 1.03 (1.002; 1.06) | 0.03 | 1.02 (0.99; 1.05) | 0.19 | 1.93 (1.00; 1.07) | 0.05 |
| maximum wall thickness (mm) | 2.3 | 2.4 | 0.97 (0.91; 1.03) | 0.28 | 0.96 (0.90; 1.03) | 0.22 | 0.97 (0.90; 1.05) | 0.46 |
| Minimum lumen area (mm2) | 21.5 | 26.5 | 0.81 (0.74; 0.89) | <0.001 | 0.81 (0.73; 0.89) | <0.001 | 0.77 (0.69; 0.86) | <0.001 |
| Maximum wall area (mm2) | 41.2 | 44.2 | 0.94 (0.88; 0.999) | 0.048 | 0.91 (0.85; 0.97) | <0.01 | 0.90 (0.83; 0.97) | <0.01 |
| Total volume calcified plaque (mm3) | 24.3 | 28.7 | 0.86 (0.63; 1.17) | 0.34 | 0.75 (0.55; 1.03)a | 0.08 | 0.61 (0.42; 0.88)a | <0.01 |
| Total volume necrotic core (mm3) | 69.5 | 64.4 | 1.10 (0.90; 1.36) | 0.35 | 0.97 (0.78; 1.20) | 0.76 | 0.96 (0.75; 1.24) | 0.78 |
| Total Volume loose matrix (mm3) | 22.4 | 27.8 | 0.81 (0.61; 1.07) | 0.14 | 0.92 (0.69; 1.23)a | 0.57 | 1.09 (0.79; 1.51)a | 0.59 |
| Maximum calcified plaque volume/wall area | 0.07 | 0.08 | 0.92 (0.71; 1.20) | 0.55 | 0.83 (0.63; 1.09)a | 0.18 | 0.66 (0.48; 0.91)a | 0.01 |
| Maximum necrotic plaque volume/wall area | 0.20 | 0.18 | 1.16 (0.98; 1.39) | 0.08 | 1.05 (0.88; 1.26) | 0.58 | 0.96 (0.84; 1.29) | 0.72 |
| Maximum loose matrix volume/wall area | 0.07 | 0.08 | 0.86 (0.65; 1.12) | 0.25 | 0.99 (0.76; 1.31)a | 0.98 | 1.18 (0.86; 1.60)a | 0.30 |
95% CI indicates 95% confidence interval; BMI, body mass index; LDL, low‐density lipoprotein.
BMI included as a second‐order polynomial. See text for details.
Total cholesterol was negatively associated with calcified plaque (total volume and maximum volume/wall ratio), LDL cholesterol was negatively associated with calcified plaque and positively associated with loose matrix (total volume and maximum volume/wall ratio), fat percentage was positively associated with necrotic core (total volume and maximal volume/wall ratio) and negatively with loose matrix (total volume and maximal volume/wall ratio). Never having smoked was positively associated with maximum wall area and loose matrix (total volume). A history of stroke was associated with a smaller minimum lumen area. Statin use, waist–hip ratio, hemoglobin A1c, HOMA2_IR, estimated glomerular filtration rate, urinary albumin–creatinine ratio, history of cardiovascular disease, office systolic BP, and 24‐hour ambulatory systolic BP were not associated with any of the wall or plaque parameters.
With adjustment for age, sex, and BMI, other covariates that were significant in the model with age and sex did not contribute significantly to the model, except total and LDL cholesterol remained negatively associated with calcified plaque (maximum volume/wall ratio), never smoking remained associated with maximum wall area and loose matrix, and a history of stroke remained associated with a smaller minimum lumen area. Diabetes mellitus remained associated with a significantly lower minimal lumen area and maximum wall area with adjustment for age, sex, and BMI (Table 2). These associations remained significant with additional adjustment for LDL cholesterol, smoking, or history of stroke. Additionally, in the latter model, the association between diabetes mellitus and reduced calcified plaque volume became significant.
The association between BMI and the carotid parameters was evaluated further by including BMI in the models categorized as <25.0, 25.0 to 29.99, and ≥30.0 kg/m2 adjusted for age, sex, and diabetes mellitus status (Table 3). BMI was <25.0 kg/m2 in 15.4% of T2DM and 38.5% of controls, 43.6% of T2DM and 46.2% of controls had BMI 25.0 to 29.99 kg/m2, and 41.0% of T2DM and 15.4% of controls had BMI >30.0 kg/m2.
Table 3.
Association Between BMI Group and Carotid Plaque Parameters
| BMI (kg/m2) | Ratio (95% CI) | P Value |
|---|---|---|
| Maximum normalized wall index | ||
| <25 | 1 | |
| 25 to 29.99 | 1.02 (0.99; 1.06) | 0.18 |
| ≥30 | 1.03 (0.99; 1.07) | 0.10 |
| Maximum wall thickness | ||
| <25 | 1 | |
| 25 to 29.99 | 1.01 (0.93; 1.09) | 0.82 |
| ≥30 | 1.02 (0.93; 1.12) | 0.66 |
| Minimum lumen area | ||
| <25 | 1 | |
| 25 to 29.99 | 0.96 (0.86; 1.08) | 0.52 |
| ≥30 | 1.05 (0.92; 1.19) | 0.49 |
| Maximum wall area | ||
| <25 | 1 | |
| 25 to 29.99 | 1.04 (0.97; 1.13) | 0.27 |
| ≥30 | 1.12 (1.03; 1.23) | 0.01 |
| Total volume calcified plaque | ||
| <25 | 1 | |
| 25 to 29.99 | 0.88 (0.61; 1.28) | 0.51 |
| ≥30 | 1.80 (1.18; 2.72) | <0.01 |
| Total volume necrotic core | ||
| <25 | 1 | |
| 25 to 29.99 | 1.15 (0.89; 1.49) | 0.29 |
| ≥30 | 1.44 (1.07; 1.94) | 0.02 |
| Total volume loose matrix | ||
| <25 | 1 | |
| 25 to 29.99 | 1.35 (0.97; 1.89) | 0.08 |
| ≥30 | 0.65 (0.44; 0.95) | 0.03 |
| Maximum calcified plaque volume/wall area | ||
| <25 | 1 | |
| 25 to 29.99 | 0.83 (0.60; 1.14) | 0.25 |
| ≥30 | 1.62 (1.13; 2.33) | <0.01 |
| Maximum necrotic plaque volume/wall area | ||
| <25 | 1 | |
| 25 to 29.99 | 1.10 (0.89: 1.37) | 0.38 |
| ≥30 | 1.31 (1.02; 1.67) | 0.03 |
| Maximum loose matrix volume/wall area | ||
| <25 | 1 | |
| 25 to 29.99 | 1.28 (0.93; 1.76) | 0.13 |
| ≥30 | 0.59 (0.41; 0.84) | <0.01 |
Based on data from 149 carotid arteries in 78 patients with diabetes mellitus and 177 carotid arteries from 91 control subjects. Adjusted for age, sex, and diabetes mellitus (yes/no). BMI indicates body mass index; 95% CI, 95% confidence interval.
With adjustment for age, sex, and diabetes mellitus status, BMI ≥30.0 kg/m2 was associated with an 80% increase in total calcified plaque volume corresponding to a 62% increase in maximum calcified plaque volume/wall area ratio, a 44% increase in total necrotic core volume corresponding to a 31% increase in maximum necrotic plaque volume/wall area, and a 35% reduction in total loose matrix volume corresponding to a 41% reduction in maximum loose matrix volume/wall area compared with BMI <25.0 kg/m2 (Table 3 and Figure 2). We observed no statistically significant interaction between diabetes mellitus and BMI in the association with the plaque parameters and hence we assumed the observed associations between BMI and the abovementioned plaque parameters were the same in both T2DM and controls. Additional adjustment for total cholesterol, LDL cholesterol (Table S2), smoking, or history of stroke (data not shown) changed the estimates of the models only very marginally.
Figure 2.
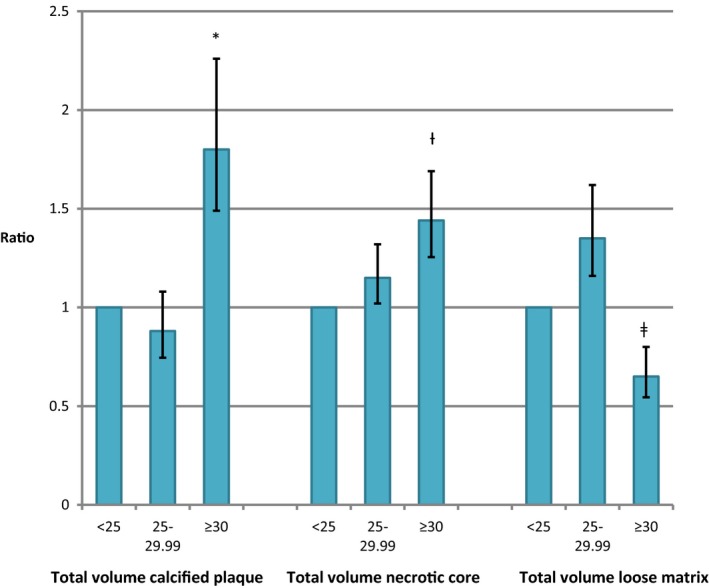
Body mass index (BMI) and carotid plaque characteristics. Comparison of calcified plaque volume, necrotic core volume, and loose matrix volume in the 3 BMI groups (<25 [reference], 25–29.99, and ≥30 kg/m2). Data from patients with type 2 diabetes mellitus and controls are combined since no significant interaction between diabetes mellitus/control group and BMI was observed. *P<0.01 vs BMI<25.0 kg/m2. † P=0.02 vs BMI<25.0 kg/m2. ‡ P=0.03 vs BMI<25.0 kg/m2.
Discussion
We studied carotid arterial wall and atherosclerotic plaque characteristics assessed by carotid MRI in patients with recently diagnosed T2DM compared with sex‐ and age‐matched control subjects. The first main finding of our study was that normalized wall index was higher and minimum lumen area and maximum wall area were lower in patients with T2DM. The total and relative volume of plaque calcification were significantly lower in T2DM patients compared with controls with a multivariate model, whereas no statistically significant differences were observed in total and relative volume of necrotic core and loose matrix in the patients with T2DM compared with the control group. However, there was a near significant (P=0.08) increase in normalized maximum necrotic plaque volume in patients. The second main finding was that obesity (BMI>30.0 kg/m2) was associated with increased calcified and necrotic plaque volumes independent of diabetes mellitus status. Fat percentage was positively associated with necrotic core volume before adjustment for BMI, suggesting the association between BMI and necrotic core could partly be mediated by fat percentage.
Our results show the atherogenic effect of T2DM even in newly diagnosed and well‐controlled patients, as normalized wall index, a measure of carotid plaque burden, was increased. Our results also demonstrated that obesity, independently of diabetes mellitus status, was associated with carotid plaque morphological features such as necrotic plaque volume and calcification. This association was observed even though morbid obesity (weight >120 kg) was an exclusion criterion for the study. Furthermore, the significantly smaller minimum lumen and concomitant smaller maximum wall area observed in the patients with diabetes mellitus suggest that constrictive inward remodeling of the carotid wall is an early occurrence in the diabetic vascular disease process that is not ameliorated by well‐controlled glycemic, BP, and lipid levels (Table 1). The paradoxical finding of increased maximum wall area in the control subjects compared with T2DM patients most likely reflects the negative inward remodeling process in diabetes mellitus, which was accounted for by the normalized wall indices as shown in Table 2. Few patients had MRI signs of intraplaque hemorrhage, an established marker of plaque vulnerability, reflecting the fact that the majority of study participants were asymptomatic and therefore did not show advanced carotid atherosclerosis.
The predictive value of MRI carotid plaque imaging was recently demonstrated during a mean follow‐up period of 5.5 years in 946 asymptomatic subjects. Compared with traditional risk factors, 15.8% more subjects with events and 7.4% of subjects without events were correctly reclassified when both the carotid remodeling index and the lipid core were used for risk stratification.20
Previous in‐vivo and ex‐vivo studies that have investigated the association between T2DM and carotid atherosclerosis have shown conflicting results. The Rotterdam Study used multislice computed tomography to study aortic arch, coronary, and carotid calcification in 1002 patients aged >55 years and demonstrated that diabetes mellitus was associated with increased carotid calcification only in women.26 However, the methodology precluded evaluation of other plaque characteristics. Spagnoli evaluated plaque morphology in carotid endarterectomy specimens from patients with transient ischemic attack or stroke and found that fibrous plaque was correlated with age and diabetes mellitus.27 However, in another ex‐vivo study from patients who underwent carotid endarterectomy, no difference was observed in plaque morphology in T2DM compared with nondiabetic subjects.28 Compared with these ex‐vivo studies in symptomatic patients with advanced atherosclerosis, the MRI technique offers several advantages (ie, noninvasive in‐vivo plaque characterization and evaluation of early atherosclerotic plaque morphology in a larger patient sample). Furthermore, with a larger patient sample other established cardiovascular risk factors can be included in the statistical analysis, providing a more comprehensive assessment of factors associated with carotid atherosclerosis. In a previous carotid MRI study involving 191 patients with moderate‐ to high‐grade carotid stenosis, T2DM was associated with high‐risk lesion types.29
The carotid remodeling process has been studied by carotid MRI in 30 patients with high cardiovascular risk, demonstrating that carotid plaque progression was associated with negative remodeling whereas femoral plaque burden was compensated by positive remodeling. In this population, the carotid lumen area decreased 3.2% per year (P=0.018).30 In a smaller study including 23 patients with 2 or more cardiovascular risk factors, a 1.2% (P=0.07) yearly reduction in carotid lumen area and a 5.1% (P<0.001) increase in normalized wall index was observed.31 These previously published data on negative carotid remodeling are in agreement with our results. Based on the data from Bianda et al,30 the difference in minimum lumen area between diabetic and nondiabetic patients in our study suggests that carotid atherosclerosis in T2DM is accelerated on average 6.4 years compared with nondiabetics, which again reflects the early atherogenic effect of diabetes mellitus. The importance of carotid remodeling is not well understood and the clinical relevance remains unknown. In the PROSPECT (Observations to Study Predictors of Events in the Coronary Tree: An Imaging Study in Patients With Unstable Atherosclerotic Lesions) study, both positive and negative coronary remodeling was associated with major adverse cardiac events compared with intermediate remodeling lesions. Furthermore, while positive remodeling lesions had the largest plaque burden, thin‐cap fibroatheroma was most common in negative remodeling lesions.32 Thus, it remains unsolved whether arterial remodeling is a valid surrogate measure of plaque vulnerability compared with plaque burden and plaque morphology. In the present study, we used noncontrast‐enhanced carotid MRI to measure plaque burden and morphology. Other MRI measures to assess carotid plaque vulnerability have been investigated using either ultrasmall super‐paramagnetic iron oxide particles to detect inflammatory cells within carotid plaques33 or dynamic contrast‐enhanced MRI to assess carotid plaque neovasculature density.34
The association between obesity and increased carotid intima media thickness has been well documented in a large cohort study,35 and carotid intima media thickness measured by ultrasound has been shown to predict adverse cardiovascular outcome.36 Obesity, being one of the components of the metabolic syndrome,37 is associated with other cardiovascular risk factors including hypertension, T2DM, and hyperlipidemia leading to increased cardiovascular mortality.38, 39 Our data using carotid MRI strongly support the notion of obesity being a major risk factor for developing advanced carotid atherosclerosis since BMI ≥30.0 kg/m2 was positively associated with both necrotic core size and increased carotid artery calcification and negatively associated with loose matrix size compared with BMI <25.0 kg/m2.
Limitations
The cross‐sectional study design precludes conclusions regarding causality for the association between the investigated parameters, and confounding by healthy survivor bias cannot be ruled out. The diabetic patients were recently diagnosed and had well‐controlled glycemic, BP, and lipid levels and our observations may not apply to patient populations with other characteristics. MRI data were not available in 31 participants (16%), mainly because of missing data in 22 T2DM patients with higher BMI than the T2DM with MRI data. The effect of this selection bias is uncertain. It is very likely that the intensive medical treatment of T2DM patients has affected the carotid atherosclerotic process, thereby diminishing the atherosclerotic effect of T2DM. Hemodynamic and biomechanical stress data were not available and hence their association with plaque data could not be assessed.
Conclusion
Carotid MRI shows increased carotid plaque burden and negative remodeling in patients with T2DM compared with control subjects. Furthermore, obesity was associated with carotid plaque features including increased size of necrotic core and increased calcification. Our results point to the atherogenic effect of the metabolic syndrome, herein T2DM and obesity.
Sources of Funding
This work was supported by research grants from the Novo Nordic Foundation, the A.P. Møller Foundation for the Advancement of Medical Science, the Beckett Foundation, the Aase and Ejnar Danielsen Foundation, and the Health Research Fund of Central Denmark Region.
Disclosures
Bill Kerwin holds stock options in VPDiagnostics. The remaining authors have no disclosures to report.
Supporting information
Table S1. Patient and Control Characteristics in Patients With and Without Carotid Scan Data
Table S2. Association Between Body Mass Index–Group and Carotid Plaque Parameters
(J Am Heart Assoc. 2018;7:e008677 DOI: 10.1161/JAHA.118.008677.)
References
- 1. Luitse MJ, Biessels GJ, Rutten GE, Kappelle LJ. Diabetes, hyperglycaemia, and acute ischaemic stroke. Lancet Neurol. 2012;11:261–271. [DOI] [PubMed] [Google Scholar]
- 2. Townsend N, Nichols M, Scarborough P, Rayner M. Cardiovascular disease in Europe—epidemiological update 2015. Eur Heart J. 2015;36:2696–2705. [DOI] [PubMed] [Google Scholar]
- 3. Schramm TK, Gislason GH, Kober L, Rasmussen S, Rasmussen JN, Abildstrom SZ, Hansen ML, Folke F, Buch P, Madsen M, Vaag A, Torp‐Pedersen C. Diabetes patients requiring glucose‐lowering therapy and nondiabetics with a prior myocardial infarction carry the same cardiovascular risk: a population study of 3.3 million people. Circulation. 2008;117:1945–1954. [DOI] [PubMed] [Google Scholar]
- 4. Yahagi K, Kolodgie FD, Lutter C, Mori H, Romero ME, Finn AV, Virmani R. Pathology of human coronary and carotid artery atherosclerosis and vascular calcification in diabetes mellitus. Arterioscler Thromb Vasc Biol. 2017;37:191–204. [DOI] [PMC free article] [PubMed] [Google Scholar]
- 5. Candemir B, Ertas FS, Ozdol C, Kaya CT, Kilickap M, Akyurek O, Atmaca Y, Kumbasar D, Erol C. Effect of hypertension on coronary remodeling patterns in angiographically normal or minimally atherosclerotic coronary arteries: an intravascular ultrasound study. Clin Exp Hypertens. 2012;34:432–438. [DOI] [PubMed] [Google Scholar]
- 6. Reddy HK, Koshy SK, Wasson S, Quan EE, Pagni S, Roberts AM, Joshua IG, Tyagi SC. Adaptive‐outward and maladaptive‐inward arterial remodeling measured by intravascular ultrasound in hyperhomocysteinemia and diabetes. J Cardiovasc Pharmacol Ther. 2006;11:65–76. [DOI] [PubMed] [Google Scholar]
- 7. Taylor AJ, Burke AP, Farb A, Yousefi P, Malcom GT, Smialek J, Virmani R. Arterial remodeling in the left coronary system: the role of high‐density lipoprotein cholesterol. J Am Coll Cardiol. 1999;34:760–767. [DOI] [PubMed] [Google Scholar]
- 8. O'Leary DH, Polak JF, Kronmal RA, Manolio TA, Burke GL, Wolfson SK Jr. Carotid‐artery intima and media thickness as a risk factor for myocardial infarction and stroke in older adults. Cardiovascular health study collaborative research group. N Engl J Med. 1999;340:14–22. [DOI] [PubMed] [Google Scholar]
- 9. Mathiesen EB, Johnsen SH, Wilsgaard T, Bonaa KH, Lochen ML, Njolstad I. Carotid plaque area and intima‐media thickness in prediction of first‐ever ischemic stroke: a 10‐year follow‐up of 6584 men and women: the Tromso Study. Stroke. 2011;42:972–978. [DOI] [PubMed] [Google Scholar]
- 10. Naghavi M, Libby P, Falk E, Casscells SW, Litovsky S, Rumberger J, Badimon JJ, Stefanadis C, Moreno P, Pasterkamp G, Fayad Z, Stone PH, Waxman S, Raggi P, Madjid M, Zarrabi A, Burke A, Yuan C, Fitzgerald PJ, Siscovick DS, de Korte CL, Aikawa M, Juhani Airaksinen KE, Assmann G, Becker CR, Chesebro JH, Farb A, Galis ZS, Jackson C, Jang IK, Koenig W, Lodder RA, March K, Demirovic J, Navab M, Priori SG, Rekhter MD, Bahr R, Grundy SM, Mehran R, Colombo A, Boerwinkle E, Ballantyne C, Insull W Jr, Schwartz RS, Vogel R, Serruys PW, Hansson GK, Faxon DP, Kaul S, Drexler H, Greenland P, Muller JE, Virmani R, Ridker PM, Zipes DP, Shah PK, Willerson JT. From vulnerable plaque to vulnerable patient: a call for new definitions and risk assessment strategies: part I. Circulation. 2003;108:1664–1672. [DOI] [PubMed] [Google Scholar]
- 11. Wasserman BA, Wityk RJ, Trout HH III, Virmani R. Low‐grade carotid stenosis: looking beyond the lumen with MRI. Stroke. 2005;36:2504–2513. [DOI] [PubMed] [Google Scholar]
- 12. Toussaint JF, LaMuraglia GM, Southern JF, Fuster V, Kantor HL. Magnetic resonance images lipid, fibrous, calcified, hemorrhagic, and thrombotic components of human atherosclerosis in vivo. Circulation. 1996;94:932–938. [DOI] [PubMed] [Google Scholar]
- 13. Yuan C, Beach KW, Smith LH Jr, Hatsukami TS. Measurement of atherosclerotic carotid plaque size in vivo using high resolution magnetic resonance imaging. Circulation. 1998;98:2666–2671. [DOI] [PubMed] [Google Scholar]
- 14. Trivedi RA, U‐King‐Im J, Graves MJ, Horsley J, Goddard M, Kirkpatrick PJ, Gillard JH. Multi‐sequence in vivo MRI can quantify fibrous cap and lipid core components in human carotid atherosclerotic plaques. Eur J Vasc Endovasc Surg. 2004;28:207–213. [DOI] [PubMed] [Google Scholar]
- 15. Cai J, Hatsukami TS, Ferguson MS, Kerwin WS, Saam T, Chu B, Takaya N, Polissar NL, Yuan C. In vivo quantitative measurement of intact fibrous cap and lipid‐rich necrotic core size in atherosclerotic carotid plaque: comparison of high‐resolution, contrast‐enhanced magnetic resonance imaging and histology. Circulation. 2005;112:3437–3444. [DOI] [PubMed] [Google Scholar]
- 16. Saam T, Ferguson MS, Yarnykh VL, Takaya N, Xu D, Polissar NL, Hatsukami TS, Yuan C. Quantitative evaluation of carotid plaque composition by in vivo mri. Arterioscler Thromb Vasc Biol. 2005;25:234–239. [DOI] [PubMed] [Google Scholar]
- 17. Puppini G, Furlan F, Cirota N, Veraldi G, Piubello Q, Montemezzi S, Gortenuti G. Characterisation of carotid atherosclerotic plaque: comparison between magnetic resonance imaging and histology. Radiol Med. 2006;111:921–930. [DOI] [PubMed] [Google Scholar]
- 18. Cappendijk VC, Heeneman S, Kessels AG, Cleutjens KB, Schurink GW, Welten RJ, Mess WH, van Suylen RJ, Leiner T, Daemen MJ, van Engelshoven JM, Kooi ME. Comparison of single‐sequence T1w TFE MRI with multisequence MRI for the quantification of lipid‐rich necrotic core in atherosclerotic plaque. J Magn Reson Imaging. 2008;27:1347–1355. [DOI] [PubMed] [Google Scholar]
- 19. Gupta A, Baradaran H, Schweitzer AD, Kamel H, Pandya A, Delgado D, Dunning A, Mushlin AI, Sanelli PC. Carotid plaque MRI and stroke risk: a systematic review and meta‐analysis. Stroke. 2013;44:3071–3077. [DOI] [PubMed] [Google Scholar]
- 20. Zavodni AE, Wasserman BA, McClelland RL, Gomes AS, Folsom AR, Polak JF, Lima JA, Bluemke DA. Carotid artery plaque morphology and composition in relation to incident cardiovascular events: the multi‐ethnic study of atherosclerosis (MESA). Radiology. 2014;271:381–389. [DOI] [PMC free article] [PubMed] [Google Scholar]
- 21. Laugesen E, Hoyem P, Stausbol‐Gron B, Mikkelsen A, Thrysoe S, Erlandsen M, Christiansen JS, Knudsen ST, Hansen KW, Kim WY, Hansen TK, Poulsen PL. Carotid‐femoral pulse wave velocity is associated with cerebral white matter lesions in type 2 diabetes. Diabetes Care. 2013;36:722–728. [DOI] [PMC free article] [PubMed] [Google Scholar]
- 22. WHO Working Group . Definition, diagnosis and classification of diabetes mellitus and its complications. WHO/NCD/NC8/99.2. Report of a WHO Consultation. 1999.
- 23. Li F, Yarnykh VL, Hatsukami TS, Chu B, Balu N, Wang J, Underhill HR, Zhao X, Smith R, Yuan C. Scan‐rescan reproducibility of carotid atherosclerotic plaque morphology and tissue composition measurements using multicontrast MRI at 3T. J Magn Reson Imaging. 2010;31:168–176. [DOI] [PubMed] [Google Scholar]
- 24. Laugesen E, Hoyem P, Fleischer J, Kumarathas I, Knudsen ST, Hansen KW, Christiansen JS, Hansen TK, Poulsen PL. Reduced subendocardial viability ratio is associated with unfavorable cardiovascular risk profile in women with short duration of type 2 diabetes. Am J Hypertens. 2016;29:1165–1172. [DOI] [PubMed] [Google Scholar]
- 25. Levy JC, Matthews DR, Hermans MP. Correct homeostasis model assessment (HOMA) evaluation uses the computer program. Diabetes Care. 1998;21:2191–2192. [DOI] [PubMed] [Google Scholar]
- 26. Odink AE, van der Lugt A, Hofman A, Hunink MG, Breteler MM, Krestin GP, Witteman JC. Risk factors for coronary, aortic arch and carotid calcification; the Rotterdam Study. J Hum Hypertens. 2010;24:86–92. [DOI] [PubMed] [Google Scholar]
- 27. Spagnoli LG, Mauriello A, Palmieri G, Santeusanio G, Amante A, Taurino M. Relationships between risk factors and morphological patterns of human carotid atherosclerotic plaques. A multivariate discriminant analysis. Atherosclerosis. 1994;108:39–60. [DOI] [PubMed] [Google Scholar]
- 28. Scholtes VP, Peeters W, van Lammeren GW, Howard DP, de Vries JP, de Borst GJ, Redgrave JN, Kemperman H, Schalkwijk CG, den Ruijter HM, de Kleijn DP, Moll FL, Rothwell PM, Pasterkamp G. Type 2 diabetes is not associated with an altered plaque phenotype among patients undergoing carotid revascularization. A histological analysis of 1455 carotid plaques. Atherosclerosis. 2014;235:418–423. [DOI] [PubMed] [Google Scholar]
- 29. Esposito L, Saam T, Heider P, Bockelbrink A, Pelisek J, Sepp D, Feurer R, Winkler C, Liebig T, Holzer K, Pauly O, Sadikovic S, Hemmer B, Poppert H. Mri plaque imaging reveals high‐risk carotid plaques especially in diabetic patients irrespective of the degree of stenosis. BMC Med Imaging. 2010;10:27. [DOI] [PMC free article] [PubMed] [Google Scholar]
- 30. Bianda N, Di Valentino M, Periat D, Segatto JM, Oberson M, Moccetti M, Sudano I, Santini P, Limoni C, Froio A, Stuber M, Corti R, Gallino A, Wyttenbach R. Progression of human carotid and femoral atherosclerosis: a prospective follow‐up study by magnetic resonance vessel wall imaging. Eur Heart J. 2012;33:230–237. [DOI] [PubMed] [Google Scholar]
- 31. Hayashi K, Mani V, Nemade A, Aguiar S, Postley JE, Fuster V, Fayad ZA. Variations in atherosclerosis and remodeling patterns in aorta and carotids. J Cardiovasc Magn Reson. 2010;12:10. [DOI] [PMC free article] [PubMed] [Google Scholar]
- 32. Inaba S, Mintz GS, Farhat NZ, Fajadet J, Dudek D, Marzocchi A, Templin B, Weisz G, Xu K, de Bruyne B, Serruys PW, Stone GW, Maehara A. Impact of positive and negative lesion site remodeling on clinical outcomes: insights from prospect. JACC Cardiovasc Imaging. 2014;7:70–78. [DOI] [PubMed] [Google Scholar]
- 33. Tang TY, Howarth SP, Li ZY, Miller SR, Graves MJ, JM UK‐I, Trivedi RA, Walsh SR, Brown AP, Kirkpatrick PJ, Gaunt ME, Gillard JH. Correlation of carotid atheromatous plaque inflammation with biomechanical stress: utility of USPIO enhanced MR imaging and finite element analysis. Atherosclerosis. 2008;196:879–887. [DOI] [PubMed] [Google Scholar]
- 34. O'Brien KD, Hippe DS, Chen H, Neradilek MB, Probstfield JL, Peck S, Isquith DA, Canton G, Yuan C, Polissar NL, Zhao XQ, Kerwin WS. Longer duration of statin therapy is associated with decreased carotid plaque vascularity by magnetic resonance imaging. Atherosclerosis. 2016;245:74–81. [DOI] [PMC free article] [PubMed] [Google Scholar]
- 35. Charakida M, Khan T, Johnson W, Finer N, Woodside J, Whincup PH, Sattar N, Kuh D, Hardy R, Deanfield J. Lifelong patterns of BMI and cardiovascular phenotype in individuals aged 60–64 years in the 1946 British birth cohort study: an epidemiological study. Lancet Diabetes Endocrinol. 2014;2:648–654. [DOI] [PubMed] [Google Scholar]
- 36. Lorenz MW, Markus HS, Bots ML, Rosvall M, Sitzer M. Prediction of clinical cardiovascular events with carotid intima‐media thickness: a systematic review and meta‐analysis. Circulation. 2007;115:459–467. [DOI] [PubMed] [Google Scholar]
- 37. Grundy SM, Brewer HB Jr, Cleeman JI, Smith SC Jr, Lenfant C; American Heart Association; National Heart, Lung, and Blood Institute . Definition of metabolic syndrome: report of the National Heart, Lung, and Blood Institute/American Heart Association conference on scientific issues related to definition. Circulation. 2004;109:433–438. [DOI] [PubMed] [Google Scholar]
- 38. Bogers RP, Bemelmans WJ, Hoogenveen RT, Boshuizen HC, Woodward M, Knekt P, van Dam RM, Hu FB, Visscher TL, Menotti A, Thorpe RJ Jr, Jamrozik K, Calling S, Strand BH, Shipley MJ; BMI‐CHD Collaboration Investigators . Association of overweight with increased risk of coronary heart disease partly independent of blood pressure and cholesterol levels: a meta‐analysis of 21 cohort studies including more than 300 000 persons. Arch Intern Med. 2007;167:1720–1728. [DOI] [PubMed] [Google Scholar]
- 39. Atlas Writing G, Timmis A, Townsend N, Gale C, Grobbee R, Maniadakis N, Flather M, Wilkins E, Wright L, Vos R, Bax J, Blum M, Pinto F, Vardas P; Atlas Writing G . European society of cardiology: cardiovascular disease statistics 2017. Eur Heart J. 2017;39:508–579. [DOI] [PubMed] [Google Scholar]
Associated Data
This section collects any data citations, data availability statements, or supplementary materials included in this article.
Supplementary Materials
Table S1. Patient and Control Characteristics in Patients With and Without Carotid Scan Data
Table S2. Association Between Body Mass Index–Group and Carotid Plaque Parameters