

Abstract
Background
Cognitive impairment may increase the risk of all‐cause and cardiovascular disease (CVD) mortality. This study examined the association between cognitive function and risk of all‐cause and CVD mortality among the elderly in Beijing, China.
Methods and Results
A total of 1996 participants aged ≥55 years at baseline were enrolled from the BLSA (Beijing Longitudinal Study of Aging). Cognitive function was assessed using the Mini‐Mental State Examination (MMSE), and participants were categorized as: <18, 18 to 23, 24 to 27, and 28 to 30. Cox proportional hazard models were used to estimate the association. Hazard ratio (HR) and 95% confidence interval (CI) were reported. During a 20‐year follow‐up, 1122 (56.21%) participants died, 478 (42.60%) of whom died of CVD. Compared with MMSE scores of 28 to 30, participants with MMSE scores of <18 were independently associated with all‐cause mortality (hazard ratio, 2.14; 95% confidence interval, 1.59–2.87; P<0.001) and CVD mortality (hazard ratio, 4.52; 95% confidence interval, 2.80–7.30, P<0.001). Each 5‐point decrease in MMSE score was associated with a 34% increased risk of all‐cause mortality and a 56% increased risk of CVD mortality. This relationship remained statistically significant after using the competing risk model to consider non‐CVD death as a competing risk event.
Conclusion
Cognitive impairment measured by MMSE score was associated with elevated risk of all‐cause and CVD mortality among the elderly in Beijing, China.
Keywords: cardiovascular disease, cognition, elderly, Mini‐Mental State Examination, mortality
Subject Categories: Mortality/Survival, Cardiovascular Disease, Aging
Clinical Perspective
What Is New?
Baseline cognitive impairment measured by the Mini‐Mental State Examination was associated with an increased risk of all‐cause and cardiovascular disease mortality among community‐dwelling older Chinese people.
The relationship between cognitive impairment and cardiovascular disease mortality were robust after using the competing risk model considering non–cardiovascular disease death as a competing event rather than censors.
What Are the Clinical Implications?
Screening for cognitive impairment by using the Mini‐Mental State Examination has important value in predicting risk of all‐cause and cardiovascular disease mortality in the elderly population.
Introduction
Cognitive impairment is a serious threat to health of the elderly in the context of the demographic aging process. It imposes a significant public health burden and shortens the survival of patients, especially in China, which is experiencing the fastest growth in the elderly population.1 The number of deaths attributable to dementia in China went up from 1.6 million in 1990 to 2.3 million in 2016.2 Most recent epidemiological studies have reported an association between cognitive impairment and increased risk of all‐cause mortality, with both mild and moderate‐to‐severe cognitive impairment being predictors of all‐cause mortality in older adults.3, 4 However, to our knowledge, very few studies have examined this relationship in China.5, 6 Analysis of the association between cognitive impairment and mortality in China is thus worthy of further research.
Cognitive impairment has also been shown to be related to cardiovascular disease (CVD). Cognitive impairment predicts CVD events independently in addition to traditional risk factors, such as hypertension, smoking, diabetes mellitus, lipid abnormality, increasing age, overweight, and obesity.7, 8 Several risk factors for CVD are also risk factors for cognitive impairment.9 Patients with cognitive impairment have the reduced ability to maintain medication adherence and carry out self‐care, thus increasing the risk of CVD.10, 11 However, the association between cognitive impairment and mortality resulting from CVD is less clear. Previous studies demonstrated that the baseline Mini‐Mental State Examination (MMSE) score was a significant predictor of CVD mortality.12, 13, 14 Furthermore, a recent observational cohort study among nondemented older adults indicated that the association between low cognitive function test scores and increased mortality appeared to be particularly strong for death from CVD.15 Nevertheless, another study reported that mild cognitive impairment showed no significant correlation with cardiovascular mortality when tested in a multivariable model.16 To date therefore the results have been inconsistent, and other possible confounding factors unreported by previous studies require further exploration.
The aim of the present study was to determine the association between cognitive impairment as assessed by the MMSE and risk of all‐cause and CVD mortality among a general population aged ≥55 years in Beijing, China.
Methods
Data Collection and Study Population
Data, analytical methods, and study materials will not be made available to other researchers for purposes of reproducing the results or replicating the procedure. This secondary analysis used data from the BLSA (Beijing Longitudinal Study of Aging), a community‐based prospective cohort study of 3257 Chinese people aged ≥55 years at baseline conducted by the Beijing Geriatric Clinical and Research Center, Xuanwu Hospital of Capital Medical University (Beijing, China). The representative cohort of the elderly population in Beijing was based on a 3‐stage stratified random‐clustering sampling procedure.17 Three districts representing the urban, suburban, and rural areas of Beijing were selected to constitute the BLSA sample. Around 10% of sampling data, including the distribution of geography, age, and education of the study sample, were obtained from the Fourth National Census Data.18 Follow‐up data from this cohort were based on self‐reporting information covering demographic characteristics, socioeconomic status, functional abilities, lifestyle factors, medications, physical health including diseases, psychological health, and cognitive status (eg, the MMSE).19
Because of missing data, a total of 1996 participants (978 men and 1018 women) followed up from 1992 to 2012 were finally recruited for the analysis, and the self‐reported information was compiled every 2 to 3 years. Written informed consent was obtained from all participants, and ethics approval was provided by the ethics committee of Xuanwu Hospital, Capital Medical University.
Outcome Measures
The main outcome was death from all causes and CVD occurring between August 1992 and December 2012. Death from CVD was classified according to the ninth or tenth International Classification of Disease (ICD‐9 or ICD‐10). Survival status was obtained from interviews with family members or relatives when family members were unavailable. The information was verified by household registration records and death records. For the final analysis, non‐CVD death was considered as a competing event.
Assessment of Cognitive Function
Cognitive function was assessed using the MMSE, a widely used screening test. MMSE score ranges from 0 to 30 and consists of different cognitive domains, with a higher MMSE score indicating better cognitive function. Baseline MMSE scores were categorized into 4 groups: <18, 18 to 23, 24 to 27, and 28 to 30 (reference). The standard cut‐off score of ≥28 is generally considered normal cognition, and scores of <24 and <18 were used to identify individuals with suspected mild cognitive impairment and severe cognitive impairment.9, 14 Education adjusted MMSE cut‐off scores were also used to classify participants as cognitively impaired or unimpaired. Cut‐off scores were 25 for uneducated participants, 27 for those with primary school education levels, and 29 for participants with secondary school or above education levels.20
Assessment of Potential Confounding Variables
At baseline, variables, including demographics characteristics, lifestyle factors, heath conditions, and medication, were collected using a face‐to‐face standardized questionnaire by trained researchers (mainly by physicians or nurses). Detailed measurement and classification of each variable have been reported in previous studies.17 Education level was categorized as uneducated, primary school graduates (≥6 years of education), and secondary school graduates and above (≥9 years of education). Participants were classified as a frequent exercise group if they self‐reported exercising almost every day. Marital status was divided into 2 groups: married and single. The single group included separated, widowed, divorced, and those who remained unmarried. Region was categorized as: rural, suburban, and urban. Both cigarette smoking status and alcohol consumption were assessed using questions and were divided into 3 categories: never, former, and current.
According to height and weight of participants, body mass index was calculated as weight in kilograms divided by the square of height in meters (kg/m2). Physical impairment was assessed using the Activities of Daily Living and Instrumental Activities of Daily Living.18 Participants were divided into complete ability or disability group based on Activities of Daily Living ADL and Basic Activities of Daily Living, respectively. We measured depressive symptoms using the 20‐item version of the Centre for Epidemiological Studies Depression Scale.
Blood pressure was measured twice on the right arm in a sitting position by a trained nurse, with at least a 5‐minute interval. All blood samples were collected after overnight fasting for at least 12 hours. Fasting plasma glucose, total cholesterol, high‐density lipoprotein cholesterol, and low‐density lipoprotein cholesterol were measured. Hypertension was defined as systolic BP ≥140 mm Hg or diastolic BP ≥90 mm Hg or regular use of antihypertensive medication. Diabetes mellitus was defined as an fasting plasma glucose level ≥7.0 mmol/L or regular use of antidiabetic drugs. Dyslipidemia was diagnosed as a serum total cholesterol level ≥5.17 mmol/L, or low‐density lipoprotein cholesterol ≥3.62 mmol/L, or high‐density lipoprotein cholesterol ≤1.04 mmol/L, or regular use of antihyperlipidemia medications. Hypertension, diabetes mellitus, and dyslipidemia were also identified according to a self‐reported history of diagnosis. Medical history of CVD, chronic obstructive pulmonary disease, and arthritis were determined by using a physician‐based questionnaire. Medication was obtained directly from prescription bottles.
Statistical Analysis
We divided participants into 4 groups according to the conventional MMSE cut‐off values. Mean±SD was calculated for continuous variables and frequency (percentage) for categorical variables. Comparisons between participants in different MMSE score categories were performed using ANOVA for continuous variables and the χ2 test for categorical variables. Kaplan–Meier curves were generated to plot the unadjusted survival estimates according to baseline MMSE category, and the log‐rank test was used to compare survival curves.
We used Cox proportional hazard models to estimate the association between MMSE score and risk of all‐cause and CVD mortality. The group with an MMSE of 28 to 30 was used as the reference category in the Cox regression models. Hazard ratio (HR) and 95% confidence interval (CI) were reported. Several models were built: Model 1 was an unadjusted model; model 2 was adjusted for age and sex; model 3 was adjusted for the covariates in model 2 adding exercise, alcohol consumption, smoking status, education level, marital status, and region; and model 4 was adjusted for the covariates in model 3 adding body mass index, physical impairment, depression, medical history (CVD, hypertension, diabetes mellitus, dyslipidemia, chronic obstructive pulmonary disease, and arthropathy), and medications (for CVD, chronic obstructive pulmonary disease, and analgesics). We also estimated risk of all‐cause and CVD mortality associated with the MMSE score per 5‐unit change in the above 4 Cox proportional hazard models. According to past knowledge, age and sex were important risk factors in the relationship between cognitive function and mortality.15 Therefore, subgroup analysis was performed by stratifying the study participants according to age (<65 and ≥65) and sex (male and female) in the fully adjusted model to explore whether male and female and younger and older individuals differ in the relationship. Interactions between baseline MMSE and subgroup variables were tested. Additionally, sensitivity analysis was conducted by using the competing risk model. We utilized the multivariable model to adjust for the risk estimates of non‐CVD death as a competing risk. To further confirm the stability of results, we used education‐adjusted MMSE cut points (25, 27, and 29 for participants with uneducated, primary school, and secondary school or above education levels) to evaluate the relationship between cognitive impairment and risk of all‐cause and CVD mortality, adjusted for all covariates.20 We also assessed the association between MMSE scores and risk of all‐cause and CVD mortality in people without history of CVD in order to reduce the potential bias for CVD mortality. Data analysis was conducted using SAS software (version 9.4; SAS Institute, Cary, NC). All statistical tests were 2‐sided, and P values <0.05 were considered statistically significant.
Results
Baseline Characteristics
In the current analysis, 1996 participants (978 men and 1018 women) who completed the baseline MMSE were enrolled during a median follow‐up period of 8.00 years (interquartile range, 5.00–14.65). Mean age (SD) of the population was 69.02±8.47 years. Median MMSE score was 24 (interquartile range, 21–26) and ranged from 3 to 30. Participants with reduced MMSE were older, more women than men; had a lower proportion of receiving education; were less likely to marry, exercise, and live in an urban area; had a lower baseline body mass index and lower rates of CVD; had higher rates of physical impairment, depression, and hypertension; and were less likely to use CVD medications (Table 1).
Table 1.
Baseline Characteristics of the Study Population
| Characteristic | Baseline MMSE Score | P Value | |||
|---|---|---|---|---|---|
| <18 | 18 to 23 | 24 to 27 | 28 to 30 | ||
| No. of subjects | 193 | 772 | 710 | 321 | ··· |
| Age (mean; SD), y | 75.45 (8.28) | 70.25 (8.05) | 67.40 (8.29) | 65.79 (7.24) | <0.001 |
| BMI (mean; SD), kg/m2 | 22.30 (4.09) | 22.78 (4.01) | 23.63 (3.93) | 24.42 (3.66) | <0.001 |
| Female, n (%) | 158 (81.87) | 479 (62.05) | 280 (39.44) | 101 (31.46) | <0.001 |
| Education level, n (%) | <0.001 | ||||
| Uneducated | 185 (95.85) | 595 (77.07) | 230 (32.39) | 32 (9.97) | |
| Primary school | 7 (3.63) | 150 (19.43) | 308 (43.38) | 106 (33.02) | |
| Secondary school or above | 1 (0.52) | 27 (3.50) | 172 (24.23) | 183 (57.01) | |
| Frequent exercise, n (%) | 83 (43.01) | 426 (55.18) | 454 (63.94) | 223 (69.47) | <0.001 |
| Married, n (%) | 82 (42.49) | 447 (57.90) | 545 (76.76) | 268 (83.49) | <0.001 |
| Region, n (%) | <0.001 | ||||
| Rural | 56 (29.02) | 147 (19.04) | 76 (10.70) | 14 (4.36) | |
| Suburban | 69 (35.75) | 268 (34.72) | 151 (21.27) | 32 (9.97) | |
| Urban | 68 (35.23) | 357 (46.24) | 483 (68.03) | 275 (85.67) | |
| Smoking status, n (%) | <0.001 | ||||
| Never | 136 (70.47) | 448 (58.03) | 329 (46.34) | 170 (52.96) | |
| Former | 25 (12.95) | 104 (13.47) | 136 (19.15) | 58 (18.07) | |
| Current | 32 (16.58) | 220 (28.50) | 245 (34.51) | 93 (28.97) | |
| Alcohol consumption, n (%) | <0.001 | ||||
| Never | 154 (79.79) | 562 (72.80) | 461 (64.93) | 218 (67.91) | |
| Former | 11 (5.70) | 66 (8.55) | 55 (7.75) | 29 (9.03) | |
| Current | 28 (14.51) | 144 (18.65) | 194 (27.32) | 74 (23.05) | |
| Depression, n (%) | 48 (25.13) | 171 (22.24) | 105 (14.85) | 35 (10.90) | <0.001 |
| Physical impairment | |||||
| IADL, n (%) | 114 (59.07) | 280 (36.27) | 96 (13.52) | 29 (9.03) | <0.001 |
| ADL, n (%) | 19 (9.84) | 44 (5.70) | 11 (1.55) | 2 (0.62) | <0.001 |
| Medical history | |||||
| CVD, n (%) | 30 (15.54) | 141 (18.26) | 142 (20.00) | 84 (26.17) | 0.009 |
| Hypertension, n (%) | 134 (69.43) | 506 (65.54) | 425 (59.86) | 187 (58.26) | 0.009 |
| Diabetes mellitus, n (%) | 19 (9.84) | 92 (11.92) | 81 (11.41) | 43 (13.40) | 0.657 |
| Dyslipidemia, n (%) | 135 (69.95) | 453 (58.68) | 438 (61.69) | 211 (65.73) | 0.013 |
| COPD, n (%) | 18 (9.33) | 94 (12.18) | 98 (13.80) | 44 (13.71) | 0.356 |
| Arthritis, n (%) | 14 (7.25) | 50 (6.48) | 48 (6.76) | 17 (5.30) | 0.795 |
| Medications | |||||
| CVD, n (%) | 21 (10.88) | 101 (13.08) | 102 (14.37) | 70 (21.81) | 0.001 |
| COPD, n (%) | 16 (8.29) | 74 (9.59) | 57 (8.03) | 22 (6.85) | 0.474 |
| Analgesics, n (%) | 19 (9.84) | 80 (10.36) | 60 (8.45) | 13 (4.05) | 0.008 |
ADL indicates Activities of Daily Living; BMI, body mass index; COPD, chronic obstructive pulmonary disease; CVD, cardiovascular disease; IADL, Instrumental Activities of Daily Living; MMSE, Mini‐Mental State Examination.
MMSE and All‐Cause Mortality
On follow‐up, a total of 1122 (56.21%) participants died of any cause among the overall study population (Table 2). Figure 1 shows the Kaplan–Meier unadjusted survival estimates for different MMSE categories. A log‐rank test revealed a significant difference in the 4 groups (χ2=202.10; P<0.001). All‐cause mortality risk was elevated in parallel with a decrease in MMSE (Table 2). In the univariate Cox model, participants with reduced MMSE scores showed a graded increased risk of all‐cause mortality compared with MMSE scores of 28 to 30 (MMSE <18 [unadjusted HR, 3.73; 95% CI, 2.95–4.71; P<0.001]). After accounting for age and sex (model 2), demographic characteristics, and lifestyle factors (model 3), we found similar associations between MMSE score and risk of all‐cause mortality. In the fully adjusted multivariable model, with further adjustment for functional abilities, physical health, and medications, participants with MMSE scores of 24 to 27 (HR, 1.12; 95% CI, 0.90–1.38; P=0.322), 18 to 23 (HR, 1.44; 95% CI, 1.14–1.83; P=0.003), and <18 (HR, 2.14; 95% CI, 1.59–2.87; P<0.001) also had a graded all‐cause mortality risk compared with MMSE scores of 28 to 30. We also discovered that each 5‐point decrease in MMSE score was associated with a 34% increased risk of mortality in the fully adjusted model (Table 2).
Table 2.
Hazard Ratios (95% CI) for All‐Cause and Cardiovascular Disease Mortality According to Baseline MMSE Score (n=1996)
| MMSE Score | Participants (No.) | Death (No.), n (%) | Hazard Ratio (95% CI)a | |||
|---|---|---|---|---|---|---|
| Model 1b | Model 2c | Model 3d | Model 4e | |||
| All‐cause mortality | ||||||
| Decreased by 5 points | 1996 | 1122 (56.21) | 1.69 (1.58–1.81)f | 1.50 (1.39–1.62) | 1.38 (1.26–1.52)f | 1.34 (1.22–1.47)f |
| MMSE <18 | 193 | 130 (40.50) | 3.73 (2.95–4.71)f | 2.77 (2.14–3.58)f | 2.16 (1.61–2.89)f | 2.14 (1.59–2.87)f |
| MMSE 18 to 23 | 772 | 327 (46.06) | 2.04 (1.68–2.47)f | 1.84 (1.50–2.24)f | 1.49 (1.17–1.88)g | 1.44 (1.14–1.83)g |
| MMSE 24 to 27 | 710 | 509 (65.93) | 1.20 (0.98–1.47) | 1.20 (0.98–1.47) | 1.07 (0.86–1.33) | 1.12 (0.90–1.38) |
| MMSE 28 to 30 | 321 | 156 (80.83) | 1 (Reference) | 1 (Reference) | 1 (Reference) | 1 (Reference) |
| Cardiovascular disease mortality | ||||||
| Decreased by 5 points | 1996 | 478 (23.95) | 1.84 (1.67–2.04)f | 1.81 (1.61–2.03)f | 1.59 (1.39–1.82)f | 1.56 (1.36–1.79)f |
| MMSE <18 | 193 | 38 (11.84) | 6.22 (4.22–9.17)f | 5.98 (3.93–9.10)f | 4.37 (2.72–7.01)f | 4.52 (2.80–7.30)f |
| MMSE 18 to 23 | 772 | 135 (19.01) | 3.06 (2.17–4.31)f | 3.13 (2.20–4.46)f | 2.51 (1.68–3.76)f | 2.54 (1.69–3.82)f |
| MMSE 24 to 27 | 710 | 226 (29.27) | 1.69 (1.18–2.42)g | 1.72 (1.20–2.47)g | 1.56 (1.07–2.28)g | 1.67 (1.15–2.44)g |
| MMSE 28 to 30 | 321 | 79 (40.93) | 1 (Reference) | 1 (Reference) | 1 (Reference) | 1 (Reference) |
CI indicates confidence interval; MMSE, Mini‐Mental State Examination.
Hazard ratio (95% CI) was calculated from Cox models.
Unadjusted model.
Age‐ and sex‐adjusted model.
Adjusted for age, sex, exercise, alcohol consumption, smoking status, education level, marital status, and region.
Adjusted for age, sex, exercise, alcohol consumption, smoking status, education level, marital status, region, body mass index (BMI), physical impairment, depression, medical history (cardiovascular disease [CVD], hypertension, diabetes mellitus, dyslipidemia, chronic obstructive pulmonary disease [COPD], arthropathy), and medications (for CVD, COPD, and analgesics).
P<0.001.
P<0.05.
Figure 1.
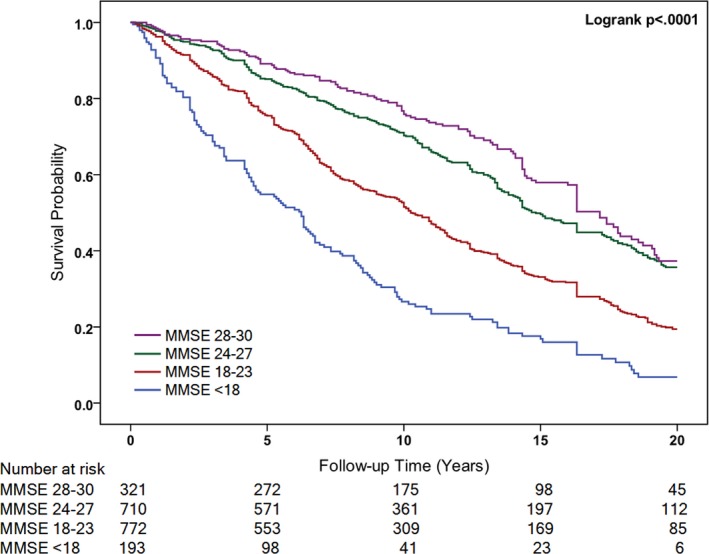
Kaplan–Meier Curve for hazard of all‐cause death by the baseline Mini‐Mental State Examination (MMSE) score.
MMSE and Cardiovascular Disease Mortality
During a 20‐year follow‐up, 478 (42.60%) of the 1122 (56.21%) documented deaths were attributed to CVD (Table 2). Figure 2 shows the Kaplan–Meier unadjusted survival estimates for different MMSE categories. A log‐rank test revealed a significant difference in the 4 groups (χ2=140.36; P<0.001). CVD mortality risk was also elevated in relation to cognitive decline (Table 2). In the univariate Cox model, participants with reduced MMSE scores showed a graded increased risk of CVD mortality compared with MMSE scores of 28 to 30 (MMSE <18 [unadjusted HR, 6.22; 95% CI, 4.22–9.17; P<0.001]). After accounting for age and sex (model 2), demographic characteristics, and lifestyle factors (model 3), similar associations were found between MMSE score and risk of CVD mortality. In a fully adjusted model, participants with MMSE scores of 24 to 27 (HR, 1.67; 95% CI, 1.15–2.44; P=0.008), 18 to 23 (HR, 2.54; 95% CI, 1.69–3.82; P<0.001), and <18 (HR, 4.52; 95% CI, 2.80–7.30; P<0.001) had a graded increase in risk of CVD mortality compared with MMSE scores of 28 to 30. We also investigated each 5‐point decrease in MMSE score, which was associated with a 56% increased risk of CVD mortality in the fully adjusted model (Table 2).
Figure 2.
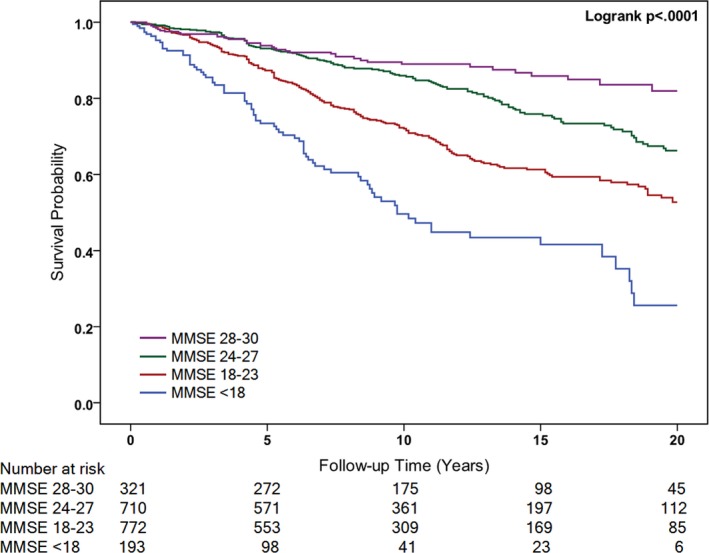
Kaplan–Meier Curve for hazard of CVD death by the baseline Mini‐Mental State Examination (MMSE) score. CVD indicates cardiovascular disease.
Subgroup Analysis
Subgroup analysis was followed by stratification of the population by age and sex. The reduced baseline MMSE score associated with increased risk of all‐cause and CVD mortality was similar in those younger or older than 65 years, whether male or female. The analysis stratified by age revealed that compared with MMSE scores of 28 to 30, participants aged ≥65 years in the lowest MMSE group had a 2.96‐fold (95% CI, 2.12–4.15) greater risk of all‐cause mortality and a 4.73‐fold (95% CI, 2.74–8.16) greater risk of CVD mortality. Furthermore, participants aged <65 years in the lowest MMSE group had a 1.73‐fold (95% CI, 0.83–3.60) greater risk of all‐cause mortality and a 7.16‐fold (95% CI, 2.47–20.76) greater risk of CVD mortality (Table 3). We did not find a significant interaction between MMSE scores and age for both all‐cause and CVD mortality (P>0.05 for interaction; Table 3).
Table 3.
Hazard Ratios (95% CI) of All‐Cause and CVD Mortality Stratified Analysis by Age (Dichotomized Into <65 and ≥65 Years)
| MMSE Score | Age <65 (n=701) | Age ≥65 (n=1295) | P for Interaction | ||
|---|---|---|---|---|---|
| No. | Hazard Ratio (95% CI) | No. | Hazard Ratio (95% CI) | ||
| All‐cause mortality | 0.453 | ||||
| MMSE <18 | 25 | 1.73 (0.83–3.60) | 168 | 2.96 (2.12–4.15)a | |
| MMSE 18 to 23 | 208 | 1.27 (0.81–2.01) | 564 | 1.67 (1.26–2.22)a | |
| MMSE 24 to 27 | 315 | 0.86 (0.58–1.28) | 395 | 1.33 (1.02–1.73)b | |
| MMSE 28 to 30 | 153 | 1 (Reference) | 168 | 1 (Reference) | |
| CVD mortality | 0.587 | ||||
| MMSE <18 | 25 | 7.16 (2.47–20.76)b | 168 | 4.73 (2.74–8.16)a | |
| MMSE 18 to 23 | 208 | 3.13 (1.34–7.29)b | 564 | 2.47 (1.54–3.96)a | |
| MMSE 24 to 27 | 315 | 2.10 (0.96–4.59) | 395 | 1.57 (1.01–2.45)b | |
| MMSE 28 to 30 | 153 | 1 (Reference) | 168 | 1 (Reference) | |
Adjusted for sex, exercise, alcohol consumption, smoking status, education level, marital status, region, body mass index, physical impairment, depression, medical history, and medications by multivariate Cox models. CVD indicates cardiovascular disease; CI, confidence interval; MMSE, Mini‐Mental State Examination.
P<0.001.
P<0.05.
The analysis stratified by sex revealed that male subjects in the lowest MMSE group versus the highest MMSE group were associated with a 2.96‐fold (95% CI, 1.84–4.75) greater risk of all‐cause mortality and a 5.03‐fold (95% CI, 2.51–10.06) greater risk of CVD mortality. Furthermore, female subjects in the lowest MMSE group versus the highest MMSE group had a 1.44‐fold (95% CI, 0.86–2.40) greater risk of all‐cause mortality and a 5.62‐fold (95% CI, 1.97–16.00) greater risk of CVD mortality (Table 4). In addition, sex was a significant (P=0.037 for interaction) modifier of the association between MMSE scores and all‐cause mortality (Table 4).
Table 4.
Hazard Ratios (95% CI) of All‐Cause and CVD Mortality Stratified Analysis by Sex
| MMSE Score | Female (n=1018) | Male (n=978) | P for Interaction | ||
|---|---|---|---|---|---|
| No. | Hazard Ratio (95% CI) | No. | Hazard Ratio (95% CI) | ||
| All‐cause mortality | 0.037 | ||||
| MMSE <18 | 158 | 1.44 (0.86–2.40) | 35 | 2.96 (1.84–4.75)a | |
| MMSE 18 to 23 | 479 | 1.04 (0.65–1.67) | 293 | 1.57 (1.18–2.09)b | |
| MMSE 24 to 27 | 280 | 0.81 (0.52–1.26) | 430 | 1.21 (0.94–1.56) | |
| MMSE 28 to 30 | 101 | 1 (Reference) | 220 | 1 (Reference) | |
| CVD mortality | 0.141 | ||||
| MMSE <18 | 158 | 5.62 (1.97–16.00)b | 35 | 5.03 (2.51–10.06)a | |
| MMSE 18 to 23 | 479 | 3.22 (1.17–8.82)b | 293 | 2.57 (1.62–4.07)a | |
| MMSE 24 to 27 | 280 | 2.74 (1.03–7.27)b | 430 | 1.44 (0.94–2.18) | |
| MMSE 28 to 30 | 101 | 1 (Reference) | 220 | 1 (Reference) | |
Adjusted for age, exercise, alcohol consumption, smoking status, education level, marital status, region, body mass index, physical impairment, depression, medical history and medications by multivariate Cox models. CVD indicates cardiovascular disease; CI, confidence interval; MMSE, Mini‐Mental State Examination.
P<0.001.
P<0.05.
Sensitivity Analysis
By using the competing risk model, each 5‐point decrease in baseline MMSE score was associated with a 36% increased risk of CVD mortality (HR, 1.36; 95% CI, 1.18–1.57). In the fully adjusted multivariable analysis, the association between participants with MMSE scores of 24 to 27 (HR, 1.56; 95% CI, 1.08–2.26), 18 to 23 (HR, 2.32; 95% CI, 1.56–3.44), and <18 (HR, 3.34; 95% CI, 2.07–5.40) and a graded increase in the risk of CVD mortality was statistically significant (Figure 3).
Figure 3.
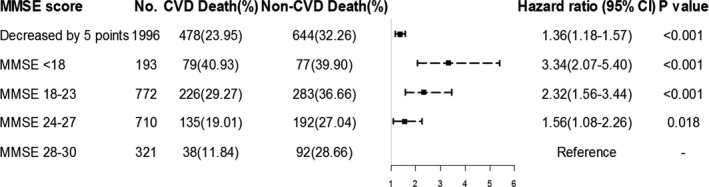
Hazard ratios (95% CI) for cardiovascular disease (CVD) mortality according to baseline Mini‐Mental State Examination (MMSE) score, using competing risks models adjusted for age, sex, exercise, alcohol consumption, smoking status, education level, marital status, region, body mass index (BMI), physical impairment, depression, medical history, and medications. CI indicates confidence interval.
Moreover, after using education adjusted MMSE scores to derive groups, participants with cognitive impairment was associated with a 61% increased risk of CVD mortality (HR, 1.61; 95% CI, 1.23–2.10) compared with cognitively normal participants (Table S1). In addition, the sample size was limited to 1599 after excluding participants with history of CVD. Baseline MMSE scores of <18 was also associated with a 2.20‐fold (95% CI, 1.57–3.07) greater risk of all‐cause mortality and a 5.02‐fold (95% CI, 2.80–8.98) greater risk of CVD mortality compared with MMSE of 28 to 30 among participants without CVD at baseline (Table S2).
Discussion
The present study showed that baseline cognitive impairment measured by MMSE score was associated with an elevated risk of all‐cause and CVD mortality among a population of the BLSA. Moreover, the association between MMSE score and risk of CVD mortality remained highly significant in the competing risk model in fully multivariable analysis.
Most recent population‐based epidemiological studies have extensively reported a consistent association between cognitive impairment and increased risk of all‐cause mortality in the elderly, and MMSE score as a common measure of cognitive impairment has been a powerful and independent predictor of all‐cause mortality.4, 7, 16, 21 To the best of our knowledge, only 2 studies have examined the relationship between baseline cognitive function and mortality in China.5, 6 Gao et al indicated that baseline cognitive function assessed by composite cognitive z‐score predicts future mortality incidence among a rural Chinese cohort aged ≥65 years.6 An and Liu showed that baseline cognitive impairment measured using the MMSE was inversely associated with longevity, although the population was confined to the oldest Chinese aged ≥80 years.5 The results of our study are consistent with the findings from previous literature, given that we found that impairment in cognitive function increased the risk of all‐cause death over a 20‐year follow‐up in a population aged ≥55 years in Beijing.
Recent studies reported the relationship between cognitive impairment and CVD. Indeed, it has been suggested that cognitive impairment provides predictive value for CVD, although the underlying pathological mechanisms of any correlations are less clear.7, 8 The accumulating evidence in support of the association between cognitive impairment and CVD led to formulation of the hypothesis that MMSE score might also provide additional predictive value for CVD mortality.16 In addition, based on the results of the association between cognitive impairment and mortality risk, some investigators assessed the association with cause‐specific mortality, and 1 study showed that the association of low cognitive function with increased mortality appeared to be particularly strong for death from CVD.15 Nevertheless, available data from previous studies on the association between cognitive impairment and CVD mortality in the elderly are controversial. Several recent studies have suggested that worse cognitive function, as measured by various cognitive tests, is related to the risk of CVD mortality.12, 13, 15 Regarding the use of the MMSE to assess cognitive function, an analysis of the ONTARGET (ONgoing Telmisartan Alone and in Combination With Ramipril … Alone and combination with Ramipril global Endpoint trial) and TRANSCEND (Telmisartan Random‐ ized Assessment Study in ACE‐Intolerant Subjects with Cardiovascular Disease) trials reported that baseline MMSE score was a significant predictor of cardiovascular mortality among the population of patients at high risk for CVD.7 However, a previous study demonstrated that mild cognitive impairment was associated with cardiovascular mortality only when studied separately or in a sex‐ and age‐adjusted model, whereas in a multivariable model the MMSE score lost its significance.16 Our findings were coincident with the relationship in the unadjusted model and sex‐ and age‐adjusted model, but in multivariable models, which have not generally been related to cognitive impairment, findings were discrepant: Cognitive impairment was associated with risk of CVD mortality. Finally, after using the competing risk model that considers non‐CVD death as competing events or excluding those participants with a history of CVD, the relationship between reduced MMSE score and increased CVD mortality risk was still statistically significant, although further research to confirm the stability of these results is warranted.
According to our findings, the association of participants with MMSE scores of 24 to 27 was not statistically significant for all‐cause mortality given that this MMSE category was expected to be close to normal status. However, baseline MMSE had a strong and significant association with CVD mortality in this population. Our study examined the relationship in community‐dwelling older Chinese people from the BLSA, who were recruited in 1992. Because of the cultural background, more than 50% of the participants had less than 6 years of formal education. Cultural background had an influence on MMSE performance, and education is closely related to cultural background.22 MMSE scores generally decline with advancing age and can be biased by baseline educational level and language.23 Therefore, study sample in BLSA, which comprised a more‐uneducated elderly population than previous studies, may contribute to the strong association of MMSE and CVD mortality risk. Additionally, the relationship between early cognitive impairment assessed by education‐adjusted MMSE cut point remained statistically significant and further confirmed the stability of our results.
To reduce the possibility that observed associations were confounded, we added variables that have been previously reported to be confounding factors into the regression model. In our analysis, we adjusted for age and sex in model 2 and demographic characteristics and lifestyle in model 3 because these factors were common potential confounders between cognitive function and mortality risk.7, 12 In addition to common factors, we were able to adjust for physical health and medications in model 4 that may also confound the relationship. These variables have been shown to increase the risk of CVD or mortality risk and were associated with cognitive impairment.24 Furthermore, previous studies reported that depression often coexisted with cognitive impairment among elderly individuals and appeared to increase all‐cause as well as cardiovascular mortality.14 Therefore, we also evaluated the influence of depressive symptoms in model 4. With reduced MMSE scores at baseline, most confounding factors were more prevalent in participants and adjustment for them might also play a role in the downward trend from model 1 to model 4. Whereas adjustment for age, sex, physical impairment, depression, medical history, and medications had only a very modest influence on the magnitude of the HR, in model 3 we found a more‐obvious attenuation of the magnitude of association between baseline MMSE score and mortality after adding education, marital status, region, and lifestyle factors to the models.
The findings of previous studies on sex differences between cognitive function and mortality have been inconsistent.5, 15, 25 Perna et al showed that the association between low COGTEL (Cognitive Telephone Screening Instrument) total scores and all‐cause mortality was much stronger among men than in women.15 Another study using the same cognitive testing revealed a contrasting pattern: The researchers found no evidence of differential impact of baseline cognitive impairment on mortality between sexes, although the cohort consisted of the oldest‐old Chinese.5 In the present study, we found that males with reduced MMSE score had a higher risk of all‐cause mortality than females, and there was an interaction between sex and all‐cause mortality (P=0.037 for interaction). This may be attributed to more‐traditional lifestyle risk factors among men than women, such as smoking, drinking, and physical inactivity, which contribute to both cognitive impairment and all‐cause mortality.26 However, women were more sensitive to the relationship between MMSE and CVD mortality. This may be caused by particularity of women. Elderly women show an increased risk of CVD attributed to aging, less physically active, emotional disorders, and estrogen deprivation at time of menopause.27, 28 Moreover, scores for very elderly people may be influenced by external variation, and the very old who survive the study period may represent a different population from those who have previously died.29 When we analyzed the association stratified by age, the 95% CIs of sex‐specific estimates were also widely overlapping and participants aged >65 years were more sensitive to the association with reduced MMSE scores. The differences we observed between younger and older subgroups may also be caused by higher all‐cause mortality rate and lower CVD mortality rate in older subgroups as a result of the failure of traditional age‐related CVD risk markers.16
Our study has several strengths, including the large number of deaths from all causes and CVD disease during a 20‐year follow‐up period, while considering competing risk to illustrate the stability of the multivariable model for the elderly population in Beijing and adjusting for a broad range of potential confounders. Moreover, our study was conducted among a community‐dwelling elderly population with a generally poor education level and low baseline cognitive function in Beijing. We explored different adjustment strategies and sensitivity analysis to ensure relatively stable and reliable results. In addition, we found that each 5‐point decrease in baseline MMSE score increased the risk of all‐cause and CVD mortality. The increased relative risk for all‐cause and CVD mortality reported herein holds potential for clinical planning and decision making. However, our study also has some limitations. First, the MMSE is a common screening instrument, rather than a clinical assessment, and has limited ability to test executive or visuospatial functions and detect vascular cognitive dysfunction.23 Second, the MMSE includes 10 categories representing different domain items.7 We did not measure the association between different cognitive domains and mortality. Third, the relationship between rapid cognitive decline and mortality might differ among participants whose cognitive function did not decline or declined slowly. In our study, we only concentrated on baseline MMSE score and did not explore whether the change in MMSE score from baseline to follow‐up or transitions in cognitive status are associated with increased risk of all‐cause and CVD mortality. Furthermore, despite that the data were collected from a large, prospective cohort study in Beijing, study participants still cannot represent the Chinese older population. We look forward to the future large‐sample studies in China to confirm the results. Last, although we were able to adjust for a broad range of covariates, some potential confounders that were unmeasured or unable to be fully captured at baseline, such as renal dysfunction, creatinine clearance, and other residual confounders, might still not be available in our analysis.
Conclusion
The data from the BLSA indicated that cognitive impairment, as measured by baseline MMSE score, was associated with an elevated risk of all‐cause and CVD mortality. Our findings suggest the important value of screening for cognitive impairment among the elderly. Intervention to maintain high cognitive function in elderly people is important in reducing mortality risk, especially with regard to CVD.
Sources of Funding
The study was supported by The Program of National Natural Science Foundation of China (Serial No.: 81530087, 81703317).
Disclosures
None.
Supporting information
Table S1. Hazard Ratios (95% CI) for All‐Cause and Cardiovascular Disease Mortality According to Baseline Education Adjusted MMSE Cut Point
Table S2. Hazard Ratios (95% CI) for All‐Cause and Cardiovascular Disease Mortality According to Baseline MMSE Score in People Without Cardiovascular Disease (n=1599)
Acknowledgments
We sincerely thank those who participated in data collection and management.
(J Am Heart Assoc. 2018;7:e008252 DOI: 10.1161/JAHA.117.008252.)
Contributor Information
Xiuhua Guo, Email: statguo@ccmu.edu.cn.
Yanxia Luo, Email: lyx100@ccmu.edu.cn.
References
- 1. Alzheimer's Disease International . Dementia statistics. 2015. Available at: https://www.alz.co.uk/research/statistics. Accessed October 29, 2017.
- 2. Global Burden of Disease Study 2016 (GBD 2016) data resources. 2017. Available at: http://ghdx.healthdata.org/gbd-2016. Accessed October 29, 2017.
- 3. Sachs GA, Carter R, Holtz LR, Smith F, Stump TE, Tu W, Callahan CM. Cognitive impairment: an independent predictor of excess mortality: a cohort study. Ann Intern Med. 2011;155:300–308. [DOI] [PubMed] [Google Scholar]
- 4. Farid K, Zhang Y, Bachelier D, Gilson P, Teixeira A, Safar ME, Blacher J. Cognitive impairment and malnutrition, predictors of all‐cause mortality in hospitalized elderly subjects with cardiovascular disease. Arch Cardiovasc Dis. 2013;106:188–195. [DOI] [PubMed] [Google Scholar]
- 5. An R, Liu GG. Cognitive impairment and mortality among the oldest‐old Chinese. Int J Geriatr Psychiatry. 2016;31:1345. [DOI] [PubMed] [Google Scholar]
- 6. Gao S, Jin Y, Unverzagt FW, Cheng Y, Su L, Wang C, Ma F, Hake AM, Kettler C, Chen C. Cognitive function, body mass index and mortality in a rural elderly Chinese cohort. Arch Public Health. 2014;72:9. [DOI] [PMC free article] [PubMed] [Google Scholar]
- 7. O'Donnell M, Teo K, Gao P, Anderson C, Sleight P, Dans A, Marzona I, Bosch J, Probstfield J, Yusuf S. Cognitive impairment and risk of cardiovascular events and mortality. Eur Heart J. 2012;33:1777–1786. [DOI] [PubMed] [Google Scholar]
- 8. Yano Y, Bakris GL, Inokuchi T, Ohba Y, Tamaki N, Nagata M, Kuwabara M, Yokota N, Eto T, Kuroki M, Shimada K, Kario K. Association of cognitive dysfunction with cardiovascular disease events in elderly hypertensive patients. J Hypertens. 2014;32:423–431. [DOI] [PubMed] [Google Scholar]
- 9. Wright EJ, Grund B, Robertson K, Brew BJ, Roediger M, Bain MP, Drummond F, Vjecha MJ, Hoy J, Miller C. Cardiovascular risk factors associated with lower baseline cognitive performance in HIV‐positive persons. Neurology. 2010;75:864–873. [DOI] [PMC free article] [PubMed] [Google Scholar]
- 10. Melrose RJ, Ettenhofer ML, Harwood D, Achamallah N, Campa O, Mandelkern M, Sultzer DL. Cerebral metabolism, cognition, and functional abilities in Alzheimer disease. J Geriatr Psychiatry Neurol. 2011;24:127–134. [DOI] [PubMed] [Google Scholar]
- 11. Abete P, Della‐Morte D, Gargiulo G, Basile C, Langellotto A, Galizia G, Testa G, Canonico V, Bonaduce D, Cacciatore F. Cognitive impairment and cardiovascular diseases in the elderly. A heart‐brain continuum hypothesis. Ageing Res Rev. 2014;18:41–52. [DOI] [PubMed] [Google Scholar]
- 12. Leng X, Espeland MA, Manson JAE, Stefanick ML, Gower EW, Hayden KM, Limacher MC, Vaughan L, Robinson J, Wallace R. Cognitive function and changes in cognitive function as predictors of incident cardiovascular disease: the Women's Health Initiative Memory Study (WHIMS). J Gerontol. 2017;00:1–7. [DOI] [PMC free article] [PubMed] [Google Scholar]
- 13. Batty GD, Deary IJ, Zaninotto P. Association of cognitive function with cause‐specific mortality in middle and older age: follow‐up of participants in the English Longitudinal study of Ageing. Am J Epidemiol. 2016;183:183–190. [DOI] [PMC free article] [PubMed] [Google Scholar]
- 14. Georgakis MK, Papadopoulos FC, Protogerou AD, Pagonari I, Sarigianni F, Biniarisgeorgallis SI, Kalogirou EI, Thomopoulos TP, Kapaki E, Papageorgiou C. Comorbidity of cognitive impairment and late‐life depression increase mortality: results from a cohort of community‐dwelling elderly individuals in rural Greece. J Geriatr Psychiatry Neurol. 2016;29:195. [DOI] [PubMed] [Google Scholar]
- 15. Perna L, Wahl HW, Mons U, Saum KU, Holleczek B, Brenner H. Cognitive impairment, all‐cause and cause‐specific mortality among non‐demented older adults. Age Ageing. 2015;44:445–451. [DOI] [PubMed] [Google Scholar]
- 16. Kerola T, Hiltunen M, Kettunen R, Hartikainen S, Sulkava R, Vuolteenaho O, Nieminen T. Mini‐Mental State Examination score and B‐type natriuretic peptide as predictors of cardiovascular and total mortality in an elderly general population. Ann Med. 2011;43:650. [DOI] [PubMed] [Google Scholar]
- 17. Liu X, Chen Z, Fine JP, Liu L, Wang A, Guo J, Tao L, Mahara G, Yang K, Zhang J. A competing‐risk‐based score for predicting twenty‐year risk of incident diabetes: the Beijing Longitudinal Study of Ageing study. Sci Rep. 2016;6:37248. [DOI] [PMC free article] [PubMed] [Google Scholar]
- 18. Shi J, Song X, Yu P, Tang Z, Mitnitski A, Fang X, Rockwood K. Analysis of frailty and survival from late middle age in the Beijing Longitudinal Study of Aging. BMC Geriatr. 2011;11:17. [DOI] [PMC free article] [PubMed] [Google Scholar]
- 19. Shi J, Yang Z, Song X, Yu P, Fang X, Tang Z, Peng D, Mitnitski A, Rockwood K. Sex differences in the limit to deficit accumulation in late middle‐aged and older Chinese people: results from the Beijing Longitudinal Study of Aging. J Gerontol A Biol Sci Med Sci. 2014;69:702–709. [DOI] [PMC free article] [PubMed] [Google Scholar]
- 20. Feng L, Chong MS, Lim WS, Ng TP. The Modified Mini‐Mental State Examination test: normative data for Singapore Chinese older adults and its performance in detecting early cognitive impairment. Singapore Med J. 2012;53:458–462. [PubMed] [Google Scholar]
- 21. Sabia S, Guéguen A, Marmot MG, Shipley MJ, Ankri J, Singh‐Manoux A. Does cognition predict mortality in midlife? Results from the Whitehall II cohort study. Neurobiol Aging. 2010;31:688–695. [DOI] [PMC free article] [PubMed] [Google Scholar]
- 22. Matallana D, De SC, Cano C, Reyes P, Samperternent R, Markides KS, Ottenbacher KJ, Reyesortiz CA. The relationship between education level and Mini‐Mental State Examination domains among older Mexican Americans. J Geriatr Psychiatry Neurol. 2011;24:9. [DOI] [PMC free article] [PubMed] [Google Scholar]
- 23. Woodford HJ, George J. Cognitive assessment in the elderly: a review of clinical methods. QJM. 2007;100:469–484. [DOI] [PubMed] [Google Scholar]
- 24. Alonso A, Jacobs DR, Menotti A, Nissinen A, Dontas A, Kafatos A, Kromhout D. Cardiovascular risk factors and dementia mortality: 40 years of follow‐up in the Seven Countries Study. J Neurol Sci. 2009;280:79–83. [DOI] [PubMed] [Google Scholar]
- 25. Drew DA, Weiner DE, Tighiouart H, Scott T, Lou K, Kantor A, Fan L, Strom JA, Singh AK, Sarnak MJ. Cognitive function and all‐cause mortality in maintenance hemodialysis patients. Am J Kidney Dis. 2015;65:303–311. [DOI] [PMC free article] [PubMed] [Google Scholar]
- 26. Mosca L, Barrett‐Connor E, Wenger NK. Sex/gender differences in cardiovascular disease prevention what a difference a decade makes. Circulation. 2011;124:2145. [DOI] [PMC free article] [PubMed] [Google Scholar]
- 27. He L, Tang X, Li N, Wu YQ, Wang JW, Li JR, Zhang ZX, Dou HD, Liu JJ, Yu LP. Menopause with cardiovascular disease and its risk factors among rural Chinese women in Beijing: a population‐based study. Maturitas. 2012;72:132–138. [DOI] [PubMed] [Google Scholar]
- 28. Schultz‐Larsen K, Rahmanfard N, Kreiner S, Avlund K, Holst C. Cognitive impairment as assessed by a short form of MMSE was predictive of mortality. J Clin Epidemiol. 2008;61:1227–1233. [DOI] [PubMed] [Google Scholar]
- 29. Peltz CB, Corrada MM, Berlau DJ, Kawas CH. Cognitive impairment in nondemented oldest‐old: prevalence and relationship to cardiovascular risk factors. Alzheimers Dement. 2012;8:87–94. [DOI] [PMC free article] [PubMed] [Google Scholar]
Associated Data
This section collects any data citations, data availability statements, or supplementary materials included in this article.
Supplementary Materials
Table S1. Hazard Ratios (95% CI) for All‐Cause and Cardiovascular Disease Mortality According to Baseline Education Adjusted MMSE Cut Point
Table S2. Hazard Ratios (95% CI) for All‐Cause and Cardiovascular Disease Mortality According to Baseline MMSE Score in People Without Cardiovascular Disease (n=1599)